Infrastructure Health Index: How AI Calculates and Communicates Asset Condition
By Grace on May 29, 2026
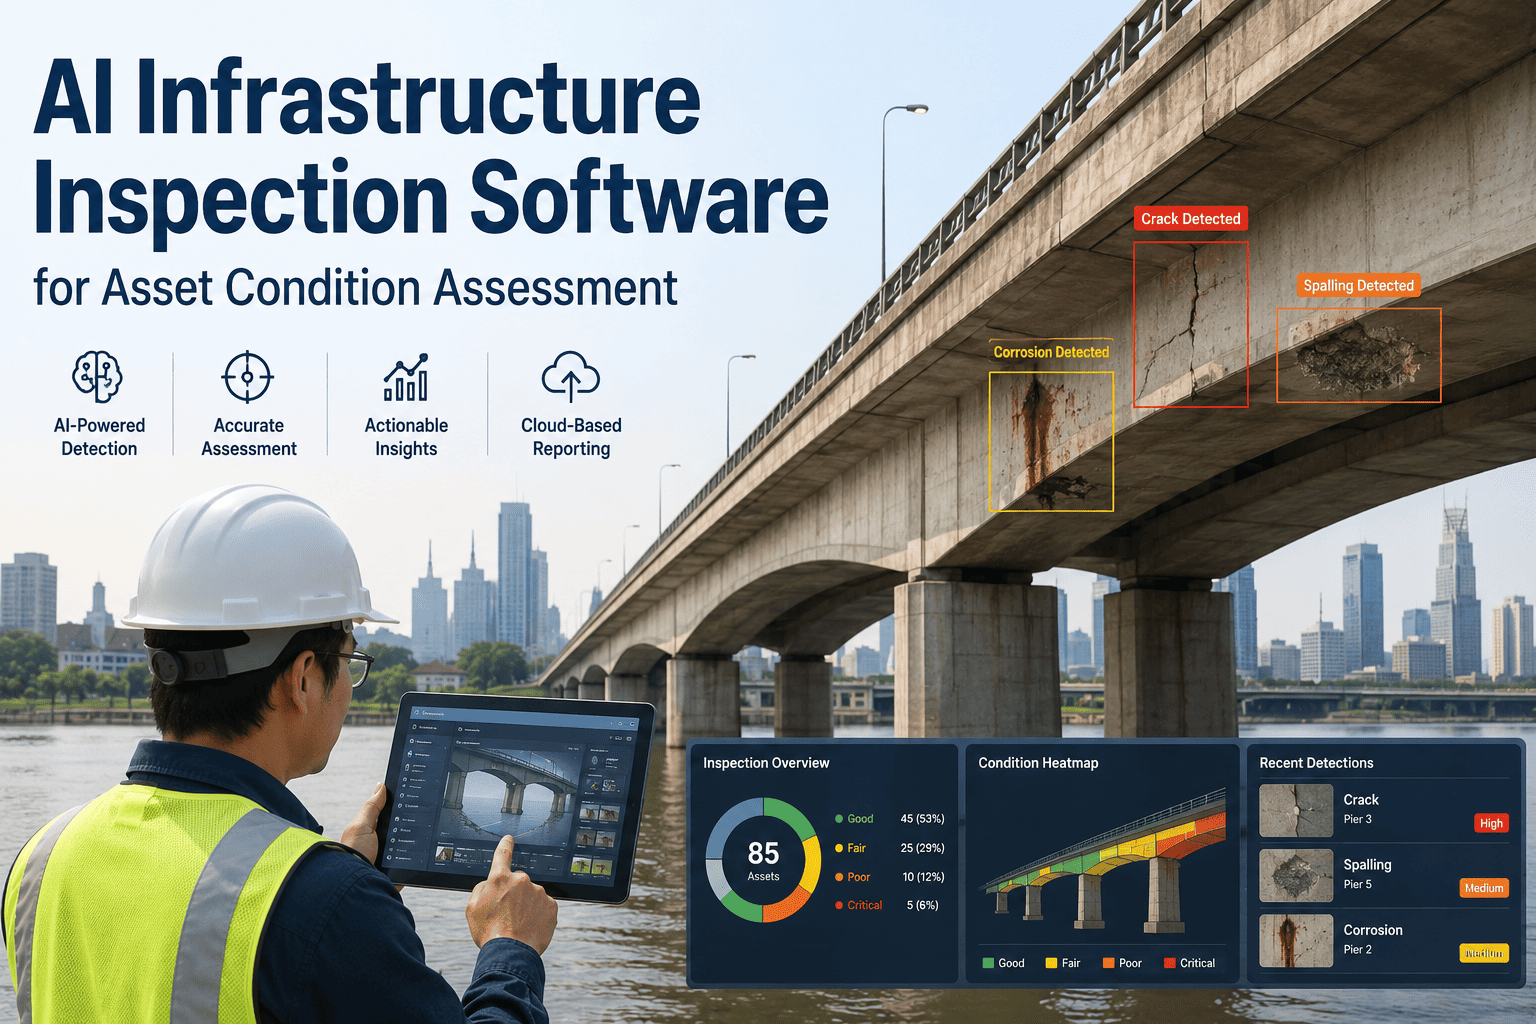
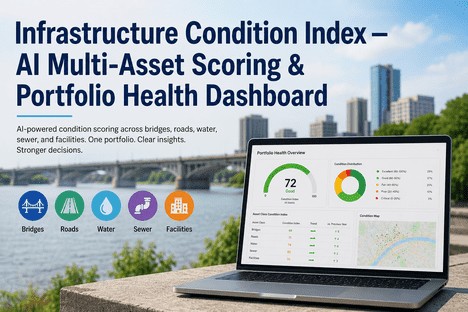
A bridge rated in "poor condition." A road network scoring 61 on the Pavement Condition Index. A water main flagged as high-risk. These are health indices — single numbers that compress months of sensor readings, inspection records, and maintenance history into a figure a decision-maker can act on. The problem is that most infrastructure organisations still calculate these scores the way they did in 1995: manual inspections on fixed cycles, averaged into a composite rating that is outdated the moment it is published. AI changes what a health index can be. Instead of a snapshot taken every two years, it becomes a live signal — continuously updated, multi-source, weighted by consequence, and accurate enough to drive capital planning and maintenance scheduling in real time. This article explains exactly how that works.
AI Health Scoring · Real-Time Condition Indices · Multi-Source Data Fusion
Your Infrastructure Health Score Should Update Every Hour — Not Every Two Years.
iFactory's AI platform continuously aggregates sensor readings, inspection records, and maintenance history into live health indices for every asset on your network — giving capital planners and maintenance teams a score they can actually trust.
US bridges rated in poor condition out of 623,000 — a rehabilitation gap that accurate health scoring helps prioritise
45%
Of US bridges have exceeded their 50-year design life — making dynamic condition monitoring more critical than ever
40%
Longer average asset service life achieved by high-reliability facilities using AI-driven health score monitoring
$191B
Estimated US bridge rehabilitation need — proactive health scoring is the only scalable way to allocate this gap efficiently
What an Infrastructure Health Index Actually Measures
An infrastructure health index (IHI) is a standardised numerical representation of an asset's current condition and performance capability — typically expressed on a 0–100 scale or colour-banded equivalent. It translates complex, multi-dimensional asset data into a single, auditable figure that maintenance managers, capital planners, and regulators can all read from the same page. What makes the AI version fundamentally different from conventional scoring is not the scale — it is what feeds into the score, how frequently it updates, and how the weighting is determined.
Conventional vs AI-Generated Health Index — The Core Differences
Conventional Index
Data Source
Manual inspection, conducted on fixed 2–5 year cycles. Point-in-time snapshot only.
Update Frequency
Annual or biennial. Score is stale the moment it is published.
Weighting Logic
Fixed weights set at system design — does not adapt to asset age, load history, or failure consequence.
Continuous sensor streams fused with inspection records, maintenance logs, and load/environment data.
Update Frequency
Real-time or near-real-time. Score reflects current asset condition, not condition at last inspection.
Weighting Logic
Dynamic weights learned from deterioration patterns and consequence severity — evolve as the asset ages.
Output Use
Live maintenance prioritisation, capital planning, regulatory reporting, and failure prediction.
How AI Builds the Score: The Five Data Inputs
A meaningful infrastructure health index is not a single number derived from a single source. AI-generated health scores aggregate five distinct input categories, each contributing a weighted component to the composite index. The weighting between them is not fixed — it is calibrated to the asset type, the consequences of failure, and what the historical data shows about which inputs best predict actual deterioration for that specific asset class.
01
Sensor Telemetry
Vibration, temperature, pressure, strain, flow — continuous real-time readings from installed IoT and IIoT sensors
02
Inspection Records
Structured condition ratings, visual defect logs, drone survey outputs, and non-destructive test results
03
Maintenance History
Work order completions, intervention dates and types, pre- and post-maintenance condition readings
04
Load and Usage Data
Traffic counts, tonnage throughput, operating hours, and cumulative service load since last intervention
05
Environmental Context
Temperature cycles, moisture exposure, corrosion risk zone, weather event history affecting the asset
How AI Converts Five Inputs Into One Composite Score
Step 1 — Normalise
Each input data stream is scaled to a common 0–100 range using min-max normalisation. A vibration reading of 4.2 mm/s and a visual crack rating of 3 become comparable values on the same scale.
Step 2 — Weight
AI assigns dynamic weights to each input category based on which signals have historically best predicted deterioration for this specific asset type. Sensor telemetry may carry 40% weight for a rotating pump; inspection records 55% weight for a bridge deck.
Step 3 — Composite
The weighted average of normalised inputs produces the composite health index score. The score updates whenever new data arrives — whether that is a sensor reading every 30 seconds or an inspection record every quarter.
Live Health Scoring · Multi-Source Aggregation · Capital Planning Intelligence
See a Live Health Index for Every Asset on Your Network — Updated in Real Time.
iFactory aggregates your sensor data, inspection records, and maintenance history into a single AI-generated health score per asset — continuously updated and visualised in a dashboard your whole team can read and act on.
Reading the Score: What Each Band Means for Maintenance Decisions
A health index score only creates value if it is translated into clear, actionable maintenance guidance. AI platforms segment the 0–100 scale into condition bands, each mapped to a specific maintenance action — from routine monitoring through to emergency intervention. The bands are not arbitrary: they correspond to defined deterioration trajectory phases that the AI model has learned from historical failure data for each asset class.
Score Band
Condition Status
Recommended Action
85 – 100
Good
Asset performing within expected parameters. Deterioration rate normal for asset age and load. No intervention indicated.
Continue scheduled monitoring. Capture trend data for deterioration model refinement.
70 – 84
Satisfactory
Minor deterioration detected. Asset remains serviceable. Preventive maintenance in this band has highest cost-to-benefit ratio.
Schedule preventive maintenance in next planning cycle. Flag for budget inclusion.
50 – 69
Fair
Moderate deterioration confirmed across multiple input signals. Increased monitoring frequency triggered. Intervention window closing.
Prioritise for intervention within current planning period. Intervention cost rises significantly if deferred below 50.
Immediate corrective maintenance. Escalate to capital programme if remediation cost exceeds threshold.
0 – 24
Critical / Failing
Asset at or near failure threshold. Continued operation poses safety or service risk. Emergency intervention or shutdown required.
Emergency response. Trigger shutdown protocols if applicable. Capital replacement assessment initiated.
How the Health Index Communicates to Different Stakeholders
The same underlying score serves different audiences — and AI platforms present it differently to each. A field technician needs to know which asset to work on today. A maintenance planner needs to know which assets will need intervention in the next 90 days. A capital planning director needs to know where the portfolio is heading over the next five years. The health index answers all three questions — from the same data, formatted for the decision the person in front of it needs to make.
Audience 01
Field Technician
Operational — daily decisions
What They See
A ranked list of assets by current health score, with the lowest scores at the top. Each asset shows its score, the rate of recent deterioration, and an auto-generated work order with the full asset history, recommended repair procedure, and required parts list attached.
Outcome: Technicians know exactly where to go and what to do — no interpretation required.
Audience 02
Maintenance Planner
Tactical — 30–90 day horizon
What They See
A deterioration trajectory view showing which assets are currently in the Fair band (50–69) and are projected to drop below 50 within the next 60 or 90 days — i.e., the intervention window before corrective cost escalation. Budget estimates for each intervention are attached.
Outcome: Planners build intervention programmes around assets actually approaching thresholds — not assets last inspected two years ago.
Audience 03
Capital Planning Director
Strategic — 3–10 year horizon
What They See
A portfolio-level health distribution showing the percentage of assets in each condition band today, projected forward 3 and 10 years under current maintenance spend. The AI calculates the "financial flip point" — where rehabilitation cost exceeds replacement value — for each asset approaching critical condition.
Outcome: CapEx bids are evidence-based — justified by remaining useful life data rather than asset age estimates.
"
FCI and PCI scores dictate exactly where funds will have the highest long-term impact on network health. Without precise, continuous condition assessment, transportation agencies over-spend on emergency rebuilds while starving healthy roads of the cheap preventive maintenance that would keep them functional for decades.
Why the Weighting Logic Is the Most Important Engineering Decision
Two assets with identical composite scores of 67 can be in completely different actual conditions — if the weighting behind each score is different. A pavement asset scoring 67 where visual cracking data carries 60% of the weight is a different risk profile than a pump asset scoring 67 where vibration telemetry carries 60% of the weight. Getting the weighting right is what separates a useful health index from a number that misleads capital planners. AI learns optimal weightings from historical data — specifically from the relationship between input signals and subsequent actual deterioration events — rather than applying the same formula to every asset class.
Example: How Weighting Differs by Asset Class
Bridge Deck
Visual Inspection45%
Structural Sensor Data30%
Traffic Load History15%
Env / Corrosion10%
Rotating Pump
Vibration Telemetry50%
Temperature Trends25%
Maintenance History15%
Operating Hours10%
Road Pavement
Pavement Condition Index40%
Traffic Load (AADT)30%
Maintenance History20%
Weather / Freeze Cycles10%
Conclusion
An infrastructure health index is only as valuable as the data behind it and the frequency at which it updates. AI-generated health scores replace the biennial inspection snapshot with a continuously recalculated composite figure — aggregating sensor telemetry, inspection records, maintenance history, load data, and environmental context into a single weighted index that is current, auditable, and actionable at every level of an infrastructure organisation. Field technicians, maintenance planners, and capital directors all read from the same score — formatted for the decision each needs to make, at the time scale each operates on.
iFactory's AI platform generates live health indices for every asset on your network, continuously updated from your existing sensor infrastructure and maintenance records. Book a Demo to see a live health score dashboard built on your asset data, or Talk to an Expert to begin the data onboarding process.
Frequently Asked Questions
For the weighting model to be fully calibrated from your own data, a minimum of 2–3 years of condition records and maintenance history per asset class is recommended — enough to observe at least one deterioration cycle. Where historical data is sparse, iFactory's platform uses pre-trained deterioration models for common asset classes (bridges, roads, pumps, pipelines) as a starting baseline, with the weights transitioning toward your own data as it accumulates. A partially data-calibrated score is still significantly more useful than a biennial inspection snapshot. Book a Demo to assess your data readiness.
Yes, with appropriate configuration. iFactory's health index outputs include a full audit trail for every score — showing which input data sources contributed, what weights were applied, and when the score was last updated. This audit trail meets the documentation requirements for most infrastructure asset management standards. Where a specific regulatory framework requires a defined condition rating methodology (such as the FHWA bridge condition rating system), the AI platform can be configured to calculate and output scores that map directly to the required scale, alongside the AI-generated index. Talk to an Expert to review the compliance documentation for your jurisdiction.
The score does not fail — it degrades gracefully. When a data source is unavailable, the AI redistributes the weighting to the remaining available inputs and flags the score with a confidence indicator showing which source is missing. The score remains valid and actionable; the confidence indicator tells the maintenance planner to treat it with slightly greater caution than a score generated from all five inputs. This is significantly better than a conventional system that simply has no score until the next scheduled inspection. Data gaps are also flagged as an action item — prompting sensor maintenance or inspection scheduling to restore full data quality. Book a Demo to see how data confidence is communicated in the dashboard.
Work orders are automatically generated when an asset's health score crosses a defined threshold — or when the AI's deterioration trajectory predicts a threshold crossing within a configurable future window. The work order is pre-populated with the asset's full condition history, the specific input signals that triggered the score drop, recommended repair procedures for the identified defect type, required spare parts, estimated duration, and cost. Work orders are prioritised by a combination of current score, rate of deterioration, and consequence severity — so the highest-impact interventions surface first. iFactory integrates with SAP Plant Maintenance, IBM Maximo, Infor EAM, and other common CMMS platforms so work orders flow directly into existing operational workflows. Talk to an Expert to connect your CMMS to the health index engine.
A health index your whole team can read — updated in real time, built from every data source you already have.
iFactory aggregates sensor data, inspection records, and maintenance history into live AI-generated health scores for every asset on your network — giving field teams, planners, and capital directors the same accurate picture from one unified platform. Book a Demo or sign up to see it on your data.