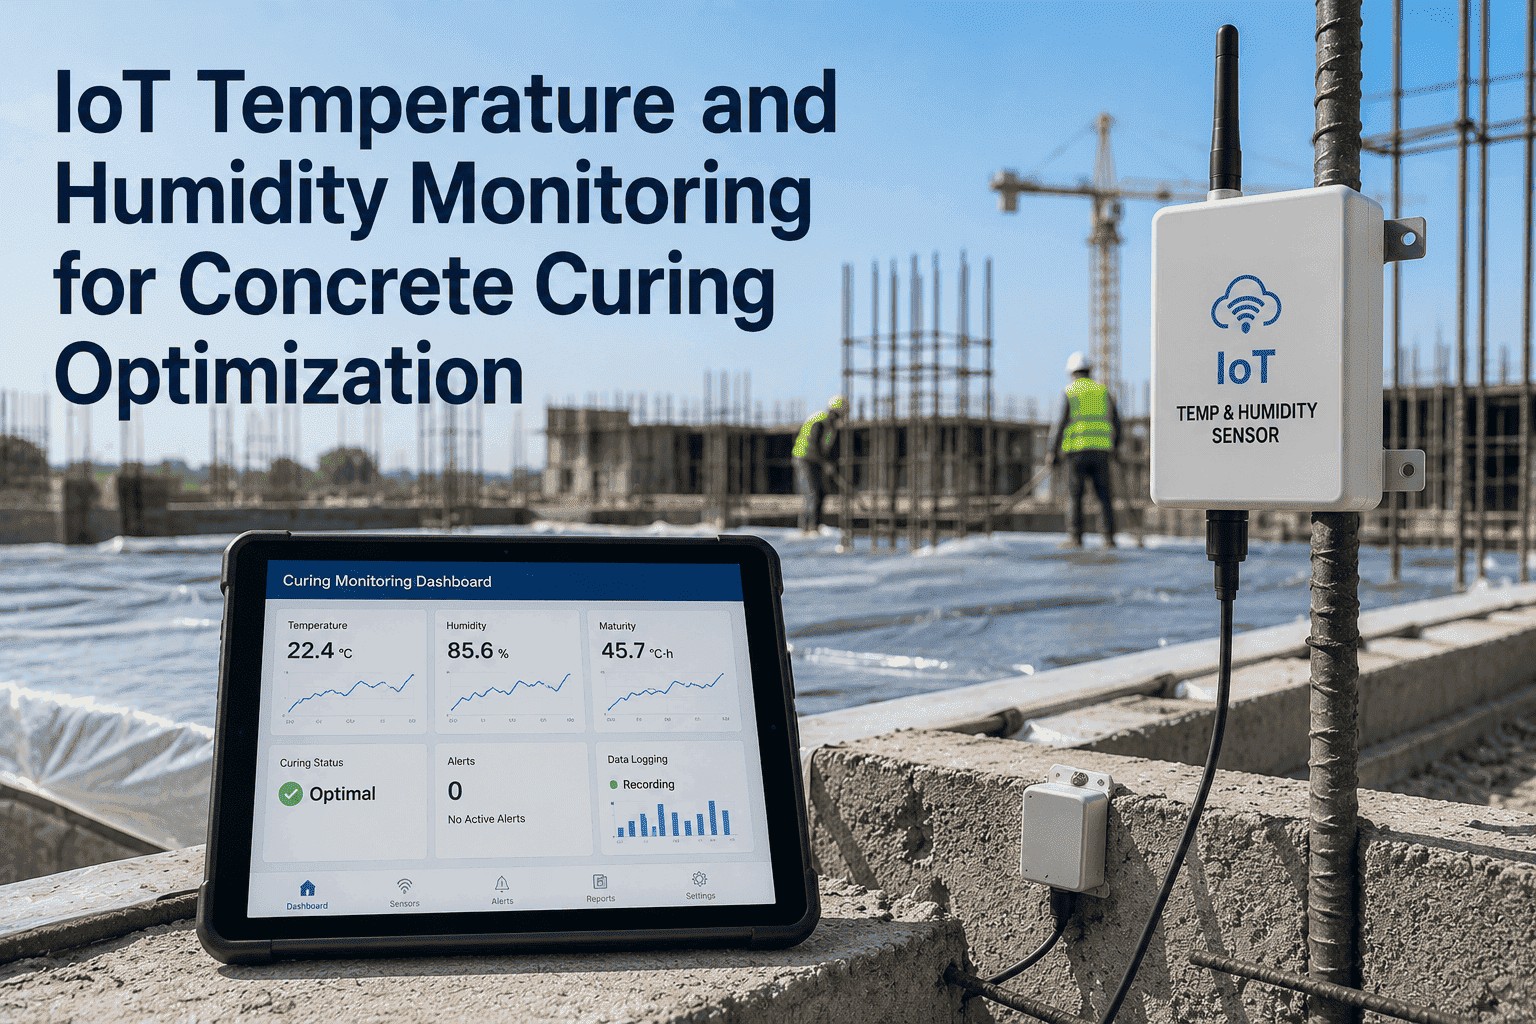
IoT Temperature and Humidity Monitoring for Concrete Curing Optimization

By Grace on May 27, 2026

iot-temperature-humidity-monitoring-concrete-curing

Concrete strength is not a material property — it is a process outcome. The same mix design poured at the same slump on the same day will produce 28-day compressive strengths that vary by 20 to 35% depending entirely on the temperature and humidity conditions the concrete experiences in the first 7 days after placement. Too cold, and the hydration reaction slows or stops — concrete that should reach 4,000 PSI at 28 days reaches 2,800 PSI, and the project either accepts the shortfall or tears out and replaces the pour. Too hot, and thermal cracking propagates through mass concrete elements — bridge piers, mat foundations, retaining walls — creating structural defects that compromise durability without triggering any immediate visible sign. Too dry, and plastic shrinkage cracking appears within hours of finishing. Each of these failure modes is fully preventable with real-time temperature and humidity monitoring and automated corrective action — yet the construction industry loses an estimated $4.2 billion per year in concrete rework, strength failures, and durability defects caused by inadequate curing management. IoT wireless sensor networks placed directly in and around concrete elements at the time of pour solve this with continuous, logged, alerting temperature and humidity monitoring that costs a fraction of the defect it prevents. Contractors and construction engineers that have deployed iFactory's concrete curing monitoring platform report 91% reduction in cold-weather strength failures, 78% reduction in thermal cracking events in mass concrete, and full ACI 305/306 curing condition compliance documentation generated automatically for every monitored pour.


IoT Curing Monitoring · Temperature · Humidity · Maturity Method · ACI 305/306 Compliance
Every Pour Has a Curing Window. IoT Sensors Make Sure You Never Miss It.
iFactory's wireless concrete monitoring sensors deploy at pour time — logging internal temperature and ambient humidity every 15 minutes, alerting your team before conditions drift outside the ACI curing envelope, and generating the compliance record your project specs require.
91%
Reduction in cold-weather concrete strength failures at iFactory-monitored pours
78%
Reduction in thermal cracking events in mass concrete elements under IoT monitoring
20–35%
Strength variance caused by inadequate curing — the defect IoT monitoring eliminates
100%
ACI 305/306 curing compliance documentation generated automatically for every pour

The Science Behind Why Curing Conditions Determine Strength — What Every Site Engineer Needs to Know

Concrete strength develops through a chemical reaction — cement hydration — that is exquisitely sensitive to temperature. The relationship is not linear: a 10°C drop in concrete temperature roughly halves the hydration reaction rate. This means that curing management is not a minor quality control step — it is the primary determinant of whether your concrete achieves the design strength that every structural calculation in your project assumes.

The Three Temperature Zones That Define Concrete Curing Outcomes
Below 10°C / 50°F
COLD WEATHER ZONE
Hydration slows to 50% or less of standard rate. Strength at 28 days may be 30–50% below design. Freezing at <-4°C causes permanent damage.
10–32°C / 50–90°F
OPTIMAL CURING ZONE
Full hydration rate. 28-day strength achieves or exceeds design. ACI minimum curing temperature satisfied. Standard curing period applies.
Above 32°C / 90°F
HOT WEATHER ZONE
Rapid moisture loss accelerates plastic shrinkage cracking. Differential temperature in mass concrete exceeds 35°F limit, causing thermal cracking.
The Maturity Method (ASTM C1074) formalizes this relationship as a Maturity Index — the time-temperature product that predicts strength development. iFactory's platform calculates real-time concrete maturity from sensor data, enabling structure-specific strength estimation without waiting for 28-day cylinder break results. Book a Demo to see maturity-based strength estimation running on your mix design data.

Five Curing Failure Modes IoT Monitoring Prevents — With Real Cost Data

Each curing failure mode has a specific trigger condition, a specific damage mechanism, and a specific cost consequence when it is not detected and corrected in time. IoT sensor monitoring with automated alert thresholds prevents all five by detecting the trigger condition before the damage threshold is crossed.

Cold
Cold-Weather Strength Failure
Concrete temperature drops below 50°F before reaching 500 PSI. Hydration reaction stalls. Structure does not achieve design strength at 28 days. Trigger: ambient temp <40°F without adequate protection.
Typical Cost if Undetected
$45K–$280K
Core drilling, testing, remediation or demolition/repour
Thermal
Mass Concrete Thermal Cracking
Internal-to-surface temperature differential exceeds 35°F (ACI 301) in mass concrete elements. Tensile stress from differential thermal contraction exceeds concrete tensile strength, initiating cracks. Trigger: core temp >35°F above surface or ambient.
Typical Cost if Undetected
$120K–$800K
Crack repair, durability assessment, structural review
Plastic
Plastic Shrinkage Cracking
Surface moisture evaporates faster than bleed water rises when surface humidity drops below 70% RH or wind speed exceeds 15 mph. Cracks form within 1–6 hours of placement before concrete has developed any tensile strength. Trigger: ambient RH <50% combined with temp >75°F.
Typical Cost if Undetected
$8K–$65K
Surface grinding, crack injection, or slab replacement
Early Strip
Premature Formwork Removal
Formwork stripped before concrete reaches 70% of design strength — the ACI minimum for safely carrying construction loads. In cold conditions, maturity-based strength estimates from IoT data show the actual strength at stripping time; without them, contractors rely on calendar time that assumes standard curing temperatures that were not achieved.
Typical Cost if Undetected
$200K–$2M+
Structural failure, emergency shoring, full repour
Dehydration
Drying Before Hydration Completes
Curing blankets or wet burlap removed too early in hot, dry, or windy conditions. Cement hydration requires water — once internal RH drops below 80%, hydration stops and strength gain ceases permanently. IoT humidity sensors inside the concrete element confirm that internal moisture is maintained through the required curing period.
Typical Cost if Undetected
$18K–$120K
Long-term durability reduction, surface scaling, retesting

How iFactory's Concrete Curing IoT System Works — From Sensor Placement to Compliance Report

iFactory's curing monitoring system is designed for site conditions — wireless sensors that go in at pour time, read continuously without any site internet requirement, and sync compliance data automatically when connectivity is available. Book a Demo to see iFactory's sensor placement workflow for your pour type and project specification requirements.

Step 01 — At Pour
Sensor Placement in Fresh Concrete
iFactory's wireless thermocouple/humidity probes are embedded in fresh concrete at the time of pour — typically at mid-depth at critical sections and at 2" depth for surface temperature differential monitoring. External ambient sensors attach to formwork or rebar cage to capture ambient temperature and RH simultaneously. Setup per sensor: under 5 minutes.
Sensor depth: Mid-depth + 50mm surface
Reads: Internal temp + ambient temp + RH
Step 02 — During Curing
Continuous Monitoring & Alert Generation
Sensors read every 15 minutes and log to onboard flash memory — no internet required for continuous monitoring. When connected to iFactory's cellular gateway, readings sync in real time and trigger automated SMS/push alerts when temperature drops below the cold-weather protection trigger (40°F), differential exceeds 35°F, or ambient RH drops below the plastic shrinkage risk threshold. Maturity Index is calculated continuously and displayed as real-time estimated compressive strength.
Log interval: 15 min standard; 5 min on alert
Offline: 90-day onboard memory
Step 03 — At Completion
Automated Compliance Report Generation
When the curing period ends, iFactory generates a full curing compliance report: timestamped temperature and humidity history, Maturity Index chart, ACI 305/306 threshold compliance summary, alert event log with corrective actions taken, and PDF export ready for the project record and owner submittals. No manual data download, spreadsheet formatting, or report writing required.
Output: ACI 305/306 compliance PDF
Standard: ASTM C1074 maturity record

Maturity Method · ASTM C1074 · ACI 305/306 · Cold Weather · Mass Concrete
See iFactory's Curing Sensor System Configured for Your Pour Type and Project Specification
iFactory configures your alert thresholds, maturity mix calibration, and compliance report format to your project spec before the first sensor deploys — so your team has the right alerts on day one of curing, not day seven.

IoT Curing Monitoring vs. Traditional Methods — Performance Comparison

Traditional curing monitoring — manual thermometer readings, daily inspection logs, calendar-based form stripping schedules — provides a compliance record but no real-time protection. The comparison below documents what the shift from manual to continuous IoT monitoring delivers across the outcomes that matter on a construction project.

Criterion Manual / Traditional IoT Continuous (iFactory) Project Impact
Monitoring Frequency 2–3× daily — misses overnight temperature drops Every 15 min — 96 readings per day, 24/7 Catches 3 AM temperature drops — the most common cold-weather failure trigger
Alert Response Time Next scheduled inspection — up to 8 hours after event SMS / push within 15 min of threshold breach 15 min vs. 8 hr response prevents cold-weather damage in the critical early hours
Mass Concrete Differential Surface vs. core read at same visit — not continuous Real-time differential calculation — alerts at 30°F before 35°F limit 78% reduction in thermal cracking events — intervention before damage threshold
Formwork Strip Decision Calendar time based on assumed curing temperature Maturity-based strength estimate — strip when 70% f'c confirmed Eliminates premature strip risk; can also strip earlier in warm weather
Compliance Documentation Manual log sheets — labour intensive, incomplete overnight Auto-generated PDF report — ACI 305/306 compliant, zero labour Full pour record ready at curing completion — no chasing logs

Expert Review

I have been managing quality control on structural concrete for twenty-three years — highway bridges, parking structures, foundations, water infrastructure — and I can tell you that the number of concrete-related rework events I have seen that were directly attributable to inadequate curing monitoring is not small. The pattern is almost always the same: the pour is done correctly, the mix design is right, the placement is right, but the curing conditions are wrong for 24 to 48 hours during a weather event, and the strength failure shows up on cylinder breaks three or four weeks later when the structure may already be loaded. By that point, the options are bad: core drill, load test, accept the deficiency with engineering justification, or demolish and repour. Every one of those options is expensive. The IoT monitoring approach changes the economics completely, because it detects the curing condition problem while there is still time to correct it — add heat, add blankets, add water, extend the curing period. The correction cost is a few hundred dollars. The non-correction cost is tens to hundreds of thousands. I also want to note the maturity method capability, because this is underutilized in U.S. practice and it should not be. When you have real-time temperature data from sensors embedded in the concrete, you can calculate a continuous compressive strength estimate from the maturity index. That means your formwork strip decision, your backfill decision, and your load application decision are based on the actual strength the concrete in that element has achieved — not the strength a test cylinder achieved under standard curing conditions that may be very different from the actual field conditions. That is not just a quality control benefit. It is a schedule benefit — in warm weather you can often strip earlier than the calendar-based schedule allows, and in cold weather you avoid the false confidence of a schedule that assumed temperatures that were not achieved.

— Senior Quality Control Engineer, Structural Concrete — 23 Years — PE Licensed, ACI Certified Field Testing Technician Grade I, ASCC Concrete Foreman Certification

Conclusion

Concrete curing failure is an entirely preventable defect — every failure mode has a detectable precursor condition, every precursor condition has a correction action, and the window between the precursor and the damage is always longer than a 15-minute IoT alert-to-response cycle. The industry's $4.2 billion annual bill for concrete curing defects is not a materials or design problem. It is a monitoring problem: the right temperature and humidity data was not available in real time to the people who could have acted on it.

iFactory's wireless concrete curing monitoring platform delivers the complete protection chain — sensor placement at pour, continuous temperature and humidity logging, real-time threshold alerts to site superintendents, maturity-based strength estimation for data-driven form stripping decisions, and automatic ACI 305/306 compliance documentation at curing completion. The 91% cold-weather failure reduction, 78% thermal cracking reduction, and 100% automated compliance documentation reported at monitored pours are the direct result of having the right data at the right time. Book a Demo to see iFactory's curing monitoring configured for your pour type and project specification requirements.


Frequently Asked Questions

No. iFactory's sensors store readings to onboard flash memory — 90 days of 15-minute interval data — without any connectivity requirement. Real-time alerts and cloud sync require the cellular gateway unit (included in the deployment kit), which uses LTE-M and does not require site Wi-Fi. For below-grade, underground, or RF-shielded pours, the gateway is positioned within the sensor's 300m Bluetooth Low Energy range to relay data to cellular. Remote sites with no cellular coverage use satellite (Iridium) backup connectivity.

iFactory's maturity strength estimation follows ASTM C1074 — the industry standard for maturity-based strength prediction. The method requires an initial mix calibration (strength-maturity relationship developed from lab cylinders cured at varying temperatures), which iFactory configures from your mix design data before deployment. With proper calibration, maturity estimates typically achieve ±8% accuracy vs. actual in-place strength. Most project specifications accept ASTM C1074 maturity estimates for form stripping and load application decisions. ACI 306R and 347.2R explicitly reference the maturity method for cold-weather and mass concrete applications. Book a Demo for a maturity calibration walkthrough.

iFactory offers two sensor configurations: expendable concrete-embedment probes (designed to remain in the element after curing — lowest per-pour cost, no retrieval required) and retrievable surface probes with external humidity/temperature sensors for ambient monitoring (reusable across pours, slightly higher unit cost). Sensor count per pour: 2–4 for slabs and walls under 500 SF; 4–8 for mass concrete elements. ACI 308R recommends a minimum of one sensor per 500 CF of concrete for mass concrete thermal monitoring. Most active job sites deploy a sensor pool per project and redeploy retrieved sensors between pours on a 24–48 hour turnaround cycle.

Yes. iFactory's curing compliance reports are generated as branded PDF documents containing the pour identification data, sensor placement diagram, complete timestamped temperature and humidity log, maturity index chart with estimated strength curve, ACI 305/306 threshold compliance summary table, alert event log with response documentation, and digital certification signature. The format satisfies FDOT, Caltrans, TxDOT, and most state DOT special provisions for concrete curing documentation, as well as USACE CQC Plan requirements. Reports can be auto-delivered to owner QC contacts and inspection firms on the configured email distribution list at curing period end.

iFactory's curing monitoring system costs $18–$45 per pour for expendable probe configurations (sensor left in concrete) or $280–$480 per sensor for the reusable probe system amortized over 20–30 pour cycles. For a highway bridge project with 80–120 pours over an 18-month schedule, total monitoring cost typically runs $2,400–$5,400 — compared to a single cold-weather repour event that typically costs $45,000–$280,000. Platform subscription for a project-level account is $180–$360/month covering unlimited pours, automated reporting, and alert management. Book a Demo for a project-specific pricing estimate.


Every Pour Deserves to Achieve Its Design Strength. IoT Monitoring Makes Sure It Does.
iFactory's concrete curing monitoring platform prevents the cold-weather failures, thermal cracks, and premature strip decisions that turn a correctly designed pour into a costly rework event — for a fraction of the cost of the defect it prevents.

Share This Story, Choose Your Platform!