Every failed batch in a biologics facility costs between $500,000 and $2 million in direct losses — and that figure does not account for delayed patient access to life-saving therapies, regulatory scrutiny, or reputational damage following a deviation notice. As biopharmaceutical manufacturers scale production of monoclonal antibodies, gene therapies, and biosimilars, the analytical gap between equipment-generated data and actionable process intelligence has become the single greatest source of preventable yield loss. With the global biotechnology equipment market projected to reach $143.9 billion by 2030 at an 8.6% CAGR, organizations that close this gap first will capture disproportionate manufacturing share in a market where capacity is the competitive moat.
Is Your Bioprocess Equipment Generating Intelligence or Just Data?
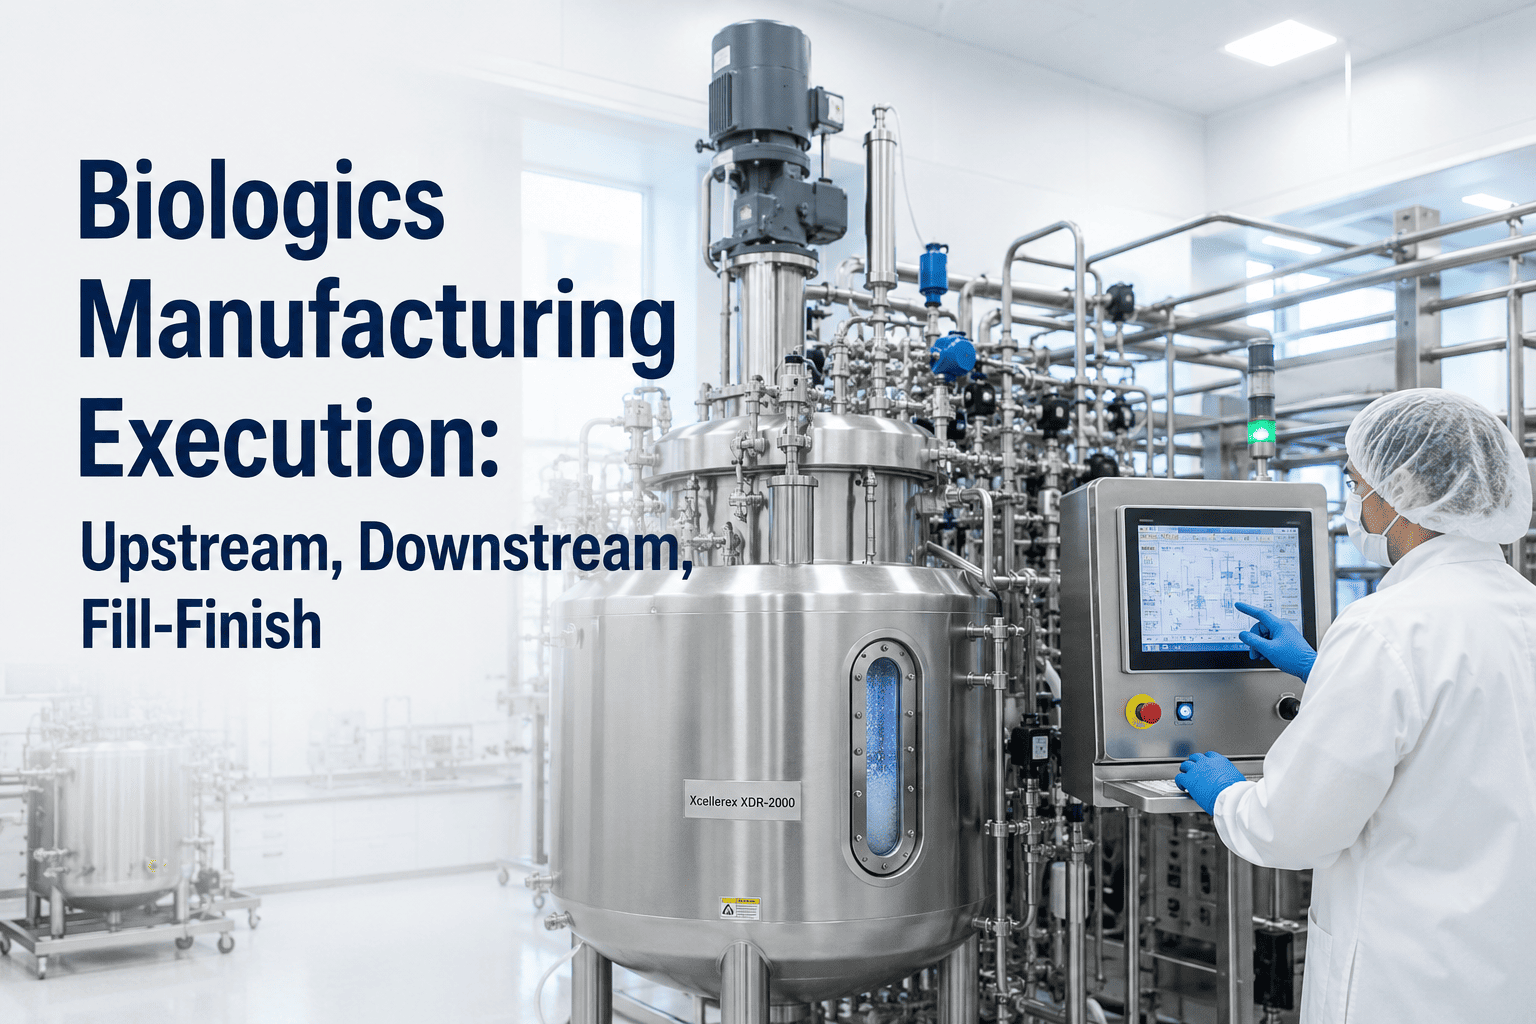
iFactory transforms raw sensor telemetry from bioreactors, chromatography skids, UF/DF systems, and fill-finish lines into predictive manufacturing intelligence that protects every batch.
The $143.9B Biotech Equipment Market Demands Analytics-Grade Intelligence
Bioprocessing analytics equipment is projected to reach $5.8 billion by 2033 at a 7.2% CAGR — yet most manufacturing organizations still operate in a pre-analytics paradigm where data lives in historian silos, deviations are discovered post-batch, and equipment performance is measured against static SOP thresholds rather than dynamic process models. Book a demo to see how iFactory's AI layer integrates directly with your existing bioprocess historian infrastructure to convert raw equipment data into batch predictors.
Bioreactor Analytics
Real-time monitoring of DO, pH, temperature, agitation, and dissolved CO2 profiles with AI models that predict cell viability decline up to 14 hours before a batch deviation is logged in the electronic batch record.
Chromatography Intelligence
Adaptive column loading and gradient optimization informed by UV absorbance profiles and resin age tracking — eliminating manual reinjection cycles that compress downstream throughput and inflate CoGS per gram.
UF/DF System Monitoring
Predictive transmembrane pressure modeling and flux decline detection that optimize buffer consumption and extend membrane cassette lifecycle across concentration and diafiltration cycles for biologics drug substance.
Fill-Finish AI Vision
Computer vision inspection for particulate matter, container-closure integrity, and fill-volume deviations — enabling real-time rejection without post-batch AQL sampling delays across vial and prefilled syringe lines.
Comparison Matrix: Legacy Friction vs. iFactory Manufacturing Intelligence
The cost of operating bioprocess equipment without an integrated analytics layer is embedded in your batch record review hours, yield variance reports, and equipment OEE gaps. This matrix quantifies the operational and financial distance between fragmented legacy approaches and a GMP AI-analytics platform built for biologics manufacturing. Consult our architects to map this against your specific equipment portfolio and site scale.
| Equipment Domain | Legacy Friction | iFactory Analytics | KPI Impact | Compliance Benefit |
|---|---|---|---|---|
| Bioreactor (USP) | Post-batch deviation analysis | 14-hour predictive deviation alert | 99.2% batch success rate | 21 CFR Part 11 |
| Chromatography | Fixed gradient, manual reinjection | AI dynamic loading optimization | 23% yield increase | ICH Q10 Excellence |
| UF/DF Systems | Fixed TMP, time-based cycles | Predictive flux decline modeling | 35% buffer cost reduction | GMP Annex 11 |
| Fill-Finish Lines | Post-batch AQL visual inspection | Real-time computer vision QC | 0.02% defect escape rate | FDA 21 CFR 211 |
| CIP/SIP Systems | Time-based cleaning schedules | Sensor-validated clean cycles | 40% water and steam savings | ICH Q7 Compliance |
How iFactory Delivers Outcomes Across Your Biologics Production Chain
The translation from equipment analytics to clinical and financial outcomes is where executive confidence is built. The following three domains represent the highest-ROI implementation zones across upstream cell culture, downstream purification, and sterile fill-finish — each carrying distinct batch yield levers, GMP compliance requirements, and staff efficiency multipliers. Book a demo to see all three operational zones on a live iFactory platform instance.
Upstream Cell Culture
Continuous bioreactor monitoring with AI-generated feeding strategy adjustments prevents cell viability drops that silently erode volumetric productivity. Operators are freed from manual sampling cycles, reducing time-on-floor by 40% while increasing viable cell density targets per campaign.
Downstream Purification
Chromatography column performance degradation is predicted before yield loss is measurable in eluate purity. Dynamic buffer consumption analytics directly reduce CoGS per gram for monoclonal antibody and enzyme purification trains across multi-product manufacturing facilities.
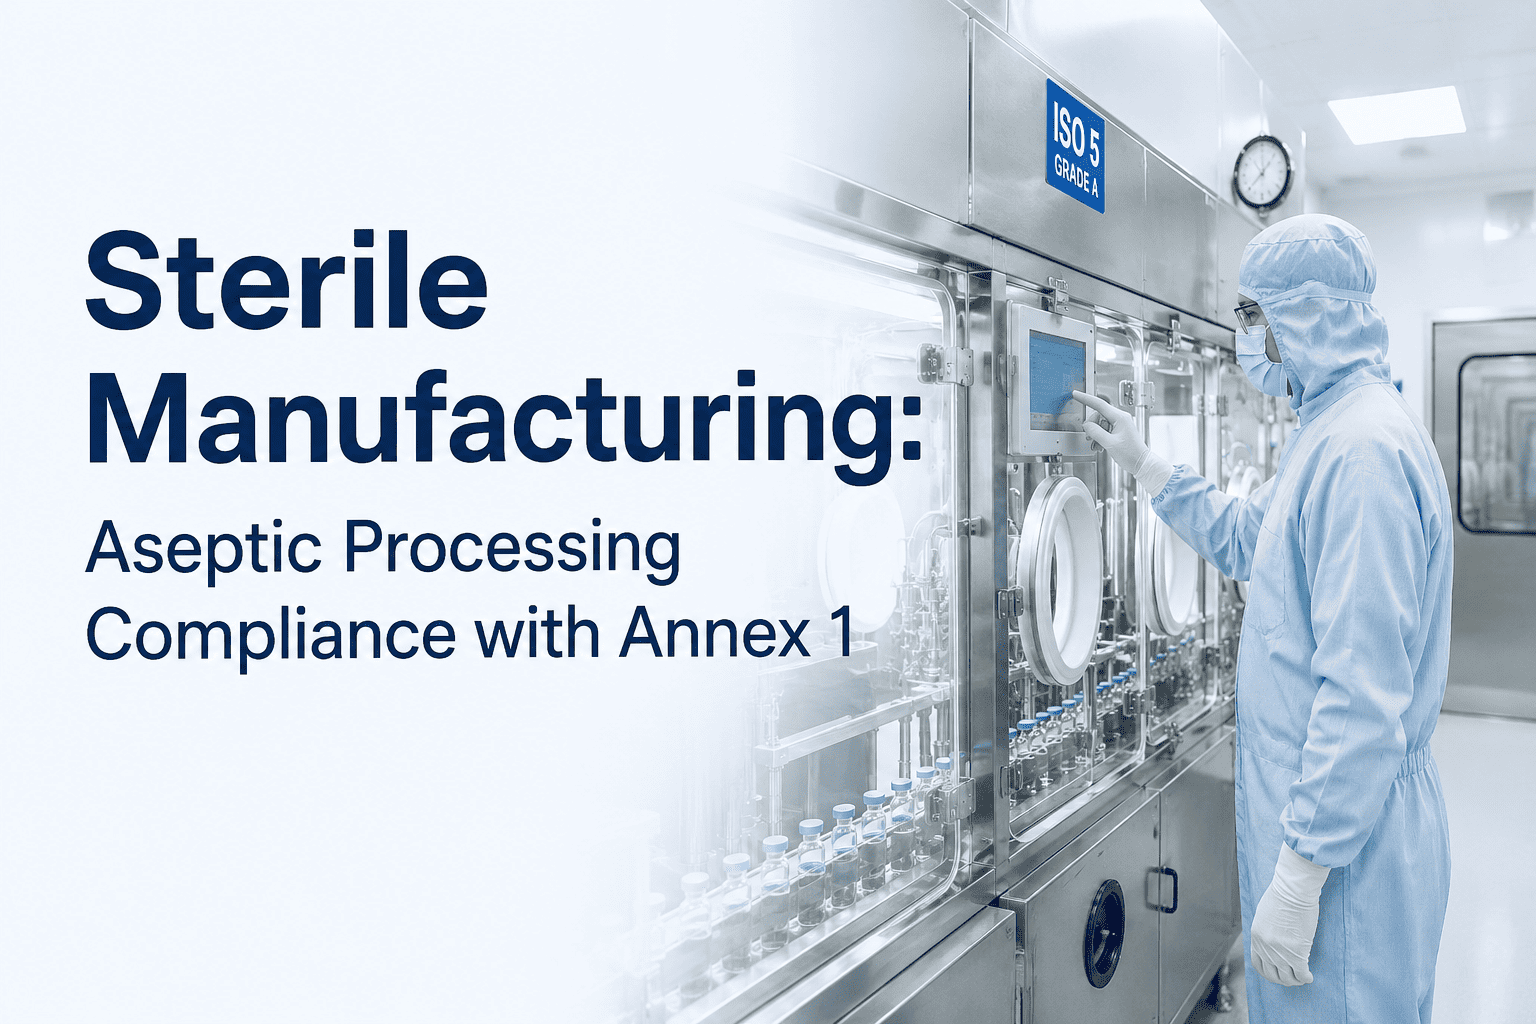
Sterile Fill-Finish
Computer vision QC modules on vial and syringe filling lines reduce the inspection workforce burden by 60% while driving defect escape rates below regulatory action thresholds. Every rejection event is auto-logged with timestamped image evidence for GMP batch records.
Six Gaps Silently Eroding Your Biologics Manufacturing Performance
Most biologics manufacturing sites do not suffer from a lack of data — they suffer from a lack of integrated intelligence. These six gaps represent the most common structural weaknesses identified across biopharmaceutical production environments without a unified analytics platform. Teams regularly book a demo to benchmark their manufacturing analytics maturity against an integrated iFactory baseline and identify priority resolution zones.
DCS, SCADA, and LIMS data operating in disconnected systems — preventing the cross-unit operation correlation required for root cause analysis and process trend modeling across the full manufacturing train.
Post-batch deviation analysis that identifies problems after product has been manufactured — generating costly investigations and potential batch rejections that real-time alerting could have prevented entirely.
SOP-driven operating ranges that do not account for raw material variability or inoculum quality differences — creating unnecessary batch-to-batch yield variance that compounds across campaigns and increases release investigation burden.
Skilled QC analysts performing visual inspection on high-speed fill-finish lines at throughputs exceeding human detection limits — creating both compliance risk and operational throughput constraints at the final drug product release stage.
Analytics tools deployed without IQ/OQ/PQ documentation or 21 CFR Part 11 audit trail compliance — generating intelligence that cannot be used as GMP evidence in regulatory submissions or inspection responses.
Chromatography resins and UF/DF membrane cassettes replaced on fixed schedules rather than performance-triggered cycles — generating unnecessary material costs and premature consumable change documentation burden across purification suites.
Close the Analytics Gap. Protect Every Batch. Reduce CoGS Across Your Biologics Portfolio.
iFactory gives biopharmaceutical operations leaders a single GMP-compliant analytics platform covering every critical unit operation from cell culture to final drug product.
Biotech Manufacturing Analytics — Questions From Operations Leadership
Does iFactory integrate with existing DCS and SCADA historian systems?
Yes. iFactory connects to OSIsoft PI, Emerson DeltaV, Siemens SIMATIC, and Honeywell Uniformance via standard OPC-UA and RESTful API bridges — requiring zero modifications to your validated control architecture or existing GMP-qualified historian configurations.
How does the platform satisfy 21 CFR Part 11 and Annex 11 obligations?
Every data write, model prediction, and operator acknowledgment generates an immutable timestamped audit trail with role-based access logging. The system ships with a pre-written validation protocol package and supports electronic signature workflows compliant with FDA 21 CFR Part 11 and EU GMP Annex 11. Book a demo to review the full compliance documentation library.
What is the typical payback period for a biologics manufacturing site?
Sites operating 2,000-liter or larger bioreactor trains typically achieve full platform cost recovery within 14 months through reduced batch failure rates, optimized buffer and media consumption, and decreased QC labor costs across fill-finish operations. Multi-product CDMOs see accelerated ROI through faster technology transfer timelines.
Can the AI models handle process changes such as scale-up or new cell lines?
iFactory's adaptive model framework supports continuous retraining as new batch data is generated. Scale-up from clinical to commercial manufacturing, cell line changes, and media reformulations are handled via a structured model revalidation workflow that generates updated qualification documentation automatically.
How does iFactory support continuous bioprocessing environments?
Continuous bioprocessing requires higher-frequency analytics with tighter control loop integration. iFactory supports perfusion bioreactor configurations, continuous chromatography systems, and inline PAT sensor integration — delivering sub-minute decision latency for steady-state operations. Consult our bioprocess architects to map your continuous process requirements.
What equipment OEE benchmarks can biologics facilities realistically target?
Based on implemented site data, bioreactor OEE improves from an industry average of 58% to 79% within 18 months of iFactory deployment, driven by elimination of unplanned cleaning cycles, reduction in process hold events, and improved schedule adherence across upstream and downstream handoffs.
Start With a Bioprocess Equipment Analytics Audit — No Obligation
Our biologics manufacturing specialists will benchmark your equipment analytics maturity and identify the three highest-ROI intervention zones across your production chain.