Every hour your pharma shop floor runs on paper-based batch records, manual OEE logging, and verbal shift handoffs, you are not just losing efficiency — you are absorbing regulatory exposure, operator error cascades, and revenue that quietly evaporates before it ever hits your P&L. The average mid-size pharma manufacturer loses $4.2M annually to paper-based deviation handling alone. The 90-day window is not a luxury timeline. It is the threshold between controlled transformation and crisis-driven overhaul.
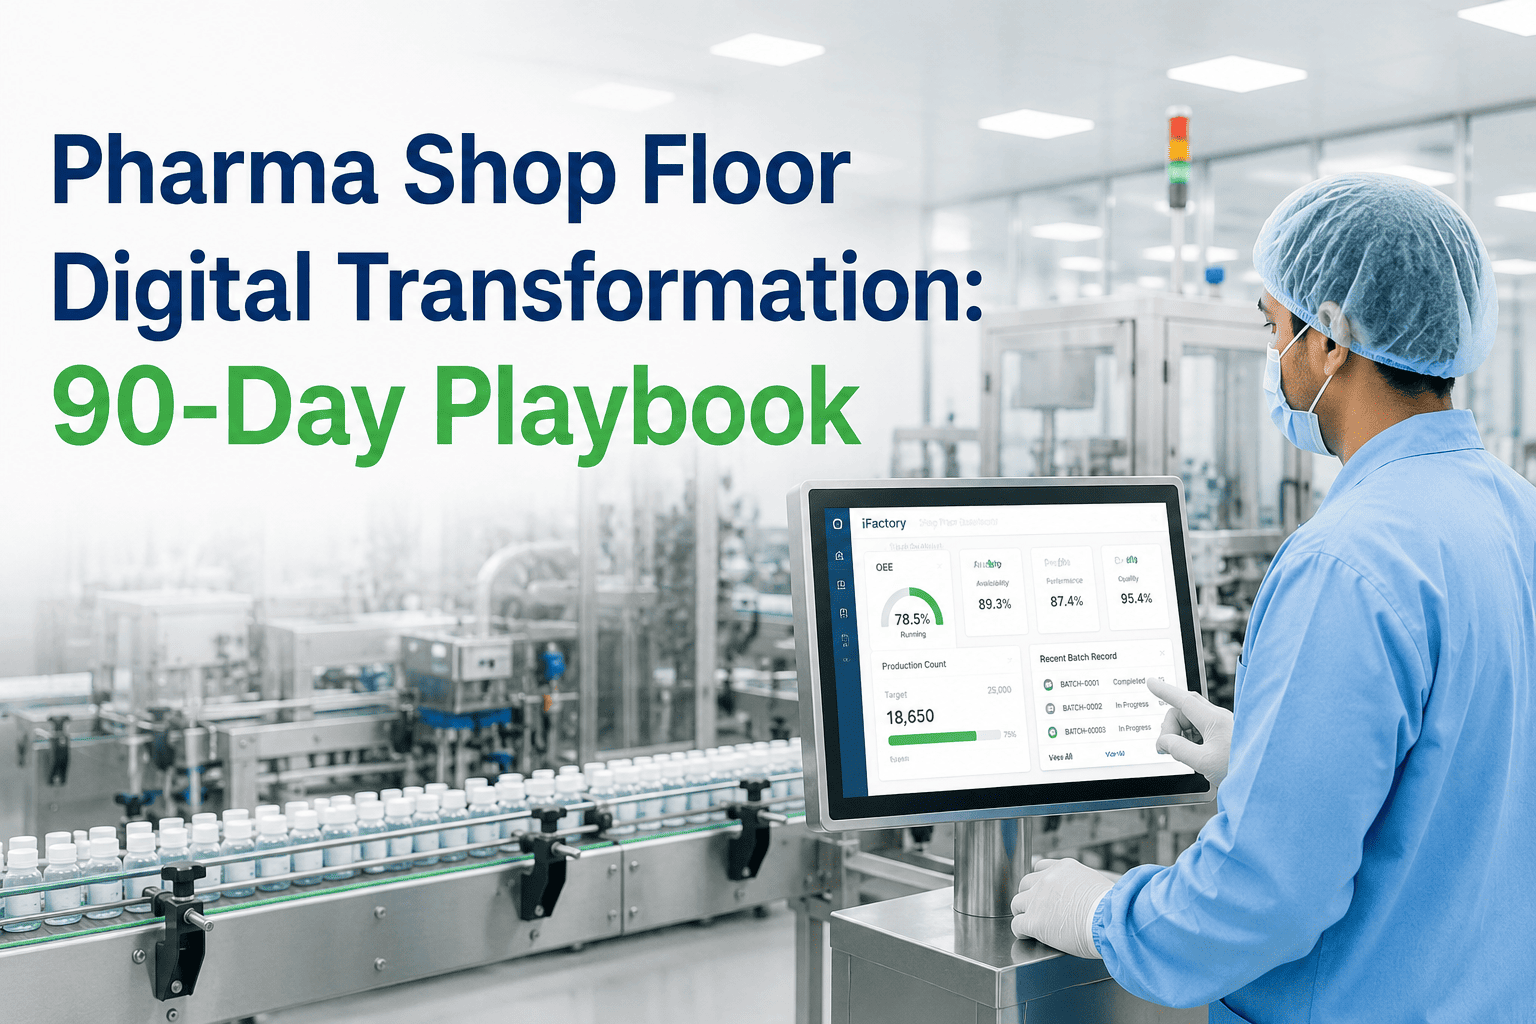
iFactory Shop Floor Intelligence
Pharma Shop Floor Digital Transformation: The 90-Day Playbook
A staged, production-safe rollout covering Electronic Batch Records, real-time OEE, and operator enablement — without halting a single manufacturing run.
90
Day rollout — zero production halt
68%
Reduction in deviation cycle time
$4.2M
Avg. annual loss from paper-based ops
3×
Faster batch release with EBR
The Cost of Staying Paper-Based
Legacy shop floors are not neutral — they are actively expensive. Before mapping the 90-day playbook, executives need a clear view of what inaction costs every quarter.
⚠
Regulatory Exposure
- FDA 483 observations tied to paper record gaps
- Batch rejection rates 3–5× higher vs. digital peers
- Manual audit trails fail 21 CFR Part 11 readiness
?
Revenue Hemorrhage
- Batch release delayed 6–14 days via paper MBR cycles
- OEE invisibility masks 12–18% hidden capacity loss
- Rework and scrap costs untracked until month-end close
?
Operator Burnout
- Shift handoffs rely on verbal communication — error-prone
- Operators spend 22% of shift on documentation vs. production
- No real-time escalation path for critical deviations
The 90-Day Staged Rollout Framework
iFactory's implementation model is built for live pharma environments. No big-bang cutover. No system downtime. Three sequential phases, each delivering measurable value before the next begins.
Gate EBR live on 2 pilot lines — data flowing, zero paper backfill
Foundation: EBR & Data Infrastructure
Key Actions
Audit existing paper MBR and SOP library — map to digital equivalents
Deploy EBR templates on 2 highest-volume production lines
Integrate with existing ERP/LIMS via standard API connectors
Configure 21 CFR Part 11 electronic signature workflows
Establish baseline KPIs: batch cycle time, deviation count, right-first-time rate
Expected Outcome
Electronic batch records live on pilot lines. Audit-ready data captured from Day 1. Zero disruption to adjacent lines still on paper. Baseline metrics documented for ROI comparison.
Gate Real-time OEE dashboard validated by operations team
Visibility: Real-Time OEE & Deviation Management
Key Actions
Activate OEE dashboards across all instrumented equipment
Deploy automated deviation capture with CAPA workflow triggers
Enable shift handoff digital logs — eliminating verbal transfer risk
Operator training: tablet-based guided workflows, role-based alerts
First real-time production visibility report delivered to site director
Expected Outcome
Operations team sees live OEE for first time. Deviation cycle time drops within weeks. First quantified savings from eliminated rework and faster CAPA closure reported to leadership.
Gate Full-site digital rollout complete — paper MBR formally retired
Scale: Full-Facility Digitalization & Operator Enablement
Key Actions
Extend EBR and OEE to all remaining production lines
Activate AI-assisted batch review — flag anomalies before QA review
Launch operator performance dashboards and gamified compliance tracking
Automate regulatory reporting outputs: batch disposition, deviation summaries
ROI business case compiled — full financial and quality impact documented
Expected Outcome
Paper MBR eliminated facility-wide. Batch release accelerated by 3×. Regulatory audit readiness confirmed. Full ROI case ready for board-level reporting within 90 days of go-live.
Legacy Friction vs. iFactory Optimised Excellence
The gap between paper-based operations and a digitally-enabled shop floor is not incremental — it is structural. This matrix translates that gap into language that CFOs, COOs, and QA Directors immediately recognise.
Legacy Friction
iFactory Optimised
Batch Record Completion
Manual paper fill — 6–14 day cycle, frequent errors and backfills
Electronic guided workflow — real-time completion, 3× faster release
OEE Visibility
Weekly spreadsheet — data 5–7 days old before review
Live dashboard — minute-level availability, performance, quality metrics
Deviation Handling
Paper CAPA forms — 21-day average cycle, missed root causes
Automated capture and CAPA trigger — 68% cycle time reduction
Shift Handoff
Verbal transfer — critical context lost, operator error risk elevated
Digital structured handoff log — zero information loss between shifts
Regulatory Readiness
Audit prep requires 2–4 weeks of manual record collation
Always audit-ready — 21 CFR Part 11 compliant records on demand
Operator Capacity
22% of shift lost to documentation tasks
Documentation time cut to under 6% — operators focused on production
Clinical & Operational Impact Grid
The downstream effects of shop floor digitalization extend beyond efficiency metrics. Three critical dimensions define the transformation value for pharma operations leadership.
?⚕️
Staff Burnout Reduction
- Documentation burden cut from 22% to under 6% of shift time
- Guided digital workflows eliminate decision fatigue on complex SOPs
- Real-time alerts replace reactive firefighting culture
- Operator confidence increases — clear accountability at every step
?
Production Throughput
- OEE visibility uncovers 12–18% hidden capacity in most facilities
- Batch cycle time reduction of 30–45% within 60 days
- Planned downtime replaces unplanned stoppages via predictive triggers
- Right-first-time batch rate improves to 94%+ industry benchmark
?️
Patient Safety & Quality
- AI-assisted batch review flags anomalies before QA sign-off
- Deviation trend analysis identifies systemic risk before escalation
- Full electronic audit trail — every action timestamped and attributed
- Zero transcription errors — data captured at source, not transcribed
90 Days to Full Digital Operations
Your Pharma Shop Floor Transformation Starts This Quarter
iFactory deploys EBR, OEE, and operator enablement in a staged rollout that never stops your lines. First measurable ROI in 30 days. Full paper retirement by Day 90.
Day 30
First EBR lines live
Day 60
Real-time OEE active
Day 90
Full paper retirement
10–20×
Return on investment