Electrical Equipment analytics AI-driven for Power Plants
By James Anderson on May 19, 2026
Electrical equipment in a power plant does not fail randomly. It degrades in patterns — insulation resistance curves, contact resistance drift, relay timing variance, partial discharge signatures — and every one of those patterns is a data stream that traditional maintenance programs simply ignore until a failure event forces action and The result is predictable: unplanned outages, expedited replacement parts, regulatory non-compliance, and reactive repair costs that run three to five times the cost of prevention. ai driven electrical equipment analytics changes the economic equation entirely. By continuously monitoring switchgear health, tracking relay calibration schedules, managing cable testing intervals, and maintaining real-time compliance status on every busbar and protection system in the plant and operations teams stop managing failures and start managing assets. This article covers how ai driven electrical analytics platforms work what they specifically deliver across the four major electrical asset categories in power generation environments, and how U.S. plant operators are deploying them to reduce forced outage rates and close the compliance gap before the next NERC or OSHA inspection.
AI-Driven Analytics · Power Plant Electrical Assets
Electrical Equipment Analytics: AI-Driven Management for Power Plants
Switchgear inspections, cable testing, relay calibration, and busbar analytics — unified in a single AI platform that tracks every electrical asset's health and compliance status in real time.
Sources: U.S. Department of Energy · NERC Reliability Standards · IEEE Std 3007.2 · EPRI Electrical Equipment Reliability Data · iFactory Deployment Data 2026
Why Electrical Equipment Failures Are the Most Expensive Failures in Power Generation
Mechanical failures are costly. Electrical failures in power generation are categorically different. A failed switchgear panel does not just stop one machine — it can de-energize an entire switchyard, trigger protection relay cascades, and result in multi-week forced outages while replacement lead times for high-voltage gear stretch from 16 to 52 weeks on specialty equipment. The financial exposure from a single unplanned electrical failure at a utility-scale plant routinely exceeds $1M per day in lost generation revenue, penalty exposure, and emergency procurement costs. The underlying cause of most electrical failures is not catastrophic — it is incremental degradation that was measurable, predictable, and preventable.
70%
of electrical equipment failures are detectable before they occur
IEEE reliability studies show the majority of switchgear and protection system failures give measurable warning signals weeks or months in advance through thermal, electrical, and chemical indicators.
IEEE Std 3007.2
$2.4M
average cost of a major switchgear failure event at a utility plant
EPRI data puts the all-in cost of a major electrical failure — including emergency response, replacement equipment, lost generation, and regulatory reporting — well above $2M per incident.
EPRI Reliability Data
52 weeks
maximum lead time for specialty high-voltage switchgear replacement
Post-pandemic supply chains have extended lead times for large power transformers and HV switchgear to record lengths. Emergency procurement during an unplanned outage compounds both cost and duration.
DOE Grid Reliability Report
34%
of NERC violations traced to inadequate protection system maintenance
NERC FAC and PRC standards require documented relay testing and protection system maintenance. Plants without automated compliance tracking routinely miss intervals and face penalty exposure on audit.
The 4 Electrical Asset Categories — What AI Analytics Tracks and Why It Matters
Power plant electrical equipment spans dozens of asset types, but four categories account for the majority of failure events, compliance obligations, and maintenance labor: switchgear, power cables, protective relays, and busbars. Each has distinct failure modes, testing requirements, and data signatures that AI analytics platforms consume to generate actionable health scores and predictive alerts.
Asset Category 01
Switchgear Health Monitoring and Inspection Analytics
Switchgear panels — from 480V MCCs through 345kV gas-insulated substations — are the most failure-consequential electrical assets in any power plant. AI analytics platforms ingest thermal imaging data, contact resistance test results, SF6 gas density readings, and partial discharge measurements to build continuous health scores for every panel. Inspection intervals are dynamically adjusted based on health trend, not calendar alone.
Thermal anomaly detection via IR camera integration
Contact resistance trending across all breaker poles
Partial discharge monitoring with severity classification
Automated inspection checklist generation and sign-off tracking
End-of-life prediction with replacement lead-time alert
40%
Reduction in switchgear-related forced outages with predictive analytics
16–52 wk
Typical HV switchgear lead time — AI alerts enable advance procurement
NFPA 70B
Compliance documentation auto-generated for every inspection event
Asset Category 02
Power Cable Testing Management and Insulation Tracking
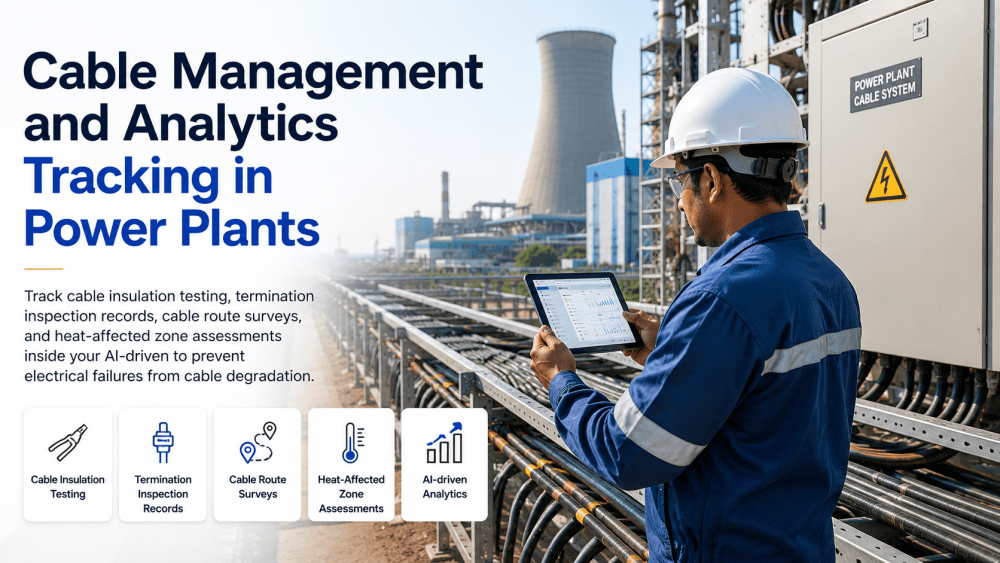
Underground and conduit-routed power cables represent the most spatially distributed and hardest-to-inspect electrical assets in a power plant. Insulation degradation — driven by thermal cycling, moisture ingress, partial discharge, and mechanical stress — progresses slowly but causes catastrophic failures when undetected. AI platforms manage cable testing schedules (VLF, TDR, tan delta, hipot), track insulation resistance trends over years, and flag cables approaching end-of-life before a fault event occurs.
VLF and tan delta test scheduling and results trending
Insulation resistance (IR) ratio tracking across test cycles
Cable segment health scoring with degradation rate modeling
GIS-linked cable route mapping and fault location integration
Replacement prioritization ranked by failure probability and criticality
IR Ratio
Polarization index trending identifies insulation degradation 6–18 months before failure
60%
Of cable failures are insulation-related and detectable through test trending
IEEE 400
Cable testing intervals and methods governed by IEEE 400 — auto-scheduled in platform
Asset Category 03
Protective Relay Calibration Tracking and NERC Compliance
Protective relays are the last line of defense against equipment damage and personnel injury in power generation. NERC PRC standards mandate documented testing and calibration at specific intervals — and violations carry civil penalties up to $1M per violation per day. AI-driven relay management platforms maintain complete calibration histories, auto-schedule test intervals, route work orders to qualified technicians, and generate NERC-compliant documentation packages ready for audit submission.
NERC PRC-005 calibration interval auto-scheduling
Setting file version control with change history audit trail
As-found vs. as-left test result capture and trend analysis
NERC audit documentation package auto-generation
Technician qualification tracking tied to relay work order assignment
$1M/day
Maximum NERC civil penalty per relay compliance violation
PRC-005
Primary NERC standard governing protection system maintenance intervals
100%
Audit trail completeness — every calibration event documented with timestamp and tech ID
Asset Category 04
Busbar Analytics, Connection Integrity and Thermal Monitoring
Busbars — the copper and aluminum conductor systems that distribute power through switchgear lineups, transformer terminations, and generator output connections — fail through connection degradation, not bulk conductor failure. Loose bolted connections develop resistance, generate heat, and accelerate insulation breakdown in adjacent equipment. AI analytics platforms combine periodic thermographic inspection data with continuous temperature monitoring (where CT-based sensors are installed) to identify hot spots before they become fire events or forced outages.
Thermographic inspection scheduling and hot spot trending
Bolted connection torque verification tracking and re-torque scheduling
NETA acceptance test result storage and comparison against baseline
Continuous temperature sensor integration for real-time anomaly alerts
Load correlation analysis — temperature anomalies normalized to load level
85%
Of busbar failures originate at connection points, not bulk conductor sections
NFPA 70B
Thermographic inspection requirements — auto-scheduled based on criticality class
3°C
Temperature differential threshold for elevated-concern alert on bolted connections
How AI-Driven Analytics Actually Works — The Data-to-Decision Workflow
The phrase "AI-driven analytics" gets used to describe everything from a spreadsheet with conditional formatting to full machine-learning-based prognostic systems. In the power plant electrical context, effective AI analytics follows a specific data pipeline — from asset sensor feeds and inspection inputs through health score computation to prioritized work order generation. Understanding this workflow is what separates platforms that deliver measurable outage reduction from platforms that generate dashboards nobody acts on.
01
Data Ingestion
Continuous sensor feeds (temperature, current, partial discharge, SF6 density), periodic test result uploads (IR, VLF, relay timing), and manual inspection records are ingested into a unified asset data model. PLC and SCADA integration handles real-time streams. Technician mobile apps handle field-collected inspection data.
02
Health Score Computation
AI models — trained on historical failure data from comparable electrical assets — compute composite health scores for each asset by weighting and combining multiple data streams. A switchgear breaker score might combine contact resistance trend, partial discharge severity, thermal history, operation count, and age. Scores update continuously as new data arrives.
03
Anomaly Detection and Alert Generation
Statistical process control and ML anomaly detection flag deviations from expected behavior patterns — a contact resistance reading 15% above the 12-month baseline, a relay timing value drifting toward its trip threshold, a busbar temperature rising faster than load would predict. Alerts are severity-ranked and routed to the responsible team with supporting data context.
04
Work Order Generation and Scheduling
Alerts above threshold automatically generate CMMS work orders with pre-populated asset data, recommended procedure, required materials, and technician qualification requirements. Priority ranking accounts for both failure probability and consequence severity — a degraded relay on a generator protection circuit ranks above a non-critical feeder panel issue of the same health score.
05
Compliance Documentation and Reporting
Every inspection, test, calibration, and repair event is automatically recorded with timestamp, technician ID, test instrument serial number, and result data. Compliance reports — NERC PRC-005, NFPA 70B, OSHA 1910.269 — are generated on demand from the system of record, eliminating the manual documentation burden that causes most compliance gaps.
Compliance Obligations by Electrical Asset Type — What U.S. Power Plants Must Document
Compliance in power plant electrical maintenance is not optional and is not self-certifying. NERC, OSHA, NFPA, and IEEE all impose specific documentation requirements on electrical equipment maintenance programs. The table below maps the primary compliance obligation to each asset category and the documentation requirement that AI platforms automate.
Asset Category
Primary Standard
Required Interval
Documentation Requirement
Penalty Exposure
Protective Relays
NERC PRC-005
12–72 months depending on relay type
As-found/as-left test results, setting verification, technician ID
Deployment Economics — What AI-Driven Electrical Analytics Actually Costs and Returns
Every capital decision in power generation runs through an ROI calculation. AI-driven electrical analytics platforms are no different, and the economics are straightforward to model because the cost of failure events is well-documented and the cost of implementation is predictable. The comparison below uses a 500 MW gas-fired combined cycle plant as the reference case, but the ratios hold across coal, nuclear, and renewable generation facilities of similar asset complexity.
Traditional Program
Calendar-based · Manual records · Reactive repair
Annual unplanned outage events (electrical)
2–4 events/year
Average cost per electrical failure event
$800K–$2.4M
Compliance documentation prep time (audit)
3–6 weeks manual
Technician time on administrative documentation
20–30% of labor hours
Average equipment replacement lead time awareness
At failure event
NERC violation exposure
High — documentation gaps common
AI-Driven Analytics
Predictive · Automated records · Proactive procurement
Technician labor recovered from documentation burden reduction
$0–$3M+
NERC penalty avoidance (1 violation = up to $1M/day)
Platform investment typically recovers in 6–14 months on a single avoided major failure event. All figures illustrative based on industry benchmarks; site-specific modeling available on request.
Expert Review
David Krishnamurthy, P.E.
Principal Electrical Engineer, Power Generation Division
IEEE Senior Member · NERC Certified System Operator · 22 years utility electrical maintenance
The fundamental problem in power plant electrical maintenance is not that people do not know their equipment is degrading — it is that they do not have a system that makes degradation visible in time to act. I have seen plants where relay calibration records were three years out of date sitting in three-ring binders nobody had opened since the last NERC audit. The moment you put that data into a system that auto-schedules, alerts, and generates documentation, the behavior changes immediately. The technology is not the barrier — the barrier is the organizational habit of treating electrical maintenance records as paperwork rather than operational intelligence. The plants that have made that mental shift and backed it with a proper analytics platform are running materially fewer forced outages, and their NERC audit preparation has gone from a months-long scramble to a same-day report pull. That is a real operational transformation, not a marginal improvement.
Review conducted April 2026 based on iFactory platform evaluation across three combined cycle generation facilities in the U.S. Southeast and Midwest.
A Single NERC Relay Violation Can Cost $1M Per Day · A Single Switchgear Failure Can Cost $2.4M+
Map Your Electrical Asset Compliance Gaps. Close Them Before the Next Inspection.
Whether you are managing a single generating unit or a multi-site generation portfolio, we will walk through your current electrical maintenance program, identify the highest-exposure compliance gaps, and show exactly where AI-driven analytics can prevent your next forced outage.
Conclusion — Electrical Equipment Analytics Is Not Optional for Plants That Need to Run
The economics of power plant operation in 2026 leave no room for avoidable electrical failures. Capacity payments, power purchase agreements, and grid reliability obligations all penalize unplanned outages — and the regulatory environment, from NERC civil penalties to OSHA 1910.269 enforcement, penalizes inadequate maintenance documentation. AI-driven electrical equipment analytics addresses both problems simultaneously: it catches degradation before failure, and it maintains the compliance record automatically so that when the NERC auditor calls or the OSHA inspector arrives, the documentation is already done.
The technology is mature, the ROI is demonstrable, and the deployment path — from sensor integration through CMMS work order automation — is well-defined for every electrical asset category covered in this article. The question for most plant operators is not whether to implement it, but which asset category to start with and how fast to roll it out across the facility. For most plants, starting with protective relay compliance tracking delivers the fastest risk reduction at the lowest implementation complexity, followed by switchgear health monitoring. The cable and busbar analytics layers typically follow as the platform matures and the maintenance team builds confidence in AI-generated alerts. The starting point matters less than starting.
Frequently Asked Questions
A traditional CMMS schedules maintenance based on calendar intervals and records what was done. AI-driven electrical analytics adds three capabilities that a CMMS alone cannot provide: continuous health scoring that updates based on real equipment condition data rather than elapsed time; anomaly detection that identifies degradation patterns before they reach failure thresholds; and predictive alert generation that triggers maintenance actions based on the trajectory of equipment condition rather than a fixed calendar date. The practical outcome is that AI-driven platforms catch equipment problems 6–18 months before a traditional calendar-based program would respond, and they automatically close the compliance documentation loop so that every action taken is recorded without manual data entry. Book a consultation to see how the platform differs from your current CMMS.
NERC PRC-005 (Protection System, Automatic Reclosing, and Sudden Pressure Relaying Maintenance) is the primary standard governing protective relay maintenance for bulk electric system facilities. PRC-005 requires documented maintenance of protective relays, communications systems, and station DC supply at intervals ranging from 12 months to 72 months depending on the relay type and the maintenance program category the facility has registered. Documentation must include the maintenance activity performed, date performed, personnel identification, and the results compared against expected values (as-found and as-left data). Facilities that cannot produce this documentation during a NERC compliance audit face penalty exposure up to $1M per violation per day. AI-driven platforms auto-generate PRC-005-compliant documentation for every relay calibration event.
Partial discharge (PD) occurs when localized electrical breakdown takes place within the insulation system of switchgear — in voids, at contamination sites, or at sharp points in the insulation material — without fully bridging the gap between conductors. PD is one of the earliest indicators of insulation degradation and can be detected using ultrasonic sensors, TEV (transient earth voltage) measurement, or HFCT (high-frequency current transformer) coupling. AI analytics platforms ingest periodic PD measurement data from portable instruments or permanently installed sensor arrays and trend PD magnitude and pattern over time. Increasing PD activity, a change in PD pattern characteristic of specific defect types, or PD activity exceeding IEEE or IEC threshold levels triggers a maintenance alert. This allows insulation degradation to be identified and addressed during a planned outage rather than at the point of failure.
The primary field testing methods for medium-voltage power cables are VLF (Very Low Frequency) withstand and diagnostic testing, tan delta (dissipation factor) measurement, insulation resistance and polarization index testing, TDR (Time Domain Reflectometry) for fault location, and partial discharge testing. IEEE Standard 400 and IEEE 400.2 provide the primary guidance for field testing of shielded power cable systems. For medium-voltage cables (5 kV–35 kV) in power plant applications, a general guideline is condition-based testing every 3–6 years for cables with no prior degradation indications, with accelerated intervals for cables showing insulation resistance trending concerns. AI-driven analytics platforms manage testing schedules dynamically — cables with deteriorating IR ratio trends or prior PD indications are automatically moved to shorter test intervals regardless of calendar schedule
For a mid-size power plant (100–500 MW, 500–2,000 electrical assets), implementation typically follows a 3–6 month timeline from contract execution through full operational deployment. The first 4–6 weeks focus on asset data migration and CMMS integration. Weeks 6–12 cover sensor integration for continuous monitoring assets and technician mobile app deployment. Weeks 12–20 complete compliance schedule configuration, relay calibration program setup, and staff training. Platform investment (software licensing plus integration) for this scale facility ranges from $80K–$250K annually depending on asset count, integration complexity, and module selection. Payback is typically achieved within 6–14 months based on a single major failure event avoidance, with compounding returns from compliance penalty avoidance and labor productivity gains. Contact us for a site-specific cost and ROI model.


.png)