Deploying IoT vibration sensors, temperature probes, and current transducers on industrial machinery is the foundation of any predictive maintenance programme — but sensor installation quality directly determines data reliability. A poorly mounted sensor on a CNC spindle or pump bearing can miss early-stage bearing defects, produce false alarms from resonance or rattling, or drift out of calibration within weeks. This checklist covers surface preparation, mounting method selection (adhesive vs magnetic vs stud mount), sensor orientation, communication verification, and baseline data capture, following ISO 5348 and ISO 20816-3 guidelines. Book a Demo to see how iFactory ingests sensor telemetry and converts it into spindle bearing failure predictions, tool wear alerts, and axis drift forecasts — all flowing into the Shift Logbook and CMMS.
Predictive Maintenance · Sensor Deployment 2026
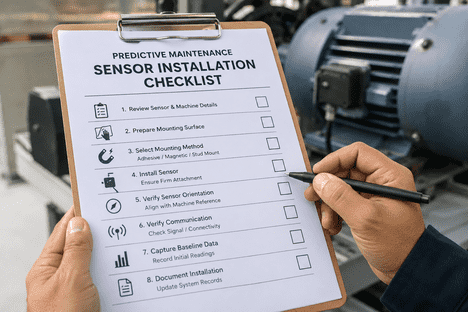
Predictive Maintenance Sensor Installation Checklist
Surface preparation · Mounting method selection · Orientation per ISO 20816-3 · Communication & baseline verification · All integrated with iFactory's AI predictive maintenance platform, Shift Logbook, and CMMS.
◉
Stud Mount
Best coupling · >6 kHz response · Permanent installation
▤
Adhesive Mount
No drilling needed · 2.5–8 kHz · Thin bond line critical
◈
Magnetic Mount
Portable · 1–2 kHz · Route-based collection
⟐
Baseline Capture
1–2 week window · Full FFT spectra · Load-state mapping
1. Surface Preparation
Surface condition is the single largest determinant of sensor data quality. Paint, rust, grease, and uneven surfaces act as mechanical low-pass filters — a painted surface can attenuate high-frequency bearing signals by 50–80%. Follow these steps for every permanent installation.
SURFACE PREPARATION WORKFLOW
1
Spot-face the mounting area — mill a flat surface roughly 1.1× the sensor base diameter, flat within 0.001" (1 mil), surface finish ≤32 μin (0.8 μm) per ISO 5348
2
Remove all coatings — strip paint, rust, grease, and debris down to bare metal using a solvent-safe abrasive pad or wire brush
3
Degrease with residue-free solvent — isopropyl alcohol (≥99%) applied with lint-free wipe; wear clean gloves to prevent oil recontamination
4
Apply coupling fluid — thin layer of silicone grease or machine oil fills microscopic air gaps between mating surfaces, improving high-frequency transmission
5
Torque to manufacturer spec — typically 2–8 Nm depending on sensor size; under-torquing reduces coupling stiffness, over-torquing risks thread damage
6
Paint exposed metal — after installation, apply corrosion-resistant paint to all exposed bare metal surfaces around the mount
2. Mounting Method Comparison
Each mounting method offers a different trade-off between mechanical bandwidth, installation permanence, and cost. Select based on your machine type, operating speed range, and monitoring objective — stud mount for permanent spindle monitoring, adhesive for surfaces that cannot be drilled, magnetic for temporary route-based data collection.
Frequency Range
>6 kHz (up to 20–30 kHz)
2.5–8 kHz (thin cyanoacrylate)
~1–2 kHz dry; 5–7 kHz with grease
Installation
Drill + tap; permanent modification
Clean + apply; no drilling
Place and go; fully portable
Removability
Difficult; machine surface modified
Moderate; adhesive residue must be cleaned
Instant; no residue or modification
Best For
Permanent critical asset monitoring
Surfaces that cannot be drilled
Route-based / temporary surveys
ISO Compliance
ISO 5348 preferred method
ISO 5348 acceptable with thin bond
ISO 20816-3 limited use
3. Sensor Orientation Per ISO 20816-3
Orientation consistency determines trend reliability. Inconsistent sensor alignment from one measurement to the next destroys the comparability of vibration magnitude and phase data. Follow ISO 20816-3 guidelines for bearing housing measurements.
01
Radial Measurements — Vertical & Horizontal
Mount the sensor perpendicular to the shaft axis in the bearing load zone — the region where force transmits through the bearing into the housing. This captures the strongest signal for imbalance, misalignment, and bearing element defects. Take two radial measurements per bearing: one vertical (usually at 12 o'clock on horizontal machines) and one horizontal (3 o'clock or 9 o'clock in the load zone). Per ISO 20816-3, record vibration velocity in mm/s RMS over 10–1,000 Hz for broadband assessment and FFT spectra for bearing fault frequency analysis.
Perpendicular to shaftBearing load zoneTwo radial per bearing
02
Axial Measurements — Thrust Direction
Mount the sensor parallel to the shaft axis to capture thrust-related vibration from misalignment, bent shafts, thrust bearing wear, and coupling issues. One axial measurement per shaft end is sufficient. Mark the sensor orientation on the mounting stud or housing with a permanent marker — inconsistently aligned axial readings cannot be trended reliably. For variable-speed machines, document the operating RPM during baseline capture alongside each axial measurement position.
Parallel to shaft axisThrust fault detectionMark orientation
03
Tri-Axial Sensor Alignment
When using tri-axial accelerometers, align the X-axis consistently across all machines — typically oriented with the drive shaft direction or toward the machine's primary axis. Document the axis mapping in the Shift Logbook or asset register so that any technician can verify or reproduce the setup. Apply a small dab of thread-locking compound (Loctite 222) to prevent the sensor from loosening under machine vibration.
Book a Demo to learn how iFactory's Shift Logbook tracks sensor orientation metadata and correlates it with prediction alerts.
Consistent X-axis referenceShift Logbook documentationLoctite 222
4. Communication Verification
After mounting, verify that the sensor is sending valid data before leaving the installation site. A sensor that appears physically installed but is not communicating reliably is worse than no sensor — it creates a false sense of monitoring coverage.
Confirm the sensor joins the wireless network and transmits data frames. Check RSSI — target ≥ −90 dBm for reliable operation. Test range by moving the sensor closer to the gateway if needed. Verify that ACK (acknowledgement) packets are received for each transmission. For battery-powered sensors, confirm the battery level and heartbeat signal are visible in the gateway dashboard. Log the sensor MAC address, installation date, and RSSI reading in the asset register.
RSSI Target≥ −90 dBm
HeartbeatConfirm alive signal
Talk to an Expert
Measure the bias output voltage (BOV) of IEPE accelerometers using a multimeter or data acquisition system — a BOV within the manufacturer's specified range (typically 8–12 VDC) confirms the sensor and cable are functioning. BOV outside this range indicates a damaged cable, failed sensor, or incorrect excitation current. Secure all cables with strain-relief clamps to prevent triboelectric noise from cable whip. Never route sensor cables parallel to high-voltage power cables — electromagnetic interference will contaminate the vibration signal.
BOV Range8–12 VDC typical
Cable MgmtStrain relief + separation
Talk to an Expert
Use a portable vibration reference source or perform a bump test — strike the machine near the sensor location with a rubber mallet — and verify that the measured vibration signal matches the expected amplitude and frequency response within ±10%. For permanent installations, schedule a full shaker verification within the first week using a calibrated shaker table that sweeps from 10 Hz to 10 kHz. Log the verification results in iFactory's Shift Logbook for full audit traceability and model training context.
Bump Test±10% signal match
Shaker Sweep10 Hz – 10 kHz
Talk to an Expert
5. Baseline Data Capture
The baseline vibration signature is the "healthy fingerprint" against which all future monitoring data is compared. A poorly captured baseline — taken under the wrong load, speed, or temperature — invalidates every subsequent trend analysis. Book a Demo to see how iFactory's ML models use your baseline data to train machine-specific failure prediction models for CNC spindles, machine tools, ball screws, and servo drives.
BASELINE CAPTURE PROCEDURE — ISO 13373-1
1
Run at normal stable load — capture data under standard operating conditions after any wear-in period (hours to days for new or overhauled equipment)
2
Collect 1–2 weeks of data — cover a full operating cycle including start-up, steady-state, cool-down, and any load or speed variations
3
Capture full frequency range — record broadband overall values plus FFT spectra across all measurement axes at defined resolution (400–3200 lines)
4
Document asset + operating context — machine type, bearing details, operating speed, load condition, coolant state, and data collection timestamp
5
Rebaseline after major maintenance — schedule a new baseline after any bearing replacement, shaft alignment, spindle rebuild, or axis drive overhaul
6
Store in Shift Logbook — iFactory records every baseline alongside sensor metadata, installation photos, and technician notes for full traceability
Common Sensor Installation Mistakes
50-80%
High-frequency signal loss from painted mounting surfaces
Paint acts as mechanical low-pass filter
#1
Most common mistake: poor surface preparation
Rust, grease, uneven spots degrade data quality
#2
Wrong mount method for application
Magnetic on permanent spindle monitoring
#3
Mounting on non-rigid surfaces
Guards, fins, covers introduce resonances
FAQ
Deploy iFactory for Your Predictive Maintenance Sensor Installation
Complete sensor installation checklist covering surface preparation, mounting method selection (stud, adhesive, magnetic), orientation per ISO 20816-3, communication verification, and baseline data capture — integrated with iFactory's AI predictive maintenance platform. Connect your spindle vibration sensors, bearing RTDs, motor current transducers, and servo drive telemetry into one unified intelligence layer with ML-based failure prediction, Shift Logbook traceability, CMMS workflow automation, and plant-wide reliability analytics.
Surface Preparation
Stud Mount
Adhesive Mount
Magnetic Mount
Baseline Capture