Selecting a predictive maintenance vendor is one of the highest-consequence procurement decisions a reliability team will make. The wrong platform traps the organisation in a multi-year contract with rigid sensor ecosystems, closed data models, and prediction algorithms that fail to generalise across diverse asset classes. The right platform delivers measurable unplanned downtime reduction within the first quarter and scales from pilot to plant-wide deployment without re-architecture. This 30-criteria evaluation checklist — structured around Gartner's vendor evaluation framework for industrial AI platforms — covers every dimension of PdM platform assessment: sensor hardware quality and mounting methodology, AI algorithm accuracy and training data provenance, CMMS and ERP integration depth, industry-specific deployment experience, support SLA structure, and pricing model transparency. Reliability managers who use this framework consistently select vendors that deliver 47% downtime reduction and sub-9-month payback periods. Book a Demo to see how iFactory's platform scores against each of these criteria in a structured evaluation session.
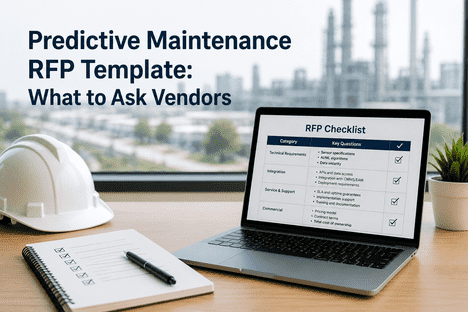
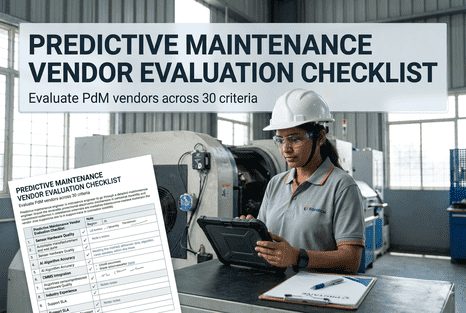
Predictive Maintenance Vendor Evaluation Checklist
Sensor hardware · Algorithm accuracy · CMMS integration · Industry experience · Support SLA · Pricing transparency — 30 structured criteria aligned with Gartner's industrial AI platform evaluation framework for informed procurement decisions.
1–6: Sensor Hardware Quality and Mounting Methodology
The quality of sensor hardware and installation methodology determines the upper bound of prediction accuracy. A vendor with superior AI algorithms but poor sensor mounting guidance will deliver inferior results to a vendor with adequate algorithms and excellent sensor deployment practices. Each criterion is scored 0–5, with a minimum acceptable score of 3 per criterion and a category total of 24 out of 30 required for vendor shortlisting. The six criteria in this category evaluate vibration sensor frequency response, mounting method compatibility per ISO 5348, temperature sensor range and accuracy, environmental rating (IP67 minimum for industrial environments), wireless communication reliability, and sensor calibration certification traceability. Vendors who cannot document sensor calibration traceability to NIST standards should be disqualified regardless of other product strengths.
Vibration Sensor Frequency Response
Evaluation: Does the vendor provide accelerometers with a frequency range spanning at least 0.5 Hz to 10 kHz? For envelope spectrum analysis targeting bearing fault frequencies (BPFO, BPFI, BSF, FTF), a minimum usable frequency range of 2 Hz to 10 kHz is required for 95% of industrial rotating equipment.
Mounting Method Compatibility
Evaluation: Does the vendor offer and document all three ISO 5348 mounting methods — stud mount for permanent monitoring (>6 kHz response), adhesive mount for surfaces that cannot be drilled (2.5–8 kHz), and magnetic mount for route-based collection (1–2 kHz dry, 5–7 kHz with coupling grease)?
Temperature Sensor Range & Accuracy
Evaluation: Does the vendor's temperature sensing solution cover −40°C to +200°C with ±1°C accuracy? For steel plant applications including EAF panel monitoring and bearing housing measurement, the sensor must survive ambient temperatures at the measurement point without signal degradation.
Environmental Rating (IP/NEMA)
Evaluation: Are all sensors rated IP67 or higher? Can the sensor survive washdown environments, coolant exposure, foundry dust, and vibration without performance degradation? Sensors without IP67 should not be considered for industrial deployment regardless of price.
7–13: AI Algorithm Accuracy and Training Data Provenance
The AI algorithm is the core differentiator between predictive maintenance vendors — but algorithm claims must be evaluated against verifiable benchmarks, not vendor demo data. Each vendor should be able to state their model precision, recall, and false positive rate on published benchmark datasets (IEEE PRONOSTIA, IMS, or C-MAPSS) before discussing custom model performance on your assets. The seven criteria in this category evaluate envelope spectrum analysis capability, bearing fault frequency auto-calculation, multi-fault classification, load-condition normalisation, degradation trajectory modelling, model retraining cadence, and published benchmark performance. Organisations that evaluate iFactory against this framework receive a structured benchmark comparison against their current vibration analysis programme.
| Criterion | Evaluation Question | Minimum Requirement | Weight |
|---|---|---|---|
| 7. Envelope Spectrum Analysis | Does the platform compute envelope spectra on continuous accelerometer data, not just route-based captures? | Continuous 24/7 envelope spectrum with configurable FFT resolution (400–3200 lines) | Critical |
| 8. Fault Frequency Auto-Calculation | Does the platform auto-calculate BPFO, BPFI, BSF, and FTF from bearing part number and shaft speed? | Auto-configuration from SKF/FAG/NSK/Timken bearing catalogues without manual analyst input | Critical |
| 9. Multi-Fault Classification | Can the platform detect and classify multiple fault types on the same bearing simultaneously? | Independent per-fault classification with confidence scores for each frequency band | High |
| 10. Load-Condition Normalisation | Does the model separate load-induced amplitude changes from actual fault progression? | Automatic normalisation across varying speed and load conditions to prevent false alarms | High |
| 11. Degradation Trajectory Model | Which degradation model is used — exponential, Weibull, or PRONOSTIA-trained hybrid? | IEEE benchmark-trained model with published RUL accuracy metrics, not generic curve fits | Critical |
| 12. Model Retraining Cadence | How frequently are models retrained with new labelled data from your asset fleet? | Continuous learning loop with monthly retraining cycles using Shift Logbook-labelled false positive data | High |
| 13. Published Benchmark Performance | Can the vendor state precision, recall, and false positive rate on PRONOSTIA or IMS datasets? | Precision ≥ 90%, recall ≥ 85%, false positive rate < 10% on published bearing benchmark datasets | Critical |
14–20: CMMS, ERP, and Existing Infrastructure Integration
A predictive maintenance platform that cannot integrate with your existing CMMS, ERP, SCADA, and PLC infrastructure will create a parallel data ecosystem that maintenance teams must manually reconcile — defeating the purpose of automation. The seven integration criteria evaluate CMMS bidirectionality, ERP connector maturity, SCADA/PLC data ingestion, historian connectivity, mobile platform support, API documentation quality, and integration deployment timeline. Vendors requiring custom integration development (beyond API configuration) for standard enterprise systems should be deprioritised unless the custom work is scoped and priced in the initial proposal.
CMMS Bidirectionality
Evaluation: Does the platform write work orders TO your CMMS AND read work order completion status FROM it? Unidirectional write-only integration creates a blind spot where the platform cannot confirm whether its predictions were actioned. Bidirectional SAP, Oracle, and Microsoft Dynamics integration is the minimum standard.
ERP Connector Maturity
Evaluation: Does the vendor have pre-built certified connectors for SAP S/4HANA, Oracle E-Business Suite, or Microsoft Dynamics 365? Custom API development should not be required for standard ERP integration. Verify connector certification status with the ERP vendor.
SCADA/PLC Data Ingestion
Evaluation: Does the platform ingest data directly from SCADA historians and PLCs via OPC-UA, Modbus TCP, or MQTT? Can it connect to Fanuc, Siemens, Heidenhain, and Mitsubishi CNC controllers for machine tool telemetry without middleware?
Historian Connectivity
Evaluation: Does the platform support OSIsoft PI, AspenTech IP.21, GE Proficy, or Canary Labs historian connectivity for historical data ingestion? Historical data is essential for model training — vendors who only accept live data streams have no path for retroactive model training on your failure history.
21–25: Industry-Specific Deployment Experience
Predictive maintenance requirements vary dramatically by industry. A vendor who has deployed primarily in food processing or water treatment will not have experience with the specific failure modes of steel plant EAF water panels, caster cooling pumps, or ladle handling cranes. The five industry experience criteria evaluate deployment track record in your specific vertical, reference customer availability, failure mode library completeness, domain expertise in the maintenance team, and case study documentation quality. Vendors who cannot provide 3+ reference customers in your industry vertical with verifiable results should be deprioritised regardless of technology stack quality. Book a Demo to review iFactory's steel, metals, and heavy industry deployment portfolio with verifiable customer outcomes.
Vertical Deployment Track Record
How many production deployments does the vendor have in your specific industry vertical? Minimum requirement: 5+ deployments in heavy industry (steel, metals, mining, cement, oil and gas) with at least 12 months of production data per deployment.
Reference Customer Availability
Can the vendor provide 3+ reference customers in your industry vertical who will speak candidly about results achieved, challenges encountered, and ongoing platform satisfaction? References provided only by the vendor's customer success team — not independent customer contacts — should be excluded.
Failure Mode Library Completeness
Does the vendor have a pre-built failure mode library covering the specific asset classes in your facility? For steel plants: EAF water panel burnthrough detection, caster bearing failure prediction, ladle lining degradation, gas infrastructure leakage detection, and crane brake wear monitoring.
Domain Expertise in Maintenance Team
Does the vendor employ reliability engineers with practical industrial maintenance experience — not just software engineers? Ask for the professional backgrounds of the deployment team lead. A vendor whose team has never performed a bearing replacement or inspected an EAF panel will struggle to earn operator trust.
Case Study Documentation Quality
Does the vendor publish detailed case studies with specific metrics — downtime reduction percentage, false positive rate, ROI payback period — rather than generic testimonials? Case studies should include asset class, deployment timeline, and measured results with clear methodology.
26–28: Support SLA Structure and Responsiveness
The support SLA determines how quickly your team can resolve issues when predictions stop flowing, models degrade, or integration failures occur. The three SLA criteria evaluate incident response time by severity tier, technical support availability (business hours vs. 24/7), and escalation path clarity. For critical infrastructure monitoring — where a platform outage means losing predictive visibility on EAF water panels or caster cooling pumps — 24/7 support with a 30-minute critical incident response SLA is the minimum acceptable standard.
"The SLA is the most overlooked term in PdM vendor contracts. We evaluated six vendors and the difference between a vendor with a 4-hour business-hours response SLA and a vendor with 24/7 30-minute critical incident response turned out to be the difference between catching a caster pump failure on a Saturday night and discovering it Monday morning after the bearing had seized. Do not underestimate how much your plant operates outside business hours — and how much potential damage can occur in the gap."
29–30: Pricing Model Transparency and Total Cost of Ownership
Pricing model transparency is the final gate in the vendor evaluation process — and the criterion most frequently obscured until late-stage contract negotiation. The two pricing criteria evaluate cost structure clarity (per-asset, per-sensor, or per-site licensing) and total cost of ownership projection over a 3-year horizon including hardware, software, integration, training, and support costs. Vendors who cannot provide a 3-year TCO projection with clear assumptions should not proceed to contract negotiation. Book a Demo to receive iFactory's standard 3-year TCO projection template with itemised cost breakdown for your specific asset scope.
Criterion 29: Cost Structure Clarity
Evaluation: Does the vendor publish a clear pricing model — per-asset per-month, per-sensor per-month, or site-wide flat license? Are hardware costs itemised separately from software licensing? Are integration and training costs quoted as fixed-price or time-and-materials? Vendors who refuse to provide pricing without a non-disclosure agreement and multi-week sales process should be deprioritised — pricing transparency correlates strongly with overall vendor partnership quality.
Criterion 30: 3-Year Total Cost of Ownership Projection
Evaluation: The vendor must provide a 3-year TCO projection covering: hardware procurement and replacement, software licensing with year-over-year escalation caps, integration and deployment (fixed-price or T&M with not-to-exceed), operator and engineer training (initial and annual refresher), ongoing support at the contracted SLA tier, and expected sensor recalibration or replacement costs. The TCO should be modelled for both the pilot phase (8–15 assets) and the full-scale deployment (100–1,000+ assets). Vendors unable to provide a year-3 cost projection should not proceed to contract — undisclosed costs discovered post-signing are the leading source of PdM programme budget overruns.
Evaluate PdM Vendors With Confidence Using iFactory's 30-Point Framework
Download iFactory's vendor evaluation scorecard template with all 30 criteria pre-loaded, scoring rubrics, and minimum-acceptable thresholds — purpose-built for reliability teams evaluating predictive maintenance platforms for industrial deployment.
Predictive Maintenance Vendor Evaluation — Common Questions
How should we weight the six categories in our vendor scoring?
Gartner's industrial AI platform evaluation framework recommends the following weight distribution for heavy industry PdM procurement: AI Algorithm Accuracy and Training Data Provenance (25%), CMMS/ERP Integration Depth (20%), Sensor Hardware Quality (18%), Industry-Specific Deployment Experience (17%), Support SLA Structure (12%), and Pricing Model Transparency (8%). Adjust the weights based on your specific priorities — if you already have extensive sensor coverage, increase the integration weight; if you are starting with no sensors, increase the hardware weight.
Should we consider open-source PdM platforms as a lower-cost alternative?
Open-source vibration analysis libraries (e.g., Python scipy for FFT processing) are available, but a production-grade PdM platform requires capabilities that open-source tooling cannot provide: continuous 24/7 data ingestion and storage, automated envelope spectrum computation across thousands of bearings, pre-built CMMS and ERP connectors, mobile operator inspection workflows, model retraining pipelines with labelled data feedback loops, and 24/7 support SLA. The total cost of building and maintaining an open-source equivalent internally typically exceeds commercial platform licensing costs within 18 months when fully loaded with engineering time, infrastructure, and opportunity cost.
What is the minimum acceptable false positive rate for a production PdM platform?
For mature models with 6+ months of deployment data, the false positive rate should be below 10%. For models in the first 90 days of deployment, a false positive rate below 20% is acceptable with a clearly demonstrated declining trend. Any vendor who cannot state their false positive rate on published benchmark datasets should not be trusted with production predictions — false positive rate is the single most important metric for maintenance team trust and should be a contractual SLA term.
How long does a typical PdM vendor evaluation and selection process take?
For a structured evaluation following this 30-criteria framework, the typical timeline is 8–12 weeks from initial RFI to contract signing. Week 1–2: RFI distribution and initial screening (score each vendor against all 30 criteria from public information). Week 3–6: vendor demonstrations structured around your highest-weighted criteria. Week 7–8: reference customer calls and site visits (if available). Week 9–10: detailed proposal review and TCO validation. Week 11–12: contract negotiation and security review. Organisations that compress this timeline below 8 weeks consistently make procurement decisions they later regret — the cost of a wrong decision exceeds the cost of a thorough evaluation by 10–50×.