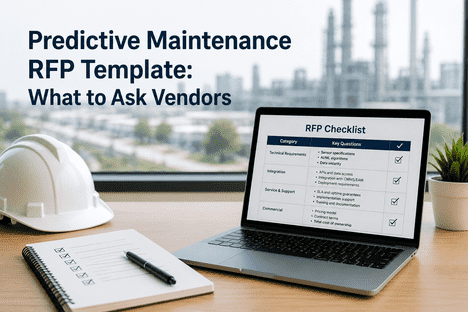
Selecting a predictive maintenance platform is among the highest-consequence procurement decisions a reliability engineering team makes in a given capital cycle. The wrong choice strands the organization with a platform that generates false positives, fails to integrate with existing CMMS and ERP systems, requires dedicated data science staff to operate, or cannot scale beyond the pilot phase. The right choice delivers 40–70% unplanned downtime reduction within the first year, measurable ROI within 6–9 months, and a reliability data infrastructure that compounds in value as the asset condition database grows. The difference between these outcomes is determined before the contract is signed — in the structure of the RFP, the specificity of the evaluation criteria, and the rigor of the vendor scoring process. This RFP template and vendor evaluation framework — structured around Gartner's industrial AI platform assessment methodology — covers the six categories, 30 evaluation criteria, weighted scoring system, and commercial negotiation checklist that reliability leaders need to run a defensible, outcome-driven PdM procurement. iFactory AI's industrial software platform, including its Shift Logbook and predictive maintenance engine, is evaluated against each of these criteria in structured comparison sessions. Book a Demo to see how iFactory scores against this framework in a head-to-head vendor evaluation.
Why a Structured RFP Process Separates Successful PdM Deployments from Pilot Purgatory
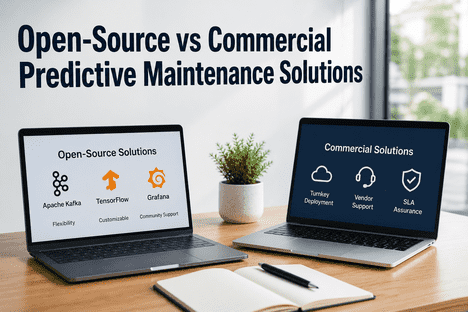
The predictive maintenance technology market in 2026 contains over 200 vendors spanning hardware-only sensor providers, AI-analytics software layers, full-stack platforms with integrated CMMS, and consulting-led managed service offerings. Without a structured evaluation framework, procurement teams default to one of three suboptimal outcomes: selecting the vendor with the best demo (typically the most expensive full-stack option with proprietary hardware lock-in), selecting the cheapest option (typically a sensor-only provider whose "AI" layer is a configurable threshold alarm), or deferring the decision indefinitely (pilot purgatory — the most common outcome, accounting for an estimated 40% of PdM procurement starts that never reach production deployment).
A structured RFP process prevents all three outcomes by forcing specificity into every evaluation dimension before vendor demos begin. The six-category framework below is designed for manufacturing reliability leaders evaluating PdM platforms for brownfield industrial environments — facilities with existing sensor coverage, mixed-vintage equipment fleets, established CMMS and ERP systems, and maintenance teams with varying levels of data analytics maturity. Each category includes 5–10 specific evaluation questions, a scoring methodology, and pass-fail criteria that prevent vendors with fundamental gaps in core capabilities from advancing to the demo phase.
Category 1: Sensor Hardware Quality and Mounting Methodology (Weight: 18%)
The quality of sensor hardware and installation methodology determines the upper bound of prediction accuracy. A vendor with superior AI algorithms but poor sensor mounting guidance will deliver inferior results to a vendor with adequate algorithms and excellent sensor deployment practices. Each criterion is scored 0–5, with a minimum acceptable score of 3 per criterion and a category total of 24 out of 30 required for vendor shortlisting.
- Does the vendor provide accelerometers spanning 0.5 Hz to 10 kHz minimum?
- For envelope spectrum analysis targeting bearing fault frequencies (BPFO/BPFI/BSF/FTF), is the usable range 2 Hz to 10 kHz?
- Is the frequency response documented with calibration certificates traceable to NIST standards?
- Does the vendor provide mounting guidance compliant with ISO 5348 for each sensor type?
- Are threaded stud, adhesive base, and magnetic mount options documented with frequency response impact?
- Does the vendor supply mounting kits with each sensor, or is mounting hardware third-party?
- Do all sensors meet IP67 minimum for industrial environments with documented test results?
- For wireless sensors: what is the guaranteed transmission range, battery life (minimum 3 years at 15-minute intervals), and data loss rate under normal operating conditions?
- Is wireless mesh or star topology documented with proven performance in steel / cement / chemical plant environments?
- Are all sensors supplied with calibration certificates traceable to NIST or equivalent national standards?
- What is the recommended recalibration interval, and does the vendor offer calibration services?
- Does the vendor document sensor drift characteristics and provide drift compensation in the data ingestion layer?
Category 2: AI Algorithm Accuracy and Training Data Provenance (Weight: 25%)
This is the highest-weighted category for a reason: algorithm accuracy and training data quality are the only vendor capabilities that cannot be improved through integration consulting or configuration effort after deployment. A vendor whose AI models were trained on laboratory data from pristine bearing test rigs will fail to generalize to your plant's mixed-vintage equipment fleet operating under variable load conditions. Vendors who cannot document training data provenance — source, volume, failure mode coverage, and validation methodology — should be disqualified regardless of demo quality.
- What is the source, volume, and failure mode coverage of the training data for each model type (bearing, imbalance, misalignment, looseness)?
- Does training data include IEEE benchmark datasets (PRONOSTIA, IMS, C-MAPSS) in addition to vendor-collected field data?
- How many actual failure events are represented in the training data per failure mode — not simulated, but documented real-world failures?
- What is the documented classification accuracy per fault type (bearing inner race, outer race, rolling element, cage, imbalance, misalignment, looseness)?
- What is the false positive rate per asset per month — not per model, but per monitored bearing or machine?
- Is accuracy reported as standalone metrics or against a defined baseline (industry standard, previous vendor, manual analysis by certified analysts)?
- Does the platform estimate remaining useful life, and is the methodology documented (exponential degradation model, Weibull, PRONOSTIA-trained hybrid)?
- What is the documented RUL estimation accuracy margin — ±20%, ±50%, or order-of-magnitude?
- Does RUL estimation update continuously as new data arrives, or is it computed at discrete intervals?
- Does the platform detect model drift automatically, or does it require manual monitoring of prediction confidence distributions?
- How are models retrained — triggered by accuracy degradation, on a fixed schedule, or only during vendor releases?
- Does the platform incorporate operator-confirmed findings (work order outcomes) as labeled training data for continuous improvement?
Category 3: CMMS and ERP Integration Depth (Weight: 20%)
The highest predictor of PdM program success is not algorithm accuracy — it is integration depth with existing maintenance workflows. A platform that generates perfect predictions that never reach the CMMS work order queue delivers zero value. A platform with adequate predictions that automatically generates prioritized, actionable work orders in the maintenance team's existing system delivers measurable downtime reduction from day one. Evaluation must distinguish between API-accessible integration (the platform has an API; you build the connector) and pre-built certified integration (the connector exists, is maintained, and includes bidirectional data synchronization). Book a Demo to see how iFactory's pre-built CMMS connectors automate the prediction-to-work-order pipeline.
- Which CMMS platforms have pre-built certified connectors — SAP, Oracle, JDE, Microsoft Dynamics, Fiix, MaintainX, UpKeep, eMaint, or others?
- Does the connector support bidirectional data synchronization — work orders created from predictions AND work order outcomes fed back as model training data?
- How often is the connector updated when the CMMS vendor releases an API version change?
- Does the integration include ERP spare parts inventory lookup for recommended replacement part numbers in work orders?
- Can the platform generate purchase requisitions for spare parts when RUL drops below a configurable threshold?
- Does the integration support multi-plant ERP configurations with different part numbering systems per site?
- Which SCADA platforms and industrial historians have pre-built connectors — OSIsoft PI, AspenTech IP.21, Ignition, Siemens WinCC, Rockwell FactoryTalk?
- Does the connector support OPC-UA, Modbus TCP, MQTT, and REST API data ingestion without custom development?
- What is the documented maximum data ingestion rate per connector — 1,000, 10,000, or 100,000 data points per second?
- Does the platform include a shift logbook for operator-reported observations alongside sensor-generated predictions?
- Can operators acknowledge alerts, document findings, and update work order status from a mobile device without VPN or desktop access?
- Does the operator interface support offline mode for areas without cellular or WiFi coverage?
Category 4: Industry-Specific Deployment Experience (Weight: 17%)
Predictive maintenance for rotating equipment in heavy industrial environments is not interchangeable with PdM for HVAC systems, data center cooling, or commercial building management. The vibration profile of a 2,000 HP motor driving a reciprocating compressor in a refinery is fundamentally different from a 50 HP fan motor in a commercial HVAC system. Vendors with heavy industrial deployment experience calibrate their models, thresholds, and escalation protocols for the specific failure physics of your industry.
- How many production deployments does the vendor have in your specific industry (steel, cement, chemical, oil and gas, power generation, pulp and paper, food and beverage)?
- Can the vendor provide reference calls with maintenance managers at plants with similar equipment density and vintage?
- What is the average deployment duration in your sector — from contract signature to first production prediction?
- Does the vendor have documented experience deploying in brownfield facilities with existing sensor coverage, or only in greenfield sites with new sensor installation?
- How does the vendor handle integration with legacy equipment — pre-2000 vintage motors, non-communicating PLCs, analog-only instrumentation?
- What is the documented data quality issue rate in brownfield deployments — percentage of initially connected sensors producing usable data after 30 days?
- Are models trained at one site transferable to similar equipment at another site, or must models be retrained from scratch for each facility?
- How does the vendor handle model portability when equipment nameplate details differ between sites — different bearing suppliers, different lubrication schedules?
- Does the vendor offer a fleet-level analytics view across multiple plants with consistent KPIs and health scores?
- Does the platform support OSHA PSM mechanical integrity documentation requirements for process safety management?
- Does the platform generate audit-ready inspection records for ASME pressure vessel certification and state-jurisdiction compliance?
- Can the platform document bearing failure prediction data for insurance risk assessment and premium negotiation purposes?
Category 5: Support SLA Structure (Weight: 12%)
Support quality determines whether a PdM platform delivers sustained value or degrades into alarm fatigue and abandoned dashboards after the first year. Evaluation must distinguish between vendor-reported uptime (which measures server availability) and value delivery uptime (which measures prediction accuracy, alert reliability, and integration health).
- What are the guaranteed response times for severity 1 (platform down), severity 2 (prediction accuracy degradation), severity 3 (configuration or integration issue), and severity 4 (feature request)?
- What is the escalation path — first response from support engineer, then senior engineer, then product manager, then engineering lead?
- Are response times measured in business hours or 24/7 coverage, and does severity classification include false alarm rate monitoring?
- Does the vendor monitor model accuracy post-deployment and proactively notify customers when prediction confidence degrades or false positive rates exceed agreed thresholds?
- How is model accuracy SLA defined — as standalone metrics or relative to a baseline (manual analysis, previous vendor, industry benchmark)?
- What is the vendor's documented average false positive rate per monitored asset per month across their customer base?
- What customer success resources are included — dedicated account manager, reliability engineering consultation, periodic model performance reviews?
- How is customer success staffed — one CSM per how many customers, with what technical qualifications and industry background?
- Does the vendor offer a customer community, knowledge base, or training program for reliability team capability building?
- What is the data retention policy — raw vibration waveforms, envelope spectra, predicted events, work order records, and model artifacts retained for how long?
- Does the platform support data export in open formats (CSV, Parquet, JSON) without proprietary compression or encryption?
- If the vendor ceases operations or is acquired, what is the guaranteed data migration path and timeline?
Category 6: Pricing Model Transparency (Weight: 8%)
Pricing model transparency is the lowest-weighted category not because cost is unimportant, but because pricing structures vary dramatically across vendors and a low price with a restrictive model is more dangerous than a higher price with a predictable, scalable model. The goal of this category is not to identify the cheapest vendor — it is to identify the vendor whose pricing model aligns with your deployment scale trajectory over a 3–5 year horizon.
- Is pricing per asset, per sensor, per user, per data volume, or a fixed platform subscription with unlimited assets?
- What is the projected total cost for year 1, year 3, and year 5 at your plant's asset count and sensor coverage trajectory?
- Are there minimum commitment requirements — minimum number of sensors, minimum subscription term, minimum annual spend?
- What is included in the implementation fee — sensor installation support, platform configuration, integration setup, and team training?
- Are training sessions included for operator-level users, analyst-level users, and administrator-level users separately?
- What is the cost of additional training sessions beyond the included scope — per session, per day, or per attendee?
- What is the contract term — month-to-month, annual, multi-year, evergreen with auto-renewal?
- What is the notice period for termination without cause — 30 days, 60 days, 90 days, or more?
- Does the contract include a data export fee or penalty for early termination, and is the export format specified in the agreement?
- Does the vendor offer any form of ROI guarantee — downtime reduction, failure prediction accuracy, or payback period?
- Are service credits available if platform uptime or prediction accuracy falls below SLA thresholds?
- Is the warranty structured as financial compensation, service extension, or both, and what is the maximum liability cap?
Vendor Scoring Methodology — How to Rank Responses Objectively
The scoring matrix transforms qualitative RFP responses into a quantifiable, defensible vendor ranking. The methodology is designed for multi-evaluator scoring (3–5 stakeholders scoring independently) with structured consensus resolution to eliminate individual bias from the final ranking. Each category receives a weight percentage, each criterion within that category receives a score of 0–5, and the weighted total determines the vendor ranking. Mandatory pass-fail criteria are evaluated before scoring begins — any vendor failing a pass-fail criterion is disqualified regardless of other scores.
| Category | Weight | Criteria Count | Max Category Score | Minimum Pass Threshold | Scoring Scale |
|---|---|---|---|---|---|
| Sensor Hardware Quality | 18% | 6 | 30 | 24 (80%) | 0–5 per criterion |
| AI Algorithm Accuracy | 25% | 6 | 30 | 26 (87%) | 0–5 per criterion |
| CMMS/ERP Integration | 20% | 6 | 30 | 24 (80%) | 0–5 per criterion |
| Industry Experience | 17% | 6 | 30 | 20 (67%) | 0–5 per criterion |
| Support SLA Structure | 12% | 6 | 30 | 16 (53%) | 0–5 per criterion |
| Pricing Transparency | 8% | 6 | 30 | 12 (40%) | 0–5 per criterion |
| Total | 100% | 36 | 180 | 122 (68%) | — |
Frequently Asked Questions — PdM Vendor Evaluation
Industry best practice for PdM platform procurement is a three-stage filtering process. Stage 1: issue a broad RFI to 12–20 vendors to gather capability, pricing, and deployment data. Score RFI responses against the mandatory pass-fail criteria and category minimum thresholds defined in this framework to narrow to 4–6 vendors. Stage 2: invite shortlisted vendors for structured technical demos focused on your three highest-weighted categories — typically algorithm accuracy, integration depth, and industry experience. Score demos independently using 3–5 evaluators with the 0–5 per-criterion scale. Stage 3: conduct site visits or reference calls with 2–3 top-scoring vendors at plants of similar equipment density and industry. This three-stage process typically completes in 10–14 weeks and produces a defensible, documented vendor selection that satisfies procurement audit requirements.
Yes, with specific structural requirements that prevent the PoC from becoming a 12-month evaluation loop. Define the PoC scope in the RFP — specific asset classes (e.g., 10 critical motors and 5 critical pumps), duration (4–6 weeks), success metrics (classification accuracy, false positive rate, and integration completion), and exit criteria (the threshold at which the PoC is considered successful). Require the vendor to connect to your existing sensors — not install their own — so the PoC evaluates algorithm performance on your actual data quality, not on laboratory-grade sensor data. Require the vendor to demonstrate CMMS integration by creating a test work order in your existing system from a prediction event. A properly structured PoC completed in 4–6 weeks provides more decision-relevant information than 20 hours of demo presentations. Vendors who resist structured PoC requirements with clear success metrics should be deprioritized — they are either uncertain their models will perform on your data or unwilling to invest the engineering time required for a valid evaluation.
Sensor-agnostic architecture is the single most important architectural requirement for brownfield facilities — plants where sensor investment has already been made across multiple vendor ecosystems over multiple capital cycles. A vendor that requires proprietary sensors for their AI models to operate forces you to either replace existing sensors (a capital cost that typically exceeds the platform subscription cost in year one) or maintain parallel sensor networks (increased maintenance burden with no prediction benefit). Sensor-agnostic platforms like iFactory ingest data from any accelerometer, RTD, current transducer, or PLC register through OPC-UA, Modbus, MQTT, and REST API connectors — their AI models are trained to work with whatever data quality and format your existing sensors provide. During vendor evaluation, ask for specific documentation of sensor-agnostic data ingestion in brownfield deployments of equivalent complexity to your facility. Vendors who can demonstrate this capability with reference calls from plants using third-party sensors should score highest in this category.
For a mid-size industrial facility with 200–500 critical rotating assets, partial existing sensor coverage, an established CMMS, and a 3–5 person reliability engineering team, total PdM platform cost ranges from $85,000 to $175,000 in year one depending on deployment scope and vendor pricing model. The cost breakdown typically spans platform subscription ($45,000–$90,000 depending on per-asset or flat-rate pricing), implementation and integration services ($25,000–$55,000 including CMMS connector setup and sensor connectivity), and additional sensor hardware for uncovered assets ($15,000–$30,000). Year-two costs typically decrease 15–25% as implementation costs drop to ongoing support only. The 3-year total cost of ownership for this facility profile ranges from $225,000 to $450,000. Compare this against the cost of a single unplanned critical asset failure — $150,000–$500,000 depending on equipment criticality and production impact — and the ROI case for PdM platform investment is clear. The evaluation question is not whether the investment is justified — it is which vendor delivers the lowest false positive rate, the deepest CMMS integration, and the most reliable model accuracy over the 3-year horizon.
Vendors report accuracy using different metrics — overall classification accuracy, precision-recall curves, F1 scores, or ROC-AUC — and without a standardized reporting framework, comparison is unreliable. Standardize your evaluation by requiring all vendors to report the same three metrics for their most comparable deployment: false positive rate per monitored asset per month (the most operationally relevant metric — how many alerts will your team need to investigate that turn out to be false alarms), detection latency (how many hours or days between the first detectable anomaly signal and the vendor's alert), and fault type classification accuracy per failure mode (precision and recall for each fault type — inner race bearing fault, outer race bearing fault, imbalance, misalignment, looseness). Require these metrics to be reported against a defined baseline — manual analysis by certified vibration analysts at the reference site, or documented field failure events with known ground truth. Vendors who resist reporting against a baseline or who provide only aggregate accuracy metrics without per-fault-type breakdown should be scored lower in the algorithm accuracy category regardless of their headline accuracy number.