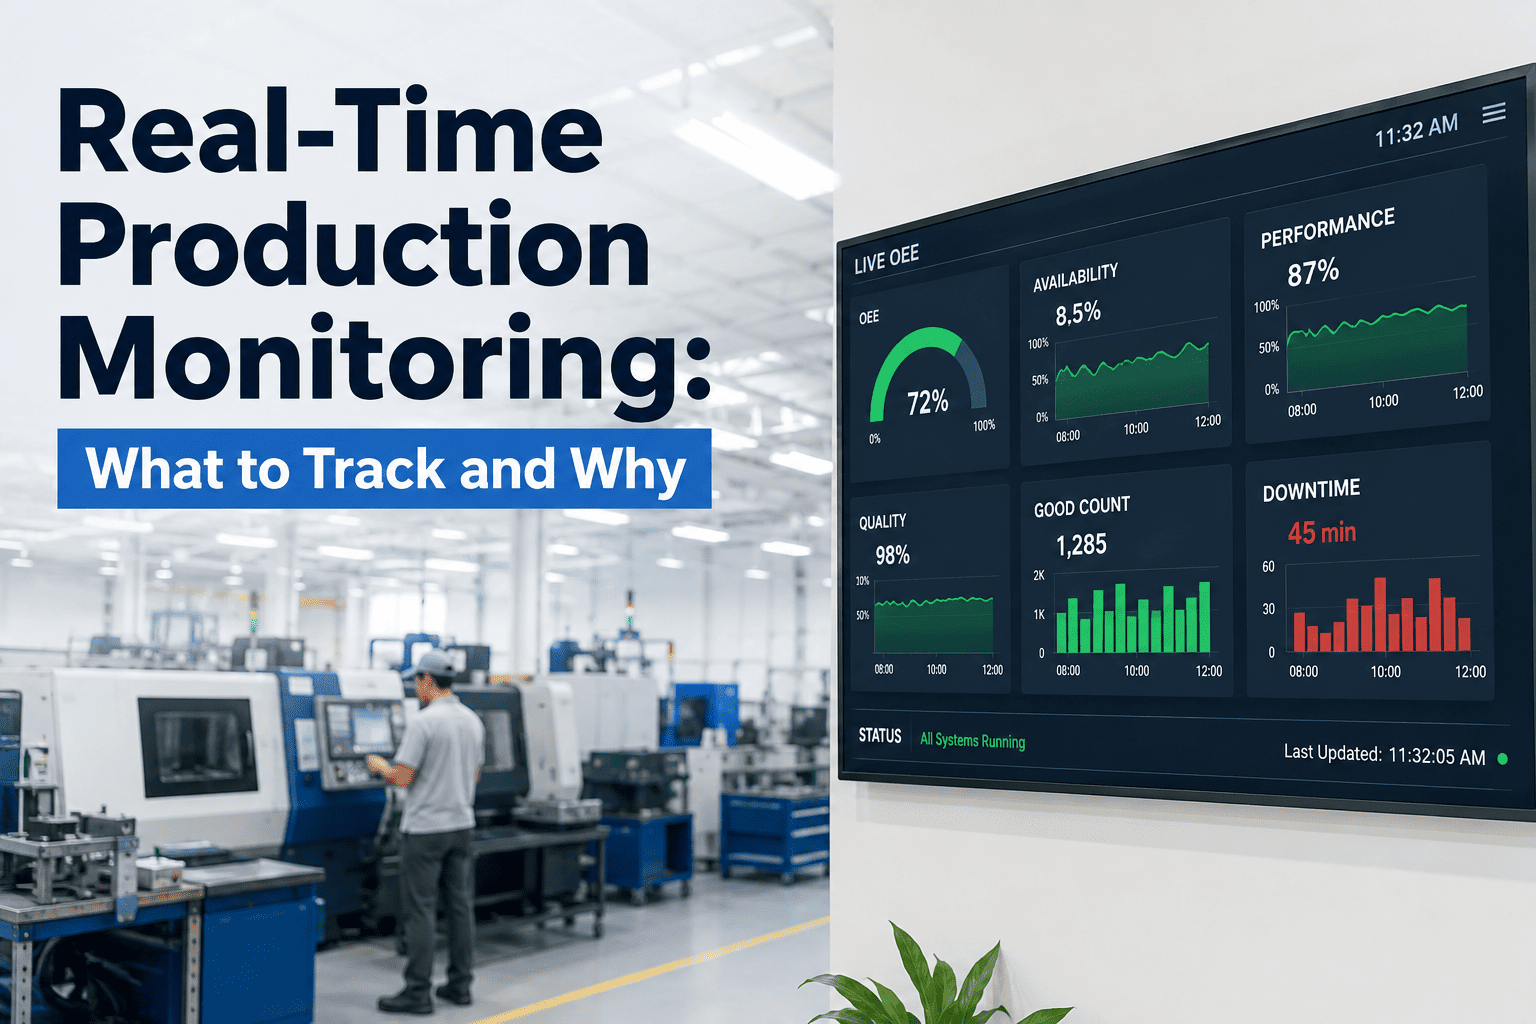
Micro stops are the hidden enemy of manufacturing efficiency. Unlike major breakdowns — which trigger alarms, stop lines, and flood the maintenance queue — micro stops pass silently, each lasting less than a few minutes, rarely logged, almost never analysed. Yet across a typical production line running one shift, fifty to a hundred micro stops accumulate every day. Individually they are invisible. Collectively they consume 10–15% of available production time that no one is tracking and no budget is protecting. This guide defines micro stops precisely, maps the six root categories that generate them, and explains why real-time OEE monitoring — not manual shift logs — is the only reliable mechanism to surface, classify and eliminate them. If your OEE is plateaued between 65% and 75% despite active maintenance and quality programmes, micro stops are almost certainly the reason.
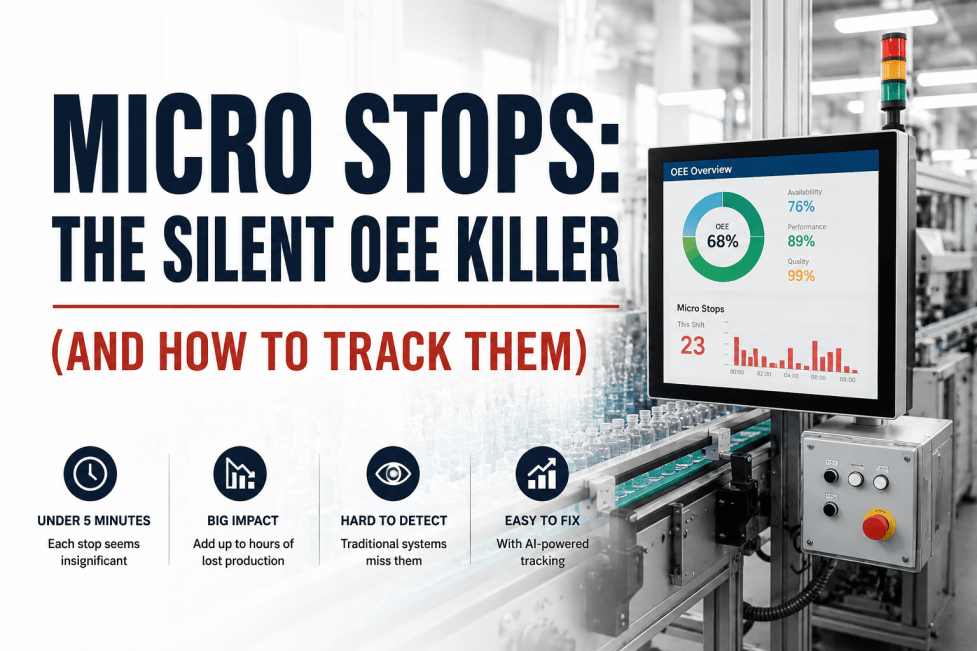
Micro Stops: The Silent OEE Killer
What Exactly Is a Micro Stop — and Why Most Operations Miss Them
A micro stop is any unplanned production interruption lasting between a few seconds and five minutes. The threshold varies by industry — some operations define them as under two minutes, others as under ten — but the common characteristic is that they are resolved by an operator without a formal work order, without a maintenance callout, and without a downtime entry in the shift log. They disappear from the record before anyone has decided whether to record them.
The ISA-95 standard and the OEE Foundation's loss taxonomy both classify micro stops under the Performance loss pillar — not Availability. This distinction matters. Availability losses are tracked. Performance losses at the micro stop level almost universally are not. The consequence is a permanently understated performance rate and a chronic OEE gap that no amount of planned maintenance investment will close.
The Six Root Categories of Micro Stops
Micro stops are not random events. When production lines are monitored at the PLC signal level, the same root categories appear consistently across industries and equipment types. Understanding the taxonomy is the first step to designing targeted elimination programmes.
The most common micro stop category. Material fails to feed correctly — insufficient pressure, oversized part, bridging in a hopper — and the operator clears the jam manually. Root causes concentrate in feed system wear, material specification drift, and hopper geometry. Elimination typically requires a combination of feed system redesign and upstream material control.
Proximity sensors, photoelectric eyes, and vision systems generate nuisance trips as they age, accumulate contamination, or drift out of calibration. The machine stops, the operator resets, production resumes. Without automated detection, this pattern repeats indefinitely. Elimination requires systematic sensor health monitoring and calibration scheduling integrated with the maintenance programme.
Between full changeovers, operators make small adjustments — re-tensioning, guide repositioning, minor tooling tweaks — that interrupt production flow without meeting the threshold for a formal changeover event. These are most prevalent in high-mix environments and accumulate fastest during the first hour after a full changeover, signalling setup quality issues rather than production instability.
Operators adjust speed, temperature, pressure, or timing parameters during production to compensate for process drift. Each adjustment interrupts cycle time even when the line does not fully stop. Real-time SPC monitoring is the primary detection mechanism; elimination requires process capability analysis and automatic closed-loop control where feasible.
A part or batch fails an inline check — vision system rejection, gauge out of tolerance, weight deviation — and the operator pauses the line to inspect or remove the nonconforming unit. Unlike end-of-line quality failures, inline quality holds are micro stops that carry both a time cost and a direct quality signal. High frequency in this category indicates upstream process instability.
The machine is ready but the operator is absent — attending to a neighbouring line, fetching materials, waiting for a supervisor decision. These stops are the most organisationally sensitive because they surface staffing design and work standard issues. Real-time monitoring makes operator wait visible; elimination requires honest analysis of line balance and staffing ratios.
How Micro Stops Silently Erode Your OEE Score
The arithmetic of micro stop losses is straightforward, but operations teams rarely see it presented in financial terms. The table below models the OEE impact of micro stops across five line scenarios — from a well-maintained high-volume line to a high-mix job shop — to illustrate why the performance gap compounds faster than most operations leaders expect.
| Scenario | Micro Stops / Shift | Avg Duration | Lost Time / Shift | OEE Performance Loss | Annual Revenue Exposure* |
|---|---|---|---|---|---|
| High-volume discrete line | 45 | 1.8 min | 81 min | 16.9% | $340K–$820K |
| Mixed-mode assembly line | 72 | 2.3 min | 165 min | 22.9% | $540K–$1.3M |
| High-mix job shop | 98 | 3.1 min | 303 min | 31.6% | $890K–$2.1M |
| Food & beverage packaging | 61 | 1.4 min | 85 min | 17.7% | $380K–$940K |
| Pharmaceutical blister line | 38 | 2.9 min | 110 min | 22.9% | $620K–$1.5M |
*Revenue exposure modelled at $1,200–$2,900 per hour of lost production capacity. Assumes 250 operating days, 2 shifts.
The 90-Day Micro Stop Elimination Workflow
Eliminating micro stops is not a single initiative — it is a phased operational programme. The workflow below reflects the sequence that consistently delivers measurable OEE improvement within a single business quarter, based on deployment experience across mid-market discrete and process manufacturers.
Real-Time OEE Monitoring vs. Manual Shift Logging
The fundamental limitation of manual downtime logging is latency — by the time an operator records a stop event, the context that would make root cause analysis meaningful has evaporated. More critically, operators resolving micro stops in under a minute are not pausing to log them, because the effort of logging exceeds the duration of the event. This is rational behaviour, not negligence. The system design is the problem.
The most consistent finding across mid-market MES deployments is that manufacturers discover their real OEE is 12–18 percentage points below what manual reporting showed. The gap is almost entirely micro stops. Operations leaders who resist automated monitoring often cite operator trust concerns — they worry the data will be used punitively. The organisations that successfully eliminate micro stops frame the programme differently: the data targets machines and processes, not people. Operators become the authors of the elimination programme, not the subjects of it. That reframe changes everything about adoption speed and sustainability.
Frequently Asked Questions: Micro Stops and OEE
In standard OEE loss taxonomy, minor stoppages and micro stops are often used interchangeably, but precise practitioners distinguish them by duration threshold. Micro stops are typically under two minutes; minor stoppages cover two to ten minutes. Both fall under the Performance loss pillar of OEE rather than Availability, because the machine remains capable of running — the interruption is brief enough that the operator resolves it without formal maintenance intervention. The practical distinction matters most when configuring your OEE monitoring system: different threshold settings will shift events between the two categories and change your Performance vs. Availability split accordingly.
PLC signal monitoring is the gold standard, but two alternative approaches are viable when PLC connectivity is not immediately available. Vision-based cycle time monitoring uses a camera positioned on the production line to detect motion cessation; it captures most stops with 85–90% accuracy relative to PLC monitoring. Power consumption monitoring via clamp-on current sensors can detect machine state changes on simple equipment. Neither alternative provides the event classification depth that PLC signals enable — you will know that a stop occurred but not the specific signal pattern that caused it. In practice, the incremental value of PLC connectivity is significant enough that it should be prioritised even when it requires modest integration work.
For manufacturers who commit to the full elimination workflow — baseline, root cause analysis, countermeasure deployment — measurable OEE improvement is typically visible within 30–45 days of monitoring go-live. The initial gains are disproportionately large because the first Pareto analysis almost always surfaces a small number of high-frequency root causes that are straightforward to eliminate. A line generating 70 micro stops per shift often has 30 of those stops traceable to two or three specific causes. Eliminating those causes produces an immediate step-change in performance that justifies the full monitoring investment within the first quarter of deployment.
High-speed packaging, food and beverage filling, pharmaceutical blister and bottling lines, and automotive component assembly consistently show the highest micro stop frequency — typically because these operations combine high cycle rates with sensitivity to material variation and tight mechanical tolerances. A packaging line running 200 cycles per minute will accumulate far more micro stop time than a machining centre with a four-minute cycle time, even if the absolute number of stop events is similar. Process industries — chemical, polymer, refining — experience fewer micro stops by count but longer durations per event, reflecting process response time rather than mechanical sensitivity.
Start at the line and machine level, not the facility level. Facility-level averages mask the distribution — a single bottleneck machine generating 60% of micro stop losses will be obscured in a plant average that looks tolerable. Once you have line-level data, set elimination targets by root cause category rather than by gross stop count: targeting a 70% reduction in feed-jam stops is more actionable than targeting 15 fewer stops per shift overall. Once root cause categories are under control at the line level, shift-level consistency targets become meaningful — they reveal whether countermeasures are holding across all operators and all production windows, or whether gains are concentrated in one shift.
Get Your Real OEE — Not the One Your Shift Logs Report
Conclusion: Visibility Is the First Step to Recovery
Micro stops are not a maintenance problem. They are a measurement problem. Operations that cannot see sub-five-minute stoppages cannot prioritise them, analyse them, or eliminate them — and they will continue to lose 10–15% of production capacity to events their reporting systems are structurally incapable of capturing.
The path to elimination is well-defined: instrument for real-time PLC-level detection, establish a clean baseline, run a disciplined Pareto-driven root cause programme, and deploy countermeasures against the 20% of causes responsible for 80% of time loss. Manufacturers who follow this sequence consistently recover 12–18 OEE points within a single business quarter — without capital investment in new equipment and without adding headcount.
The only prerequisite is seeing what is actually happening on your lines. iFactory's Real-Time OEE Dashboards are built specifically to make that visibility operational within weeks, not months.