Every hour your shop floor runs without real-time production monitoring is an hour your competitors are pulling ahead — capturing data you are discarding, optimising yield you are leaving on the table and preventing failures you are paying to repair. The manufacturers winning in today's market are not the ones with the most machines — they are the ones who know exactly what every machine is doing, right now.
Real-Time Production Monitoring: What to Track and Why
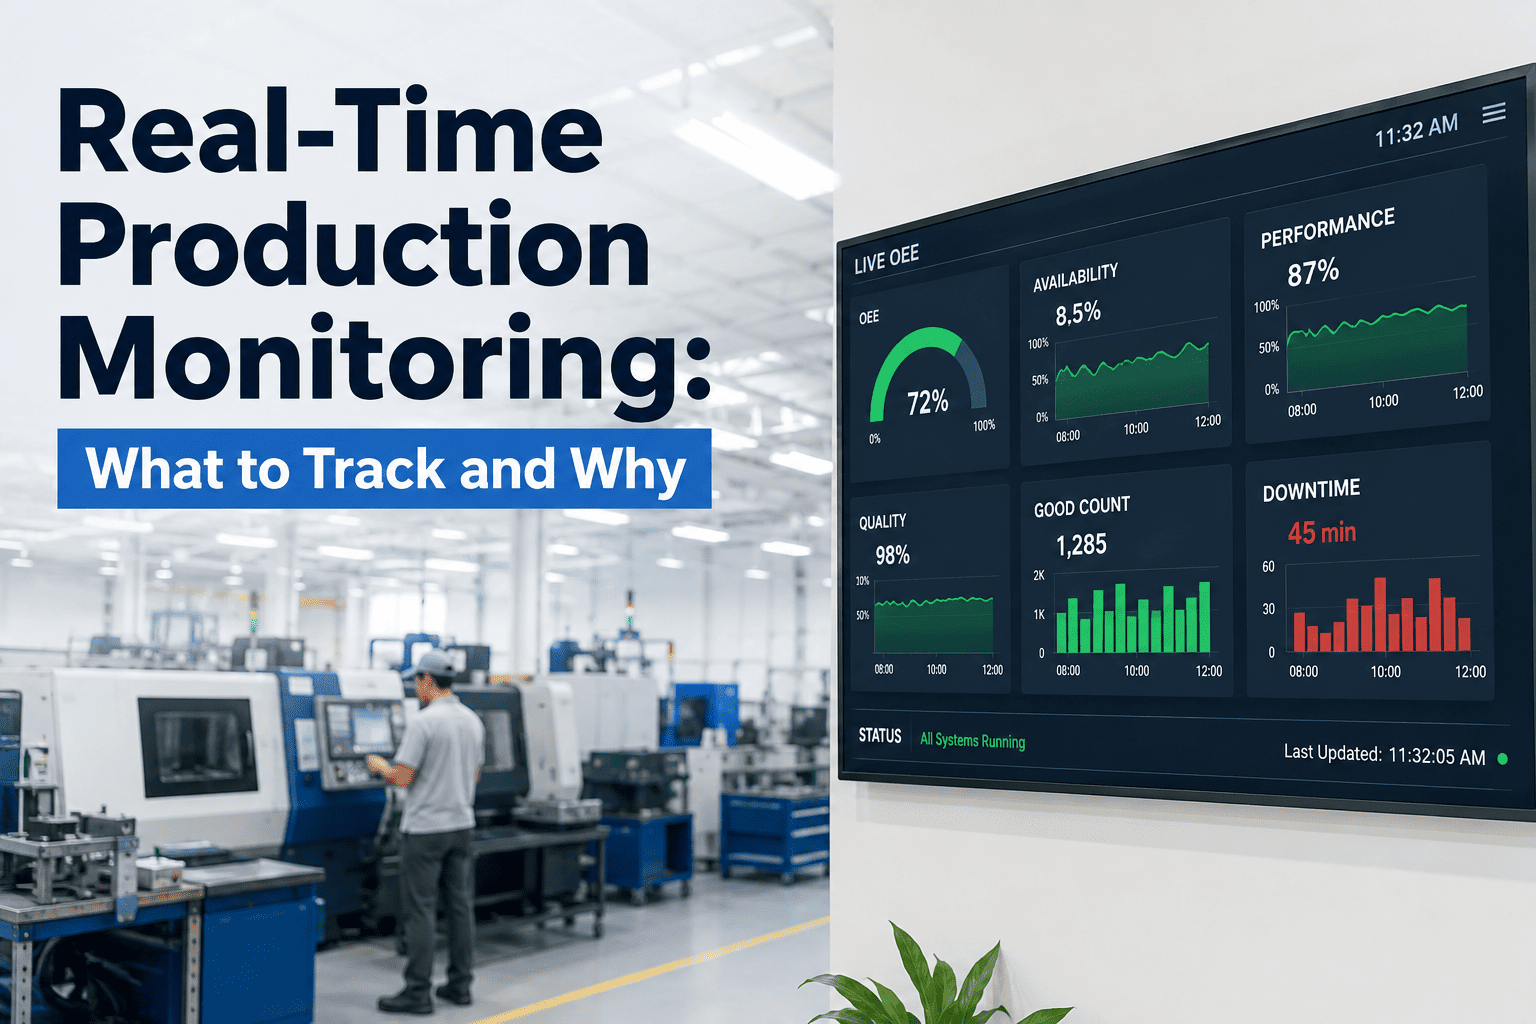
What Real-Time Production Monitoring Actually Means
Real-time production monitoring is the continuous collection, processing, and visualisation of machine and process data as it is generated — not reported after the shift, not summarised in a weekly review, but streamed live into dashboards that drive immediate decisions. At its core, it replaces instinct-based floor management with signal-based operations.
When implemented correctly, real-time monitoring tells you not just what happened, but what is happening and what is about to happen. That temporal shift — from lagging to leading indicators — is where the financial value lives.
- Live OEE dashboards eliminate the 4–8 hour lag between failure and corrective action, directly recovering lost production revenue
- Machine-level signal monitoring enables condition-based maintenance — cutting maintenance spend 25–40% versus fixed-schedule approaches
- Continuous quality data correlation reduces scrap and rework rates by identifying process drift before it becomes a defect batch
The Six Metrics Every Production Monitor Must Track
Not all production data is equal. The following six metric categories represent the highest-signal data streams for manufacturing operations — each directly linked to a financial outcome.
For deeper coverage of each metric and how to configure alert thresholds specific to your equipment, book a free strategy session with an iFactory engineer.
Legacy Operations vs. Real-Time Monitored Facility
The performance gap between manufacturers operating on delayed data and those running live OEE dashboards is not marginal — it is structural. The following comparison matrix maps that gap across the decisions that matter most to production leadership.
| Decision Area | Legacy Friction — The Old Way | Optimised Excellence — With iFactory |
|---|---|---|
| Downtime Response | Supervisor notified by operator — 15–45 min delay. Root cause logged from memory at shift end. | Automated alert fires within 90 seconds. Downtime reason captured at the machine. RCA data complete before the technician arrives. |
| OEE Visibility | Calculated weekly from manually entered shift reports. Data is incomplete, inconsistent, and always stale. | Live OEE displayed per asset, per line, per facility. Updated every 30 seconds. Comparable across shifts, cells, and sites. |
| Maintenance Timing | Calendar-based — service intervals set by OEM recommendations regardless of actual asset condition or utilisation. | Condition-triggered — maintenance scheduled when asset signals indicate need. Neither too early nor too late. |
| Quality Control | Defects discovered at inspection points or by downstream processes. Entire batch potentially compromised before detection. | Process parameter drift flagged in real time. Corrective action possible within the same part cycle. |
| Energy Management | Monthly utility invoices reviewed by finance. No asset-level attribution. No production correlation. | Live energy-per-unit tracking per asset. Waste identified within the shift it occurs. Correlated to throughput and quality data. |
| Capacity Planning | Based on theoretical capacity and historical averages. Rarely accounts for actual asset performance degradation over time. | Based on demonstrated live capacity and trending asset health. Plans reflect reality, not assumptions. |
The Three-Layer Architecture of Effective Shop Floor Monitoring
High-performing production monitoring programmes are not built from a single dashboard — they operate across three distinct data layers, each feeding the next with increasing analytical depth.
- Vibration, temperature, current, and pressure sensors on critical assets
- PLC and SCADA integration via OPC-UA and MQTT protocols
- Operator input panels for manual downtime reason capture
- Vision systems for inline quality inspection data
- Edge computing normalises and timestamps all incoming signals
- AI models calculate OEE components in real time per asset
- Anomaly detection compares live signals against learned baselines
- Predictive models project Remaining Useful Life for critical components
- Live dashboards surface alerts to the right person at the right level
- Auto-generated work orders push to CMMS when thresholds are crossed
- ERP integration updates capacity and delivery commitments in real time
- Executive reporting translates operational signals into financial language
Business Impact Grid: What Changes When You Monitor in Real Time
- Downtime response time drops from 30+ minutes to under 2 minutes
- Shift handover quality improves — live data replaces verbal summaries
- Maintenance scheduling driven by condition, eliminating unnecessary jobs
- Production planning decisions based on demonstrated, not assumed, capacity
- Maintenance spend reduced 25–40% by eliminating over-servicing
- Manual data collection labour eliminated — sensors capture automatically
- Energy waste identified and corrected within the shift it occurs
- Scrap and rework costs cut as process drift is caught before defect batches
- OEE improvements of 15–23% translate directly to increased throughput
- On-time delivery rates improve as capacity visibility improves
- Asset lifespan extended through condition-based intervention timing
- New facility onboarding accelerated by replicating proven monitoring configurations
Implementation Timeline: From First Sensor to Full Dashboard
A common misconception is that real-time production monitoring requires months of infrastructure preparation before delivering value. In practice, iFactory's phased deployment model produces live OEE data within days of sensor installation — not months.