Every minute your line runs below capacity is revenue that never comes back. Manufacturers operating at 60% OEE — the industry average — are silently bleeding 40% of their theoretical output. That is not a maintenance problem. It is a strategic liability. The facilities closing that gap to 85% world-class OEE are not working harder; they are measuring smarter, acting faster and compounding small gains into lasting competitive advantage. If your production data still lives in spreadsheets and shift logs, your competitors with real-time OEE dashboards already know what you will not learn until next week's review.
iFactory Implementation Intelligence
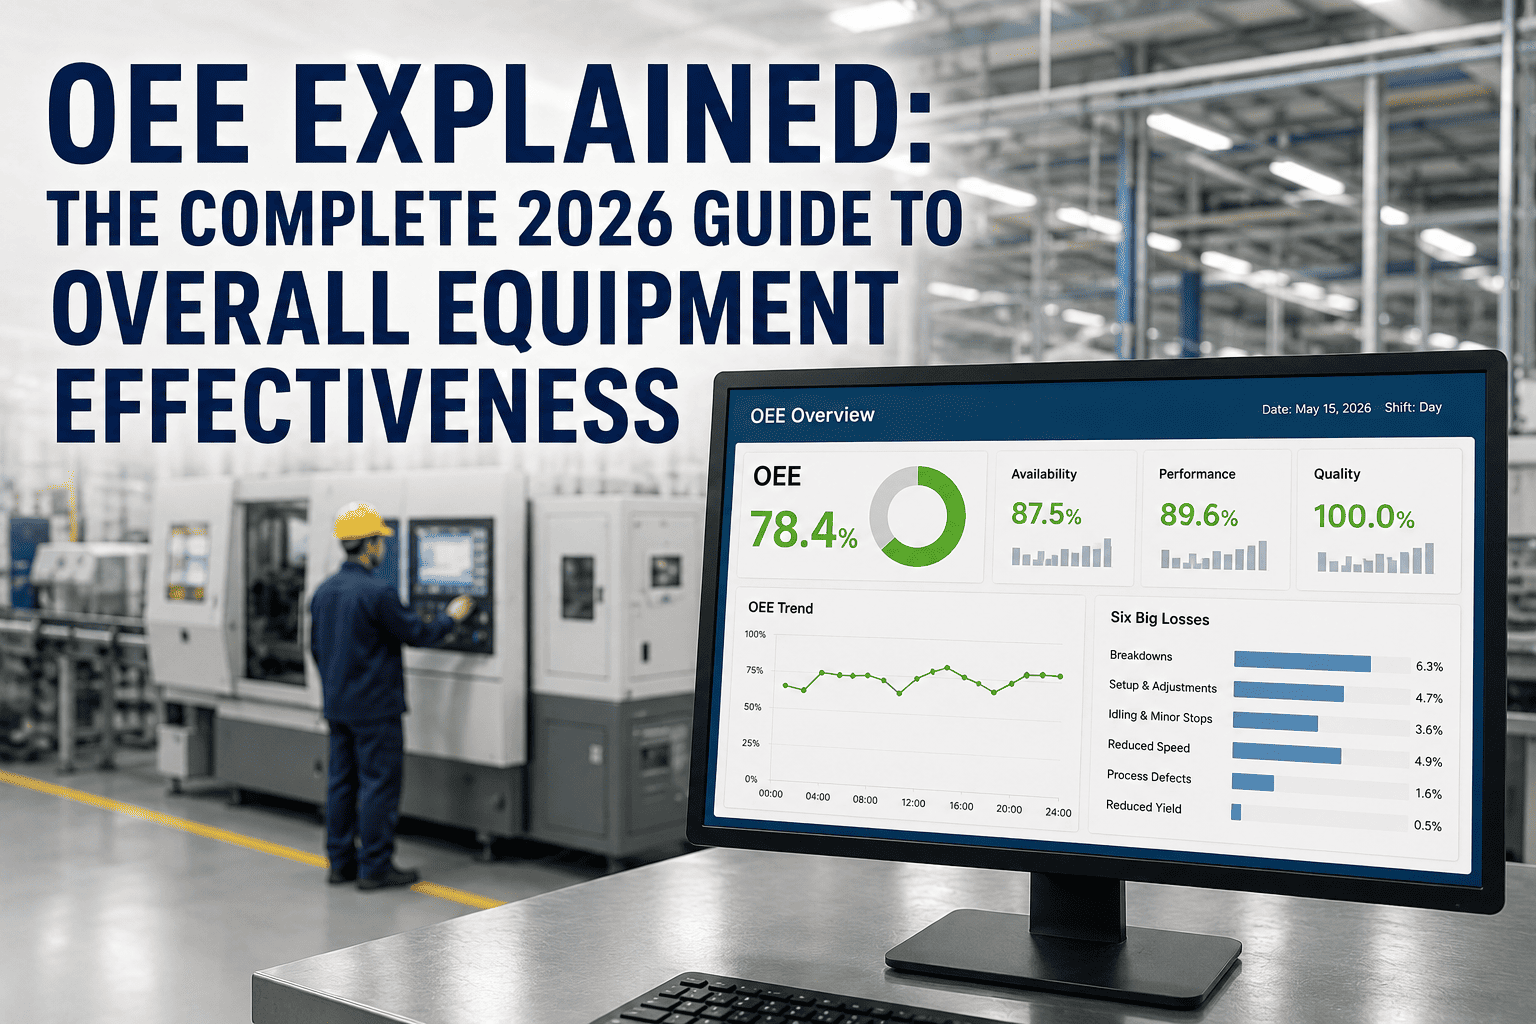
OEE Explained: The Complete 2026 Guide to Overall Equipment Effectiveness
The definitive resource on OEE formula, world-class benchmarks, the Six Big Losses, and how real-time monitoring lifts OEE from 60% to 85% — with measurable ROI at every stage.
60%
Average industry OEE — the baseline most plants accept
85%
World-class OEE — the benchmark top performers sustain
25%
Output gain achievable by closing the OEE gap
4-6wk
Time to first real-time OEE visibility with iFactory
What Is OEE? A Plain-Language Definition
Overall Equipment Effectiveness (OEE) is the gold-standard metric for measuring manufacturing productivity. It answers one question with precision: of all the time a machine could have been producing good parts, how much of that time did it actually do so? OEE is expressed as a percentage and calculated from three component scores — Availability, Performance, and Quality — each of which isolates a distinct category of production loss.
Availability
Run Time ÷ Planned Production Time
Measures losses from unplanned downtime and changeover delays. Every unscheduled stop — whether a bearing failure or a jammed conveyor — erodes Availability directly.
Performance
(Ideal Cycle Time × Total Count) ÷ Run Time
Captures speed losses. A machine running at 80% of its rated speed scores 80% Performance — even if it never stops. Micro-stoppages and reduced throughput live here.
Quality
Good Count ÷ Total Count
Reflects yield losses — defects, rework, and startup scrap. Parts that do not ship first-time-right are production time consumed with no revenue return.
OEE Benchmarks: Where Do You Actually Stand?
Understanding your OEE score in isolation means little without context. These benchmarks, validated across discrete and process manufacturing, give leadership a calibrated reference for setting improvement targets and quantifying the revenue gap between current performance and world-class operation.
Below 65%
Needs Immediate Attention
Significant losses across all three components. Major competitive disadvantage.
Emergency improvement program. Real-time monitoring essential.
65–75%
Below Average
Chronic losses in Availability or Performance. Reactive maintenance dominant.
Structured loss elimination. Transition to condition monitoring.
75–85%
Average to Good
Most facilities land here. Visible losses but management awareness exists.
Predictive analytics to push through to world-class threshold.
85%+
World-Class
Top-quartile performance. Proactive maintenance. Minimal unplanned downtime.
Sustain and benchmark cross-facility to protect the advantage.
The Six Big Losses: Where OEE Points, Action Must Follow
OEE is only valuable when it drives targeted intervention. The Six Big Losses framework — developed alongside the original OEE methodology — maps each component score to specific, addressable loss categories. Knowing your OEE score without knowing which loss is driving it is like knowing you have a fever without knowing the cause.
01
Unplanned Downtime
Equipment failures, breakdowns, and emergency stops that halt production with no advance warning. Typically the single largest OEE loss in reactive maintenance environments.
02
Planned Downtime
Changeovers, setups, and scheduled maintenance. Often accepted as fixed — but real-time data consistently reveals changeover time reduction opportunities of 20–40%.
03
Micro-Stoppages
Stops under five minutes — jams, sensor trips, brief blockages — that individually seem trivial but collectively destroy Performance scores. Invisible to shift logs; visible to real-time OEE.
04
Reduced Speed
Equipment running below its nameplate rate due to wear, process drift, or operator caution. A line running at 85% speed all shift scores 85% Performance regardless of uptime.
05
Production Defects
Scrap and rework produced during stable running. Every defective unit consumed machine time, material, and energy without generating saleable output.
06
Startup Losses
Off-spec product generated during warmup, startup, or following a changeover before stable conditions are achieved. Frequently undercounted in manual tracking systems.
Legacy Tracking vs. Real-Time OEE Intelligence
The methodology of OEE has existed since the 1960s. The differentiator in 2026 is not whether you measure OEE — it is the speed and granularity at which you act on it. The gap between manual OEE tracking and real-time AI-powered dashboards is not incremental. It is the difference between managing yesterday's production and optimising today's.
Data Frequency
Manual shift logs — reviewed 24–48 hrs later
Continuous sensor feed — updated every 10 seconds
Loss Visibility
Downtime events only — micro-stoppages invisible
All Six Big Losses tracked and categorised automatically
Intervention Speed
Post-shift review — losses already locked in
Real-time alerts — operators act before losses compound
Root Cause Analysis
Manual investigation — days to identify patterns
AI pattern recognition — root causes surfaced in hours
Reporting
Spreadsheet exports — static, backward-looking
Live dashboards — drill-down from facility to asset
Maintenance Link
OEE and maintenance operate in separate silos
OEE drops trigger automatic CMMS work orders
Predictive Capability
None — all reporting is historical
14–21 day failure predictions prevent Availability losses
How iFactory Real-Time OEE Dashboards Drive Performance
Faster Intervention
Alerts fire within seconds of an Availability or Performance deviation. Operators receive context-rich notifications — asset ID, loss category, and recommended action — before the event escalates into a full stoppage.
Reduced Overhead
Automated data capture eliminates manual OEE logging — typically 4–8 hours of engineer time per week per line. Reporting that once took two days generates in real time. Teams redirect effort from data entry to loss elimination.
Sustained Output Growth
Facilities that deploy real-time OEE dashboards consistently achieve 8–15 OEE percentage point improvements within 12 months. On a line running $10M annual output, that is $800K–$1.5M in additional production without adding assets.
$1.5M
Additional annual output per line from a 15-point OEE gain on $10M throughput
8–15pt
Typical OEE improvement within 12 months of real-time dashboard deployment
95%
Of predictive maintenance adopters report positive ROI within the first year
Frequently Asked Questions
What is a realistic OEE improvement target for the first year?
Most facilities moving from manual tracking to real-time dashboards see 8–12 OEE percentage points in year one. The early gains come from eliminating invisible losses — micro-stoppages and speed deviations that manual logs miss entirely. Phase 2 gains, driven by predictive maintenance reducing Availability losses, typically follow in months 6–12.
Does OEE apply to process manufacturing as well as discrete?
Yes. OEE was developed in discrete manufacturing but applies equally to continuous process environments — food and beverage, chemicals, pharmaceuticals, and utilities — with minor adaptations to cycle time definitions. The Six Big Losses map directly to process plant performance categories. iFactory's platform is configured for both manufacturing archetypes.
How does real-time OEE integrate with existing MES and ERP systems?
iFactory connects via OPC-UA, MQTT, and REST APIs to existing SCADA, historian, MES, and ERP platforms. The OEE layer runs alongside current systems — no rip-and-replace. Production orders from ERP provide the planned production time denominator; OEE data feeds back into MES for scheduling optimisation and ERP for cost accounting.
Can we start with one line and expand?
That is the recommended approach. Start with your highest-impact line — typically the bottleneck or highest-revenue asset group. Prove OEE improvement within 8–12 weeks, document the financial return, and use that business case to fund expansion. Most customers reach full-facility coverage within 10–12 months of their first line deployment.
Stop Measuring Yesterday. Start Optimising Today.
Your Real-Time OEE Dashboard Can Be Live in 4–6 Weeks
iFactory's real-time OEE platform gives your team instant visibility into every loss category — Availability, Performance, and Quality — with alerts that fire in seconds, not shift reports. First line. First result. Then scale.
85%
World-class OEE target
4-6wk
Time to first live dashboard
10-30x
Return on investment
$3.5M
Annual savings potential