Every minute your plant runs without real-time KPI visibility is a minute your competitors are closing the gap. Untracked downtime becomes invisible revenue loss. Unmeasured scrap becomes normalised waste. Unmonitored asset health becomes an unplanned shutdown that costs $260,000 per hour — and the worst part is, you'll only find out after it happens. The manufacturers who outpace their sector are not necessarily running newer equipment. They are running smarter operations, with live dashboard intelligence that turns every floor metric into a decision. This guide covers the 20 manufacturing KPIs every plant should track, how to structure your dashboards for executive and operator visibility and how iFactory's Real-Time OEE Dashboards deliver the operational intelligence your facility needs to compete.
iFactory Manufacturing Intelligence
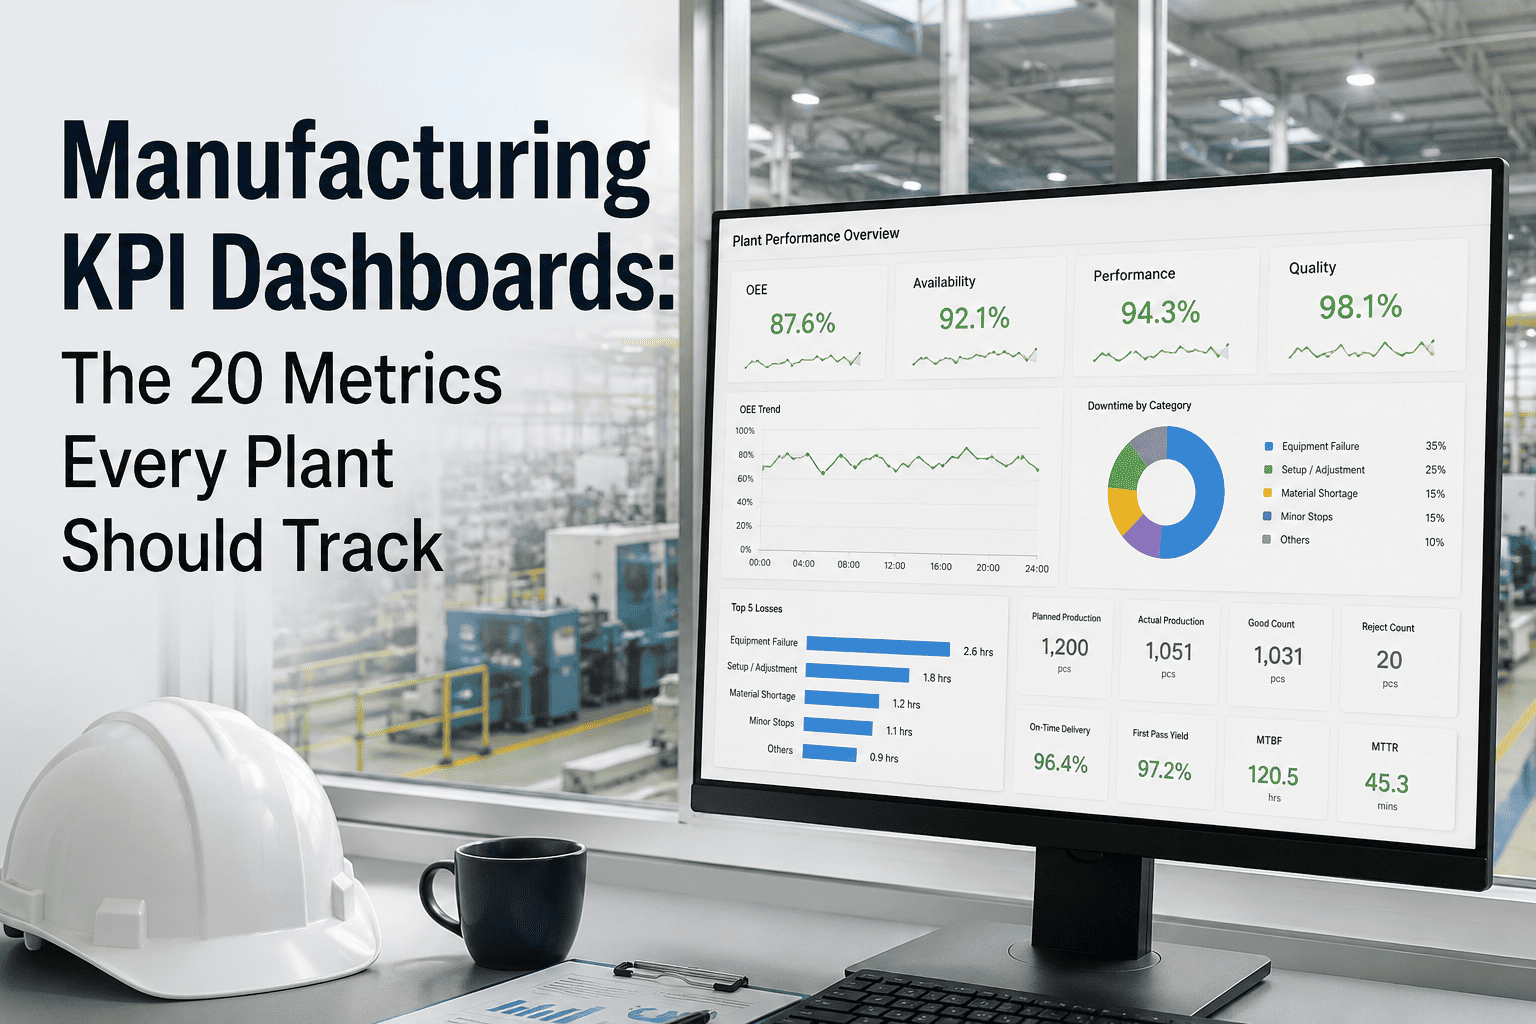
Manufacturing KPI Dashboards: The 20 Metrics Every Plant Should Track
Real-time OEE, FPY, MTBF, MTTR, scrap, on-time delivery — the definitive plant dashboard framework with measurable ROI at every level
23%
Average OEE gain in Year 1
$260K
Avg cost per hour of unplanned downtime
4–6 wk
Time to first live dashboard
95%
Of adopters report positive ROI
Why KPI Dashboards Are Now a Competitive Necessity
The era of weekly production reports is over. Plants running on Monday-morning spreadsheets are making Tuesday decisions on last week's data — a structural disadvantage that compounds daily. Modern manufacturing intelligence requires live visibility into the metrics that drive output, quality, uptime, and cost. Real-time KPI dashboards are not a luxury layer. They are the operational foundation that separates world-class plants from average performers.
⚠
The Cost of Blind Spots: Plants without real-time OEE dashboards average 33% more unplanned downtime and 2.4x higher scrap rates than facilities with live monitoring. Every hour of invisible inefficiency is measurable lost revenue.
Book a Demo → See Your Plant's KPIs Live
The 20 Manufacturing KPIs Every Plant Should Track
These metrics are grouped by operational domain. World-class plants track all 20 in real time. Start with your highest-impact category and expand from there.
01
Overall Equipment Effectiveness (OEE)
The master metric. Combines Availability, Performance, and Quality into a single score. World-class target: 85%+. Most plants start at 55–65%.
02
Availability Rate
Percentage of scheduled time assets are actually running. Downtime events — planned and unplanned — erode this score directly.
03
Performance Rate
Actual throughput vs. theoretical maximum speed. Slow cycles, minor stops, and speed losses all reduce Performance.
04
Quality Rate / First Pass Yield (FPY)
Percentage of units produced correctly the first time, without rework or rejection. Target: 99%+ in high-volume operations.
05
Throughput Rate
Units produced per hour or shift. The clearest indicator of production efficiency and scheduling accuracy.
06
Mean Time Between Failures (MTBF)
Average operating time between asset failures. Increasing MTBF is the primary goal of predictive maintenance programs.
07
Mean Time To Repair (MTTR)
Average time to restore a failed asset to operation. Reducing MTTR requires parts availability, trained technicians, and clear procedures.
08
Planned Maintenance Percentage (PMP)
Ratio of planned to total maintenance hours. World-class target: 85%+ planned. Reactive maintenance is 3–5x more expensive.
09
Unplanned Downtime Rate
Hours of unexpected asset failure per period. The single most expensive manufacturing KPI when uncontrolled.
10
Asset Utilisation Rate
Percentage of available capacity actually deployed for production. Low utilisation indicates scheduling or demand alignment issues.
11
Scrap Rate
Percentage of output that cannot be reworked or sold. Every 1% reduction in scrap rate directly improves gross margin.
12
Rework Rate
Units requiring additional processing before meeting spec. Rework consumes capacity without producing saleable output.
13
Customer Defect Rate / DPPM
Defects per part per million reaching the customer. The ultimate quality KPI — and the one that drives warranty claims and returns.
14
Cost of Poor Quality (COPQ)
Total financial impact of quality failures including scrap, rework, warranty, and customer penalties. Typically 5–20% of revenue.
15
On-Time Delivery (OTD)
Percentage of orders delivered on the committed date. The KPI your customers measure you by — and the one that wins or loses contracts.
16
Schedule Attainment
Actual vs. planned production schedule completion. Gaps between schedule and actuals reveal capacity constraints and planning failures.
17
Inventory Turnover
How efficiently raw materials and WIP are converted to finished goods. Low turnover locks capital and signals planning inefficiency.
18
Energy Consumption per Unit
kWh consumed per unit of output. Tracks both cost efficiency and carbon intensity. Critical for ESG reporting and cost management.
19
Carbon Intensity per Unit
CO₂ equivalent per unit produced. Increasingly required for supply chain compliance and sustainability reporting.
20
Overall Labour Effectiveness (OLE)
The human equivalent of OEE — measures how effectively your workforce time is converted to productive output.
Legacy Dashboards vs. iFactory Real-Time Intelligence
The difference between a spreadsheet-based KPI report and a live AI-powered dashboard is not cosmetic — it is the difference between describing a problem and preventing one.
| Metric Area |
Legacy Friction (Old Way) |
Optimised Excellence (iFactory) |
| OEE Visibility |
Calculated weekly from manual shift logs |
Live OEE score updated every 30 seconds per asset |
| Downtime Alerts |
Discovered after the shift ends |
Push alert within 90 seconds of stoppage event |
| Scrap Tracking |
End-of-day tally with no root cause |
Real-time scrap rate with AI-linked failure attribution |
| MTBF / MTTR |
Calculated manually, reported monthly |
Continuously updated from CMMS and sensor data |
| Predictive Alerts |
None — reactive only |
14–21 day advance failure prediction per asset |
| Energy KPIs |
Monthly utility invoice review |
Live kWh-per-unit correlated with asset condition |
| Executive Reporting |
4-hour monthly report preparation |
Auto-generated financial KPI reports on demand |
| Multi-Site View |
Manual data consolidation across sites |
Cross-facility benchmarking in a single dashboard |
Book a Demo → See the Dashboard Difference Live
How iFactory Real-Time OEE Dashboards Transform Plant Performance
⚙
Workflow Intelligence
- Live OEE scores per line, cell, and asset
- Automated downtime categorisation
- AI-generated work orders from condition triggers
- Shift handover reports auto-populated
- Natural language queries on asset health
?
Overhead Reduction
- Eliminate manual KPI compilation — saves 8–12 hrs/week
- Reduce unplanned maintenance spend by 25–35%
- Cut scrap-related material cost by up to 18%
- Remove unnecessary preventive maintenance events
- Auto-generate ESG and compliance documentation
?
Output & Growth
- 23% average OEE improvement in Year 1
- First avoided failure typically within 6–10 weeks
- Scale from 12 pilot assets to 200+ in 10 months
- 10–30x return on total platform investment
- $1.2–3.5M annual savings at full deployment
Dashboard Architecture: What Each Role Needs to See
Effective KPI dashboards are not one-size-fits-all. The metrics a plant floor operator needs in real time differ fundamentally from what a VP of Operations needs for a board presentation. iFactory delivers role-configured views across every level of your organisation.
Operators & Technicians
- Live equipment status per workstation
- Active alert queue with severity ranking
- Current shift OEE vs. target
- Scrap and quality event log in real time
Maintenance Managers
- Asset health scores across all monitored equipment
- Predictive failure timeline per asset
- MTBF / MTTR trend charts
- Planned vs. reactive maintenance ratio
Plant & Operations Directors
- Line-level OEE and throughput summary
- Cost of downtime and scrap in dollar terms
- Schedule attainment and OTD performance
- Energy consumption per unit of output
CFO & Executive Leadership
- Total cost avoidance from predictive alerts
- Asset ROI and TCO by equipment class
- Cross-facility performance benchmarking
- ESG metrics and compliance status
Frequently Asked Questions
How quickly can we get our first KPI dashboard live?
Most facilities achieve their first live OEE dashboard within 4–6 weeks. iFactory begins with 10–20 pilot assets, ingests existing SCADA and historian data, deploys low-cost sensors where gaps exist, and configures role-specific dashboard views — all without disrupting current operations.
Do we need to replace our existing CMMS or ERP?
No. iFactory integrates alongside your existing systems via OPC-UA, MQTT, and REST APIs. Your maintenance team continues using their current CMMS for work execution while the dashboard adds AI-powered predictive intelligence on top. Over time, AI-generated work orders can feed directly into the CMMS automatically.
Which KPIs should we prioritise first?
Start with OEE and Unplanned Downtime Rate. These two metrics have the highest immediate financial impact and are the clearest indicators of where value is being lost. Once those baselines are established, layer in MTBF, MTTR, FPY, and energy metrics as your monitoring coverage expands.
What team resources are required to implement and maintain the dashboards?
Phase 1 typically requires 1–2 maintenance engineers (part-time) for asset selection and sensor placement, plus an IT resource for 2–4 weeks of integration work. iFactory handles model configuration, dashboard setup, and ongoing tuning. Total internal effort in the first phase is typically 80–120 person-hours spread across 4 weeks.
Start Tracking. Start Saving.
Your Plant's 20 KPIs — Live, Real-Time, and Actionable — Within 6 Weeks
iFactory's Real-Time OEE Dashboards give operators, maintenance managers, and executives the metrics they need — at the speed they need them. No manual reports. No delayed decisions. No invisible losses.
4–6 wk
To first live dashboard
23%
Average OEE gain Year 1
$3.5M
Annual savings potential
10–30x
Return on investment