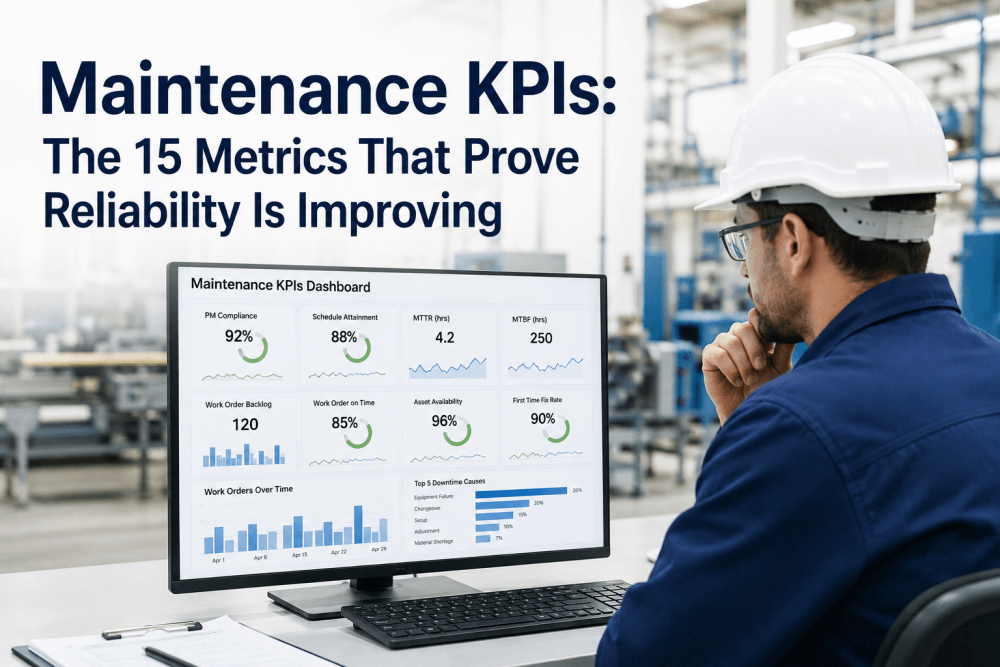
Top 7 Manufacturing KPIs Every Plant Manager Must Track in 2026
By Riley Quinn on February 13, 2026
What separates top-performing plants from struggling ones? Data shows that manufacturers tracking the right KPIs reduce downtime by up to 50% and boost productivity by 25%. Yet most plant managers either track too many metrics or focus on the wrong ones entirely. In 2026, with unplanned downtime costing Fortune 500 companies $1.4 trillion annually, knowing which 7 KPIs truly matter isn't optional—it is survival.
$1.4T
Annual Downtime Cost (Fortune 500)
800 hrs
Avg. Downtime Per Plant/Year
11%
Revenue Lost to Downtime
50%
Downtime Reduced with KPI Tracking
The 7 Manufacturing KPIs That Actually Matter
After analyzing data from thousands of manufacturing facilities, these are the seven metrics that consistently separate world-class operations from average performers. Track these—and only these—to avoid data overload while capturing what truly drives performance.
01
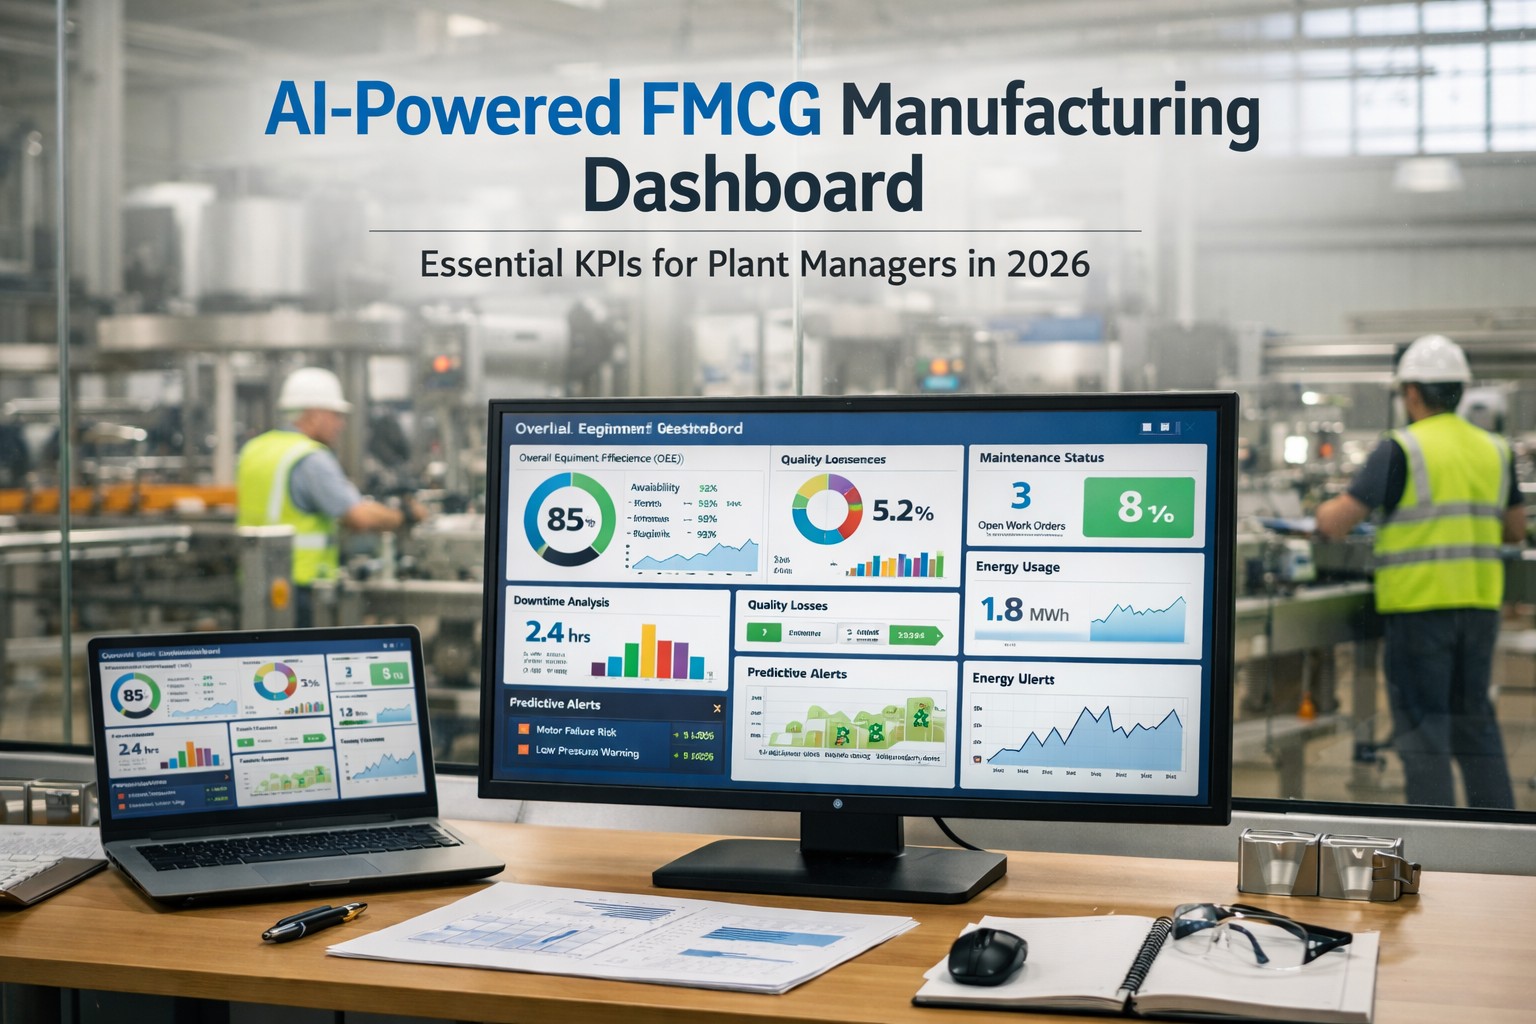
OEE (Overall Equipment Effectiveness)
The Gold Standard
Formula:Availability × Performance × Quality
OEE is the single most important metric for measuring manufacturing productivity. It tells you how much "good product" you're making versus your theoretical maximum capacity.
Measures repair speed. Lower MTTR = faster recovery = less production loss.
Target:2-4 hoursLower is better
04
Downtime Rate
Planned vs Unplanned
(Downtime ÷ Scheduled Time) × 100
World-class plants maintain 80% planned, 20% unplanned ratio. Most run 40/60.
Target:<10%Lower is better
05
Maintenance Cost
As % of Replacement Value
(Annual Cost ÷ Asset Value) × 100
Helps decide repair vs replace. Above 6% typically means replacement is smarter.
Target:2-5%Lower is better
06
First Pass Yield
Quality Without Rework
(Good Units ÷ Total Units) × 100
Measures quality efficiency. Low FPY means wasted time, materials, and labor.
Target:>95%Higher is better
07
Schedule Compliance
PM Task Completion Rate
(Completed PMs ÷ Scheduled PMs) × 100
Leading indicator of future reliability. Low compliance = future breakdowns.
Target:>90%Higher is better
Want to see how your plant compares to these benchmarks? Schedule a free KPI assessment with our manufacturing specialists.
How These KPIs Work Together
These seven metrics don't exist in isolation—they form an interconnected system where improving one often impacts others. Understanding these relationships is key to prioritizing your improvement efforts.
The KPI Connection Map
Leading Indicators
Predict future performance
Schedule Compliance
Maintenance Cost %
Core Metrics
Equipment health
MTBF
MTTR
Downtime Rate
Business Outcomes
What leadership sees
OEE
First Pass Yield
Stop Tracking KPIs in Spreadsheets
iFactory automatically calculates OEE, MTBF, MTTR, and all 7 critical KPIs in real-time. No manual data entry. No formula errors.
Not sure where to start improving? Contact our support team for a prioritized action plan based on your current metrics.
Why Manual KPI Tracking Fails
Most plants still track KPIs using spreadsheets, whiteboards, or disconnected systems. Here's why that approach is costing you money and accuracy.
Manual Tracking
Data entry delays of 24-48 hours
Formula errors go unnoticed
Can't catch issues in real-time
Hours spent on data gathering
VS
Automated KPI Dashboard
Real-time data, zero lag
Auto-calculated, always accurate
Instant alerts when KPIs drop
Focus on analysis, not data entry
Ready to automate your KPI tracking? Book a demo to see real-time dashboards in action.
Expert Insight
"Start with the Big 5: MTBF, MTTR, Planned Maintenance %, Schedule Compliance, and OEE. These give the biggest ROI for effort invested. Track no more than 3-5 KPIs at once to maintain focus and drive real improvement."
— Industry Best Practice (Gartner, McKinsey Research)
Get Your KPIs Under Control Today
Join plant managers across the USA, UK, Germany, and Australia who track all 7 KPIs automatically with iFactory's AI-powered dashboard.
OEE (Overall Equipment Effectiveness) is widely considered the gold standard. It combines availability, performance, and quality into one metric that shows how much good product you're making versus your theoretical maximum. World-class OEE is 85% or higher.
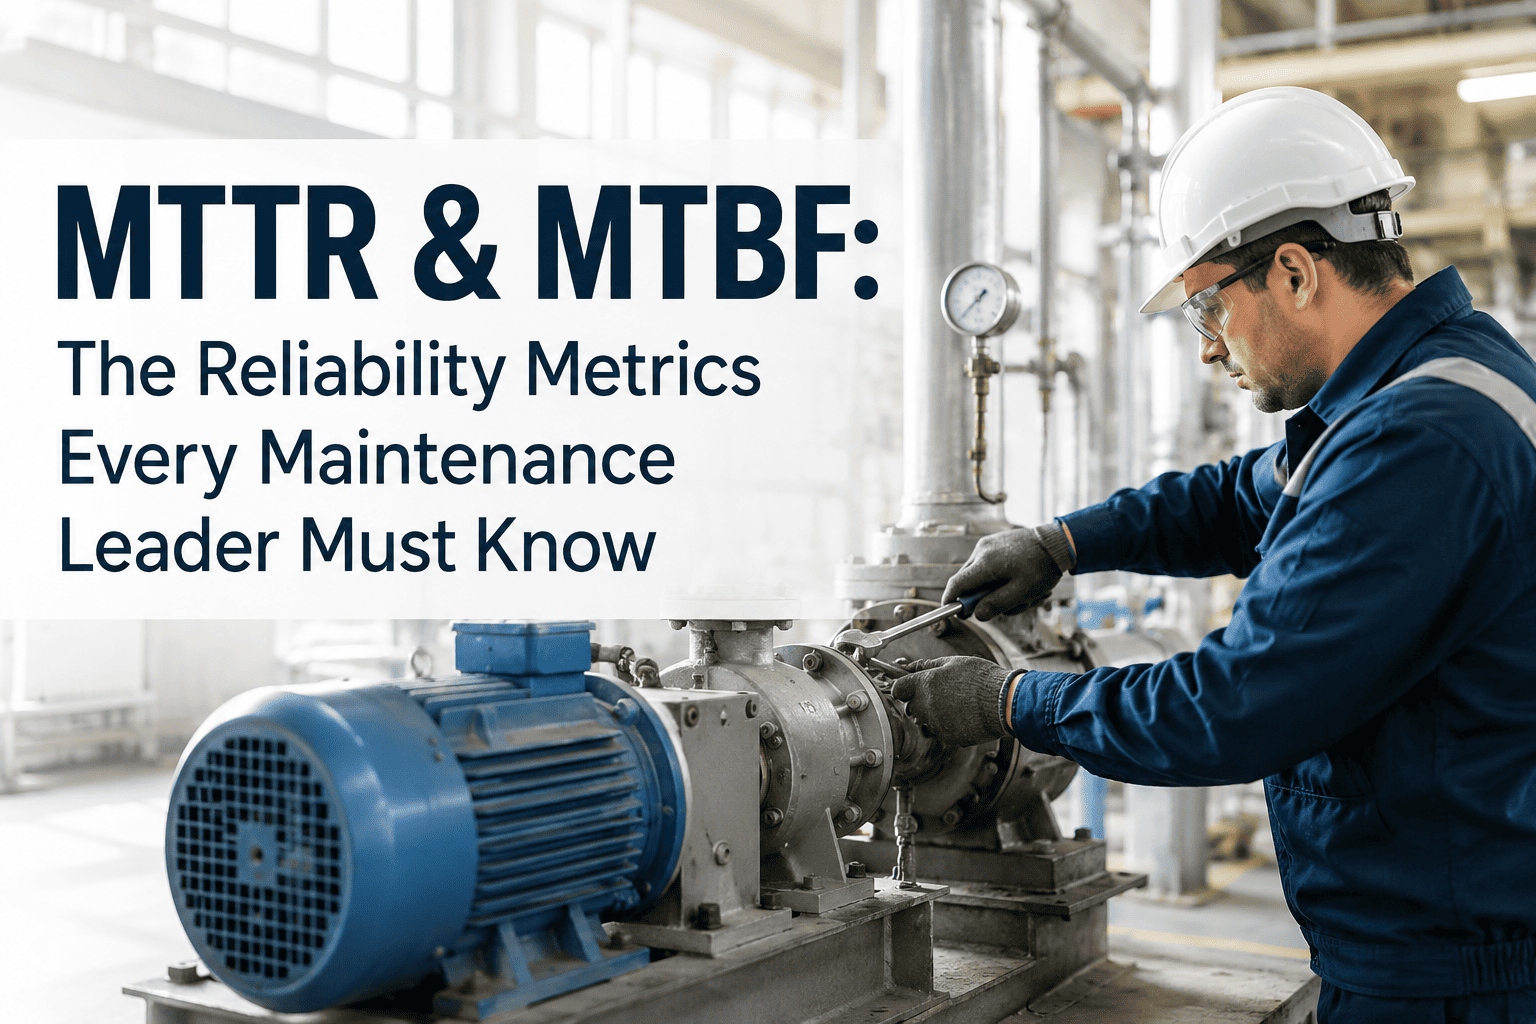
What's the difference between MTBF and MTTR?
MTBF (Mean Time Between Failures) measures reliability—how long equipment runs before breaking down. Higher is better. MTTR (Mean Time To Repair) measures maintainability—how fast you fix it when it breaks. Lower is better. Together, they determine equipment availability.
How many KPIs should a plant manager track?
Best practice is 3-5 KPIs at a time. Tracking too many leads to data overload and unfocused improvement efforts. Start with OEE, MTBF, MTTR, and PM Compliance—these give the biggest ROI for effort invested.
What's a good planned vs unplanned maintenance ratio?
World-class plants maintain an 80/20 ratio (80% planned, 20% unplanned). The industry average is closer to 40/60, meaning most plants spend more time firefighting than preventing problems.
How often should KPIs be reviewed?
Critical KPIs like OEE and downtime should be monitored daily or in real-time. Weekly reviews work for MTBF and schedule compliance. Monthly reviews are appropriate for maintenance cost metrics and trend analysis.