Every hour of unplanned downtime costs manufacturers between $260,000 and $2 million — yet most maintenance teams are still reacting to failures rather than predicting them. If your MTTR is climbing and your MTBF is shrinking, your facility is bleeding revenue through a wound you can measure but have not yet closed. This guide delivers the formulas, industry benchmarks and actionable strategies to reverse both metrics using AI-powered predictive maintenance.
iFactory Reliability Intelligence
MTTR & MTBF: The Reliability Metrics Every Maintenance Leader Must Know
Definitions, formulas, industry benchmarks, and a proven path from reactive maintenance to predictive excellence — with measurable ROI at every step.
Book a Free Strategy Session
What Is MTBF? Definition and Formula
Mean Time Between Failures (MTBF) measures how long a repairable asset operates on average between unplanned failures. A rising MTBF signals improving asset health. A declining MTBF is an early warning of systemic maintenance debt accumulating across your facility.
What Is MTTR? Definition and Formula
Mean Time To Repair (MTTR) measures the average time to restore an asset to full operation after a failure — from detection through return-to-service validation. Facilities with mature predictive maintenance programmes achieve MTTR reductions of 30–50% by staging parts and procedures before a failure, not scrambling after one.
MTBF + MTTR = Asset Availability
Together, MTBF and MTTR determine asset availability — the percentage of scheduled time an asset is capable of producing output. A 1% improvement in availability on a line running $500K of throughput per day is worth $1.8M annually.
See how iFactory customers improve both metrics within 6–10 weeks of deployment.
Book a Demo
Industry Benchmarks
Food & Beverage
MTBF Target800–1,200 hrs
MTTR Target< 2.5 hrs
Availability97–99%
Power Generation
MTBF Target2,000–4,000 hrs
MTTR Target< 6 hrs
Availability98–99.5%
Discrete Manufacturing
MTBF Target500–900 hrs
MTTR Target< 3 hrs
Availability95–98%
Oil & Gas / Process
MTBF Target3,000–6,000 hrs
MTTR Target< 8 hrs
Availability98–99.9%
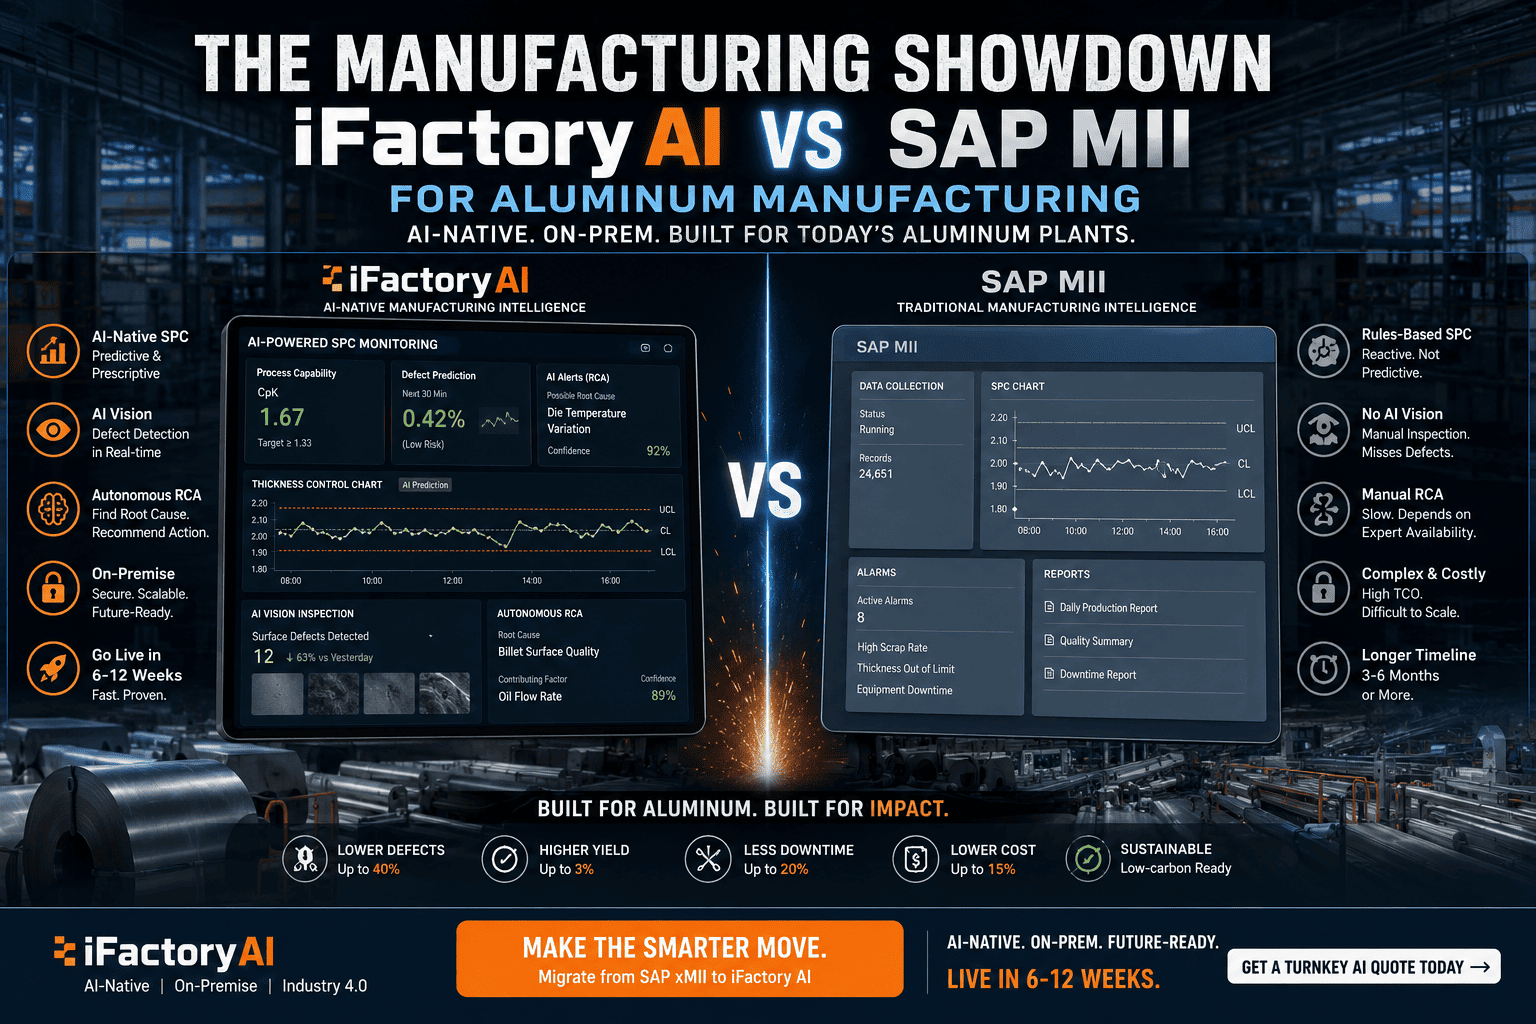
Legacy Friction vs Optimised Excellence
| Dimension | Legacy Friction | iFactory Excellence |
| Failure Detection |
Operator notices fault after failure |
AI flags anomaly 14–21 days before failure |
| MTBF Visibility |
Calculated monthly from spreadsheets |
Real-time MTBF per asset with trend projections |
| MTTR Driver |
Parts hunted reactively after breakdown |
Auto-generated work orders with parts pre-staged |
| Maintenance Planning |
Fixed calendar regardless of asset condition |
Condition-based scheduling via Remaining Useful Life |
| Root Cause Analysis |
Post-mortem of incomplete data; insight lost |
Twin model + AI surfaces contributing factors instantly |
| KPI Reporting |
Manual monthly decks; always historical |
Live MTBF, MTTR, and cost impact dashboards |
Five Strategies to Improve MTBF
01
Deploy Continuous Vibration Monitoring
Vibration is the earliest signal of bearing wear, imbalance, and misalignment — the three leading causes of rotating equipment failure. Wireless sensors at $50–100 per point extend MTBF 40–60% on motors, pumps, and fans by detecting degradation months before threshold is crossed.
02
Build AI Baseline Models Per Asset
Each asset has a unique operating signature. iFactory's LSTM models detect anomalies that fixed thresholds miss entirely, producing validated alerts within 4–6 weeks of deployment — without requiring historical failure data to start learning.
03
Shift to Condition-Based Lubrication
Over-lubrication causes as many bearing failures as under-lubrication. Correlating schedules with real-time thermal and vibration data eliminates both failure modes. Facilities making this shift report MTBF improvements of 20–35% on rotating assets within the first year.
04
Implement Remaining Useful Life Projections
RUL modelling converts raw sensor data into a countdown — showing planners exactly when an asset is projected to fail. Maintenance is then scheduled at the optimal window: late enough to maximise asset life, early enough to prevent unplanned downtime.
05
Segment MTBF by Asset Class, Not Facility Average
A facility averaging 650-hour MTBF may have a pump class running at 180 hours — invisible in aggregate reporting. Per-asset analytics expose exactly where investment delivers the highest reliability return.
Three Levers to Reduce MTTR
⚡
Pre-Staged Work Orders
AI-generated work orders from condition alerts include correct parts, torque specs, and safety procedures — eliminating the search-and-gather phase that accounts for 35–45% of average MTTR.
?
Predictive Parts Staging
When RUL projections forecast failure 14 days out, replacement parts are ordered, received, and kitted before the work order is even created. Emergency procurement markups disappear entirely.
?
Digital Twin Root Cause Acceleration
The twin model captures the full operational context leading to failure. Technicians arrive with a diagnosis, not a symptom. Diagnostic time typically drops 60–70% on first-response incidents.
The Business Case
MTBF +25%
Reliability Improvement
On a line with $400K/day throughput and 8 failures/year, eliminating 2 unplanned events saves $800K–$1.6M annually in avoided downtime and emergency labour costs.
MTTR −40%
Recovery Speed Gain
Reducing MTTR from 5 hrs to 3 hrs across 10 critical assets with 4 failures each per year recovers 80 hours of unplanned downtime — equivalent to 3+ full production shifts annually.
95%+
Positive ROI Rate
95% of organisations deploying predictive maintenance with proper sensor infrastructure and AI analytics report positive ROI within 12–18 months of first deployment.
Frequently Asked Questions
What is a good MTBF for industrial motors?
Healthy MTBF ranges from 500 to 1,500 hours depending on duty cycle, environment, and load profile. With continuous vibration monitoring and condition-based maintenance, world-class facilities achieve MTBF above 2,000 hours on identical equipment classes.
Does MTTR include logistics and parts procurement time?
Yes — MTTR should capture total downtime from failure detection to verified return-to-service. Many facilities undercount MTTR by starting the clock at physical repair start rather than failure detection, artificially deflating the metric and masking the true cost of reactive maintenance.
How quickly can predictive maintenance improve MTBF and MTTR?
The first avoided failure or eliminated unnecessary maintenance event typically occurs within 6–10 weeks. MTTR improvements are often faster — pre-staged work orders and digital root cause acceleration deliver measurable gains from the very first predicted intervention.
iFactory Predictive Maintenance
Stop Measuring Failures. Start Preventing Them.
iFactory's AI digital twin platform gives maintenance leaders real-time MTBF and MTTR dashboards, predictive failure alerts 14–21 days in advance, and auto-generated work orders that cut recovery time by up to 40%. First measurable value in 4–6 weeks. Full ROI in 12–18 months.
4–6 wk
Time to first value
10–30x
Return on investment
$3.5M
Annual savings potential