Every FMCG plant manager has the same 6 AM ritual: scanning overnight logs, calling supervisors, piecing together what went wrong on the night shift. By the time you have a clear picture, the morning shift is already running — and the decisions you make in the next 30 minutes will determine whether your plant hits targets or falls behind. In 2026, the plants pulling ahead aren't the ones with more people or newer equipment. They're the ones where a single AI-powered dashboard replaces that frantic morning scramble with real-time clarity.
Manufacturing Intelligence for FMCG
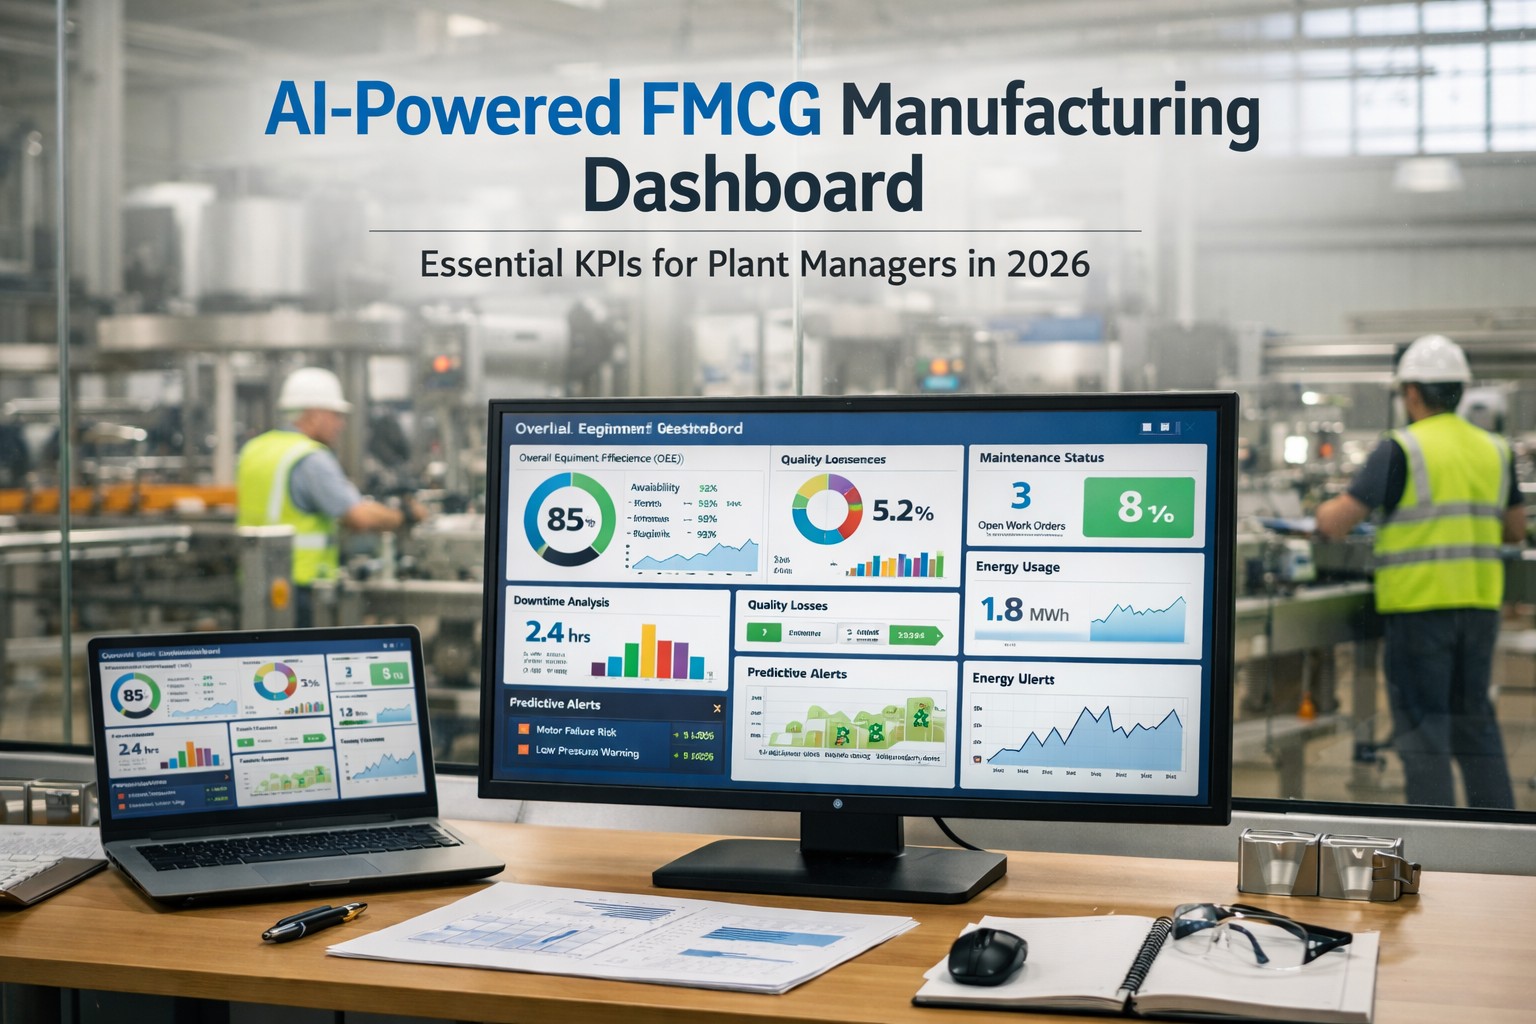
The AI Dashboard Revolution
From overnight logs to real-time plant intelligence
$36K
Hourly Downtime Cost
That gap between current OEE and world-class performance is where the real opportunity lives. FMCG plants using AI-powered dashboards are closing it — achieving 15-25% OEE improvements, 50% less downtime, and 40% lower maintenance costs. The plants that act first will dominate. The rest will keep scanning overnight logs.
The Market Explosion Nobody Can Ignore
The numbers tell a story every FMCG plant manager needs to hear. AI in manufacturing isn't a niche technology anymore — it's the fastest-growing segment in industrial tech, and FMCG operations stand to gain the most from intelligent dashboards.
Growing at 35.3% CAGR — with 40%+ of manufacturers adopting AI scheduling tools by 2026
According to IDC's 2026 Manufacturing FutureScape, over 40% of manufacturers with production scheduling systems will upgrade to AI-driven capabilities this year alone. For FMCG plants running dozens of SKU changeovers per shift on razor-thin margins, intelligent dashboards aren't a luxury — they're the difference between hitting targets and falling behind.
Wondering where AI fits into your FMCG production line? Book a free consultation with our manufacturing AI specialists to identify your highest-ROI starting point.
Why Traditional Dashboards Fail FMCG Plants
Most manufacturing dashboards were built for process industries with long, stable production runs. FMCG is a different animal entirely. You're running dozens of SKU changeovers per shift, managing perishable raw materials, dealing with strict food safety compliance, and operating on razor-thin margins where a single percentage point of waste can erase profitability. A generic dashboard showing yesterday's numbers doesn't cut it anymore.
Historical data only — always looking backward
Old
Predictive intelligence — problems flagged before they happen
AI
Siloed views — maintenance, quality, production disconnected
Old
Unified view — every KPI connected in one interface
AI
Manual threshold alerts — someone has to notice the problem
Old
AI-generated alerts — anomalies detected automatically
AI
Static reports — exported once, outdated immediately
Old
Live decision support — real-time, always current
AI
An AI-powered FMCG dashboard doesn't just display data — it connects production, maintenance, quality, and energy into a single intelligence layer that tells you what's happening, why, and what to do next.
The 6 Essential KPIs Every FMCG Dashboard Must Track
Not all KPIs are created equal. After analyzing performance data across FMCG operations, these six metrics consistently separate high-performing plants from the rest. Here's what your dashboard needs — and the benchmarks that matter.
01
Overall Equipment Effectiveness (OEE)
The single most important metric for any FMCG plant. OEE combines availability, performance, and quality into one score that reveals your true productive capacity. Most FMCG plants operate between 55-68% OEE, meaning 32-45% of production capacity is being lost to hidden inefficiencies. Only ~6% of manufacturers globally achieve 85%+ OEE consistently.
02
Downtime Analysis & Cost Tracking
FMCG downtime costs between $36,000 and $200,000 per hour depending on line value and product type. AI dashboards categorize every minute of downtime by cause — changeover, breakdown, material shortage, cleaning — and calculate the real financial impact automatically.
03
Quality Loss & First Pass Yield
In FMCG, a single recall averages $10 million in direct costs. First Pass Yield tracks the percentage of products made correctly without rework. AI vision systems now inspect at 600+ units per minute with 99.99% accuracy, feeding data directly into your dashboard.
04
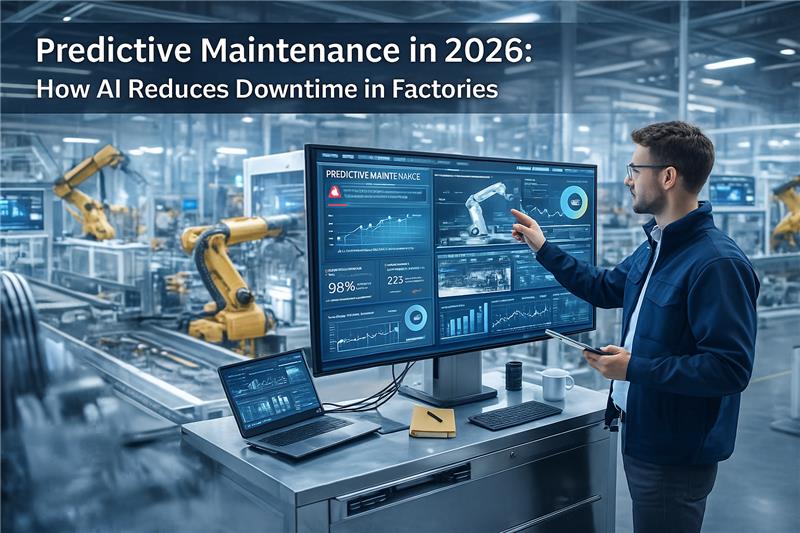
Predictive Maintenance Alerts
AI analyzes vibration, temperature, and current data to predict equipment failures 5-14 days in advance. The dashboard surfaces machine health scores, upcoming maintenance windows, and auto-generated work orders — turning reactive firefighting into planned interventions.
5-14 days
Advance Warning
40%
Spare Parts Reduction
05
Energy Consumption Per Unit
Energy typically represents 15-30% of FMCG production costs. AI dashboards correlate energy usage with production output in real time, identifying energy waste during idle periods, suboptimal machine settings, and peak-rate scheduling opportunities.
10-20%
energy savings achieved with AI-powered optimization
06
Changeover Time & SMED Metrics
FMCG plants run 10-30+ SKU changeovers daily. Setup and changeover account for 28.7% of all efficiency losses. Your dashboard should track actual vs. target changeover times per line and SKU combination, highlighting which transitions consistently overrun.
28.7%
of all efficiency losses caused by setup and changeover time
See these KPIs live in your plant — ifactory's AI-powered dashboard unifies all six KPIs into a single real-time view with predictive alerts and auto-generated work orders. Get in touch with our FMCG specialists to see these KPIs live in your plant.
How AI Transforms Raw Data Into Plant Decisions
The difference between a display and a decision engine is intelligence. Here's how an AI layer converts the 2TB+ of daily production data your plant generates into actions that protect margins and prevent failures.
Stage 1
Ingest
IoT sensors, PLCs, SCADA, and MES systems feed real-time data streams — vibration signatures, temperature curves, energy draws, quality camera outputs — into a unified data layer.
Stage 2
Correlate
AI identifies patterns humans miss: a subtle rise in motor current on Line 3 always precedes a bearing failure 9 days later. A specific raw material batch correlates with 3x higher reject rates.
Stage 3
Predict
Machine learning models forecast equipment health, demand patterns, and quality risks — giving you 5-14 days of advance warning instead of reacting to alarms.
Stage 4
Act
The CMMS automatically generates work orders, adjusts maintenance schedules, and pushes prioritized alerts to the right people at the right time — no manual intervention needed.
The Hidden Capacity Gap: What Your Plant Is Really Losing
Most FMCG facilities operate with 27-47% hidden capacity losses they haven't yet quantified. Here's where the losses typically hide — and what AI visibility reveals.
Equipment Failures
Unplanned breakdowns and unexpected maintenance. The single largest source of production loss in FMCG plants. AI predictive alerts reduce this by up to 50%.
34.2% of all losses
Changeover & Setup
SKU transitions and tooling changes dominate FMCG operations with 10-30+ changeovers daily. Digital twin simulations can cut changeover time by 40%.
28.7% of all losses
Material Shortages
Supply chain gaps and inventory stockouts halt production unexpectedly. AI demand forecasting improves inventory accuracy by 20-50%.
18.4% of all losses
Small Stops & Quality
Minor stoppages and rework that are often invisible without automated tracking at the machine level. The silent killer of OEE.
18.7% of all losses
Energy Waste
Energy represents 15-30% of FMCG production costs. Idle machines, suboptimal settings, and peak-rate usage drain margins. AI optimization saves 10-20%.
15-30% of production costs
Compliance Gaps
Food safety documentation failures, missed inspections, and audit trail gaps create regulatory risk and potential production holds.
$10M avg recall cost
The ROI Reality: What AI Dashboards Actually Deliver
The financial case for AI-powered dashboards in FMCG isn't theoretical anymore. These are verified results from plants that have moved past pilots into full production deployment.
15-25%
OEE improvement commonly reported across FMCG facilities using AI-powered dashboards
Industry Benchmark
50%
Reduction in unplanned downtime reported by manufacturers using AI-powered automation
Siemens Research
60%
Faster root cause analysis with AI correlation across production, maintenance, and quality data
McKinsey 2025
40%
Lower maintenance costs through predictive maintenance replacing reactive and scheduled approaches
Deloitte Research
The FMCG plants seeing the fastest returns share three traits: they start with high-impact use cases like predictive maintenance and OEE tracking, they invest in unified data infrastructure across production lines, and they scale methodically rather than trying to transform everything at once.
What to Look for in an FMCG Dashboard Platform
Not every dashboard platform is built for FMCG complexity. When evaluating solutions, these capabilities separate platforms that deliver ROI from those that become expensive wallpaper.
01
Real-Time OEE Decomposition
Break OEE into availability, performance, and quality at the line, shift, and SKU level — not just a plant-wide average. Your dashboard should show you exactly where capacity is being lost, on which line, during which shift.
02
Integrated CMMS
Dashboard alerts should auto-generate work orders with the right priority, assigned technician, and parts list — no manual handoff. The gap between detecting a problem and acting on it should be zero.
03
Predictive Maintenance AI
Machine learning models trained on your equipment data, not generic algorithms. Asset health scores that improve over time as the system learns your specific failure patterns and operating conditions.
04
Mobile-First Access
Plant managers need dashboard access on the floor, not chained to a desktop. Push notifications for critical alerts ensure the right people know about problems the moment they're detected.
05
Cross-Plant Benchmarking
Compare performance across facilities, lines, and shifts. Identify best practices from your highest-performing lines and replicate them systematically across your entire operation.
06
Compliance & Audit Trail
FMCG requires food safety documentation. Your dashboard should automatically log actions, inspections, and corrective measures — building audit-ready compliance records without manual paperwork.
Your 90-Day Path from Pilot to Production
The FMCG plants winning with AI dashboards didn't try to boil the ocean. They followed a focused, phased approach that proves value quickly and scales intelligently.
Weeks 1-4
Targeted Pilot
Pick one high-impact use case — predictive maintenance on critical machines or OEE tracking on your highest-value line. Define 3 clear KPIs. Connect existing sensor data. Prove the concept with real results, not PowerPoints.
Weeks 5-8
Validate & Build the Case
Measure actual cost savings, downtime reduction, and quality improvements. Document everything. Build the business case for broader deployment with real numbers your CFO will believe.
Month 2-3
Production Line Deployment
Expand to full production lines. Integrate with your MES, ERP, and CMMS systems. Train your operators on AI-driven insights. This is where pilot becomes permanent value.
Month 4+
Scale Across the Enterprise
Roll out across facilities. Add use cases — quality inspection, energy optimization, compliance automation. Build continuous improvement loops where AI insights feed back into operations, creating a plant that literally gets smarter every day.
Frequently Asked Questions
What makes an AI dashboard different from a regular manufacturing dashboard?
A traditional dashboard displays historical data — what happened yesterday. An AI-powered dashboard adds predictive intelligence: it detects anomaly patterns in real time, forecasts equipment failures days in advance, automatically correlates data across production, maintenance, quality, and energy systems, and generates recommended actions. Instead of waiting for you to notice a problem, the AI flags it before it becomes one.
What OEE should my FMCG plant target?
The global manufacturing average is 55-60%. FMCG plants with food safety and frequent changeover constraints typically average 60-68%. World-class FMCG operations achieve 75-85%, though only about 6% of manufacturers globally sustain 85%+. Focus on improving from your current baseline by 5 points per year rather than chasing a universal number.
How quickly can AI predictive maintenance show ROI?
Most FMCG plants see measurable results within 60-90 days of implementation. The first prevented breakdown typically covers the platform cost for the entire year. Broad adoption of predictive maintenance strategies can save manufacturers up to 40% on maintenance costs and reduce unplanned downtime by 50%, according to industry research from Siemens.
Does this work with our existing equipment and sensors?
Yes. Modern AI CMMS platforms like ifactory integrate with existing SCADA, PLC, MES, and IoT sensor infrastructure through standard industrial protocols. You don't need to replace your equipment — the AI layer sits on top of your existing data sources and starts finding patterns immediately.
How does ifactory help FMCG plants specifically?
ifactory's Manufacturing 6.0 platform is built for high-changeover, compliance-heavy FMCG environments. It connects equipment sensor data, quality inspection systems, and predictive analytics into one intelligent operations layer. The platform auto-generates work orders from AI alerts, tracks OEE at the line and SKU level, manages food safety compliance documentation, and provides mobile-first dashboards for plant floor access.
How much does AI in FMCG manufacturing cost to implement?
Implementation costs vary based on scope and complexity. A focused pilot on predictive maintenance or OEE tracking can start showing results within 4-8 weeks with moderate investment. Cloud-based AI platforms have significantly reduced upfront costs compared to custom-built solutions. The key metric is ROI — FMCG plants consistently report 250-300% returns on predictive maintenance within two years, making the investment self-funding in most cases.
Will AI replace manufacturing workers?
The evidence points to augmentation rather than replacement. According to Deloitte, more than 81% of task hours in manufacturing are expected to remain human-driven. AI handles repetitive, data-intensive tasks while humans focus on creativity, problem-solving, and complex decision-making. The most successful FMCG plants are building hybrid human-plus-AI models where technology amplifies human capabilities rather than eliminating roles.
What is the market size for AI in manufacturing?
The global AI in manufacturing market is projected to grow from $34 billion in 2025 to $155 billion by 2030, at a compound annual growth rate of 35.3%. The broader smart factory market is valued at approximately $374 billion in 2026. Investment in AI specifically for manufacturing operations is expected to reach $16.7 billion in 2026 alone, with 98% of manufacturers actively exploring or considering AI-driven automation.
The Bottom Line
The manufacturing plants winning in 2026 aren't the ones with the biggest budgets — they're the ones with the best visibility. An AI-powered dashboard doesn't just show you numbers. It connects every signal from every machine, every shift, and every product into a decision engine that helps you act faster, waste less, and produce more. The data is already flowing through your plant. The question is whether you're using it — or losing it.
Ready to See Your Plant's Hidden Capacity?
ifactory helps FMCG manufacturers implement AI-powered dashboards with predictive maintenance, real-time OEE tracking, and automated work orders — starting with quick wins that deliver results in weeks. See what's possible for your operation.