The third-shift team lead at a midwestern automotive plant watches the line-speed dashboard flicker red for the fourth time this week. A conveyor jam upstream — caused by a worn bearing that maintenance flagged two months ago — has idled 14 stations. Operators stand by their machines, waiting. The ERP system won't register the downtime for another 90 minutes. By then, 47 units will be scrap, and the overtime cost to catch up will eat the week's margin. The team lead knows the waste is sitting right in front of him — motion, waiting, defects — but he has no tool to see it, measure it, or stop it before it compounds into a six-figure quarterly loss.
Stop TIMWOODS Blind Spots: Real-Time AI That Finds & Eliminates the Eight Wastes Before They Cost You a Quarter
iFactory connects directly to your plant-floor data sources — PLCs, SCADA, MES, sensors — and surfaces every instance of defect, overproduction, waiting, non-utilized talent, transportation, inventory, motion, and excess processing. No spreadsheets. No Lean Six Sigma black belts required. Just a live, AI-powered waste map that turns Toyota Production System theory into daily operational habit.
Why TIMWOODS Costs You More Than You Think
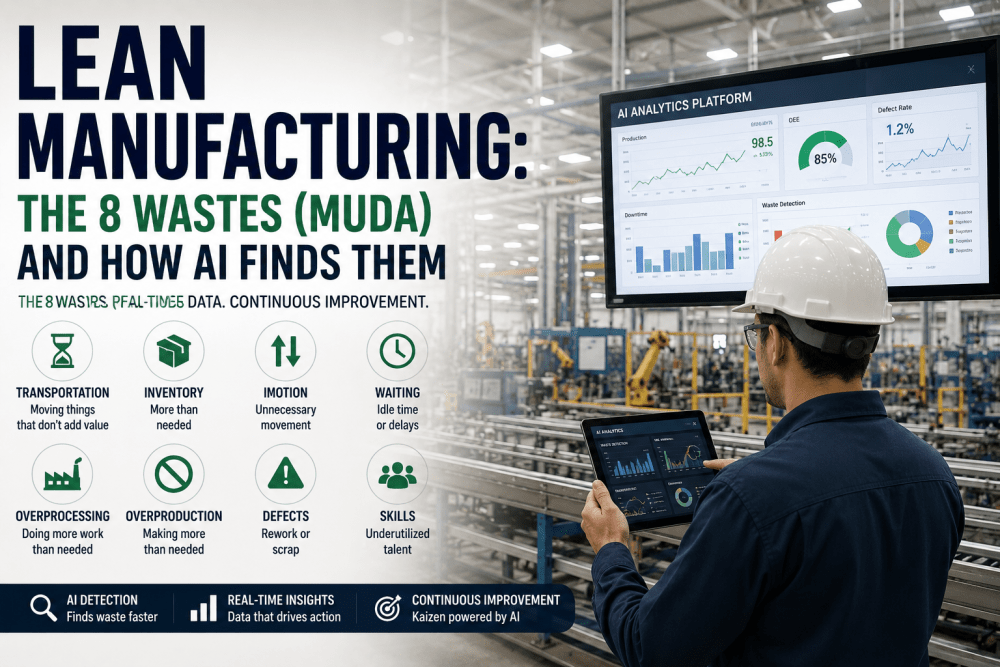
Every plant manager knows the eight wastes by heart: Transport, Inventory, Motion, Waiting, Overproduction, Overprocessing, Defects, and Skills (non-utilized talent). But knowing the list and seeing it in real time are two different things. Most plants discover waste only during monthly kaizen events or after a quality escape reaches the customer. By then, the damage is done — and the root cause is buried in a 200-row spreadsheet. Here's how each waste quietly erodes your OEE, your margin, and your team's focus.
Waiting — The Silent Line Killer
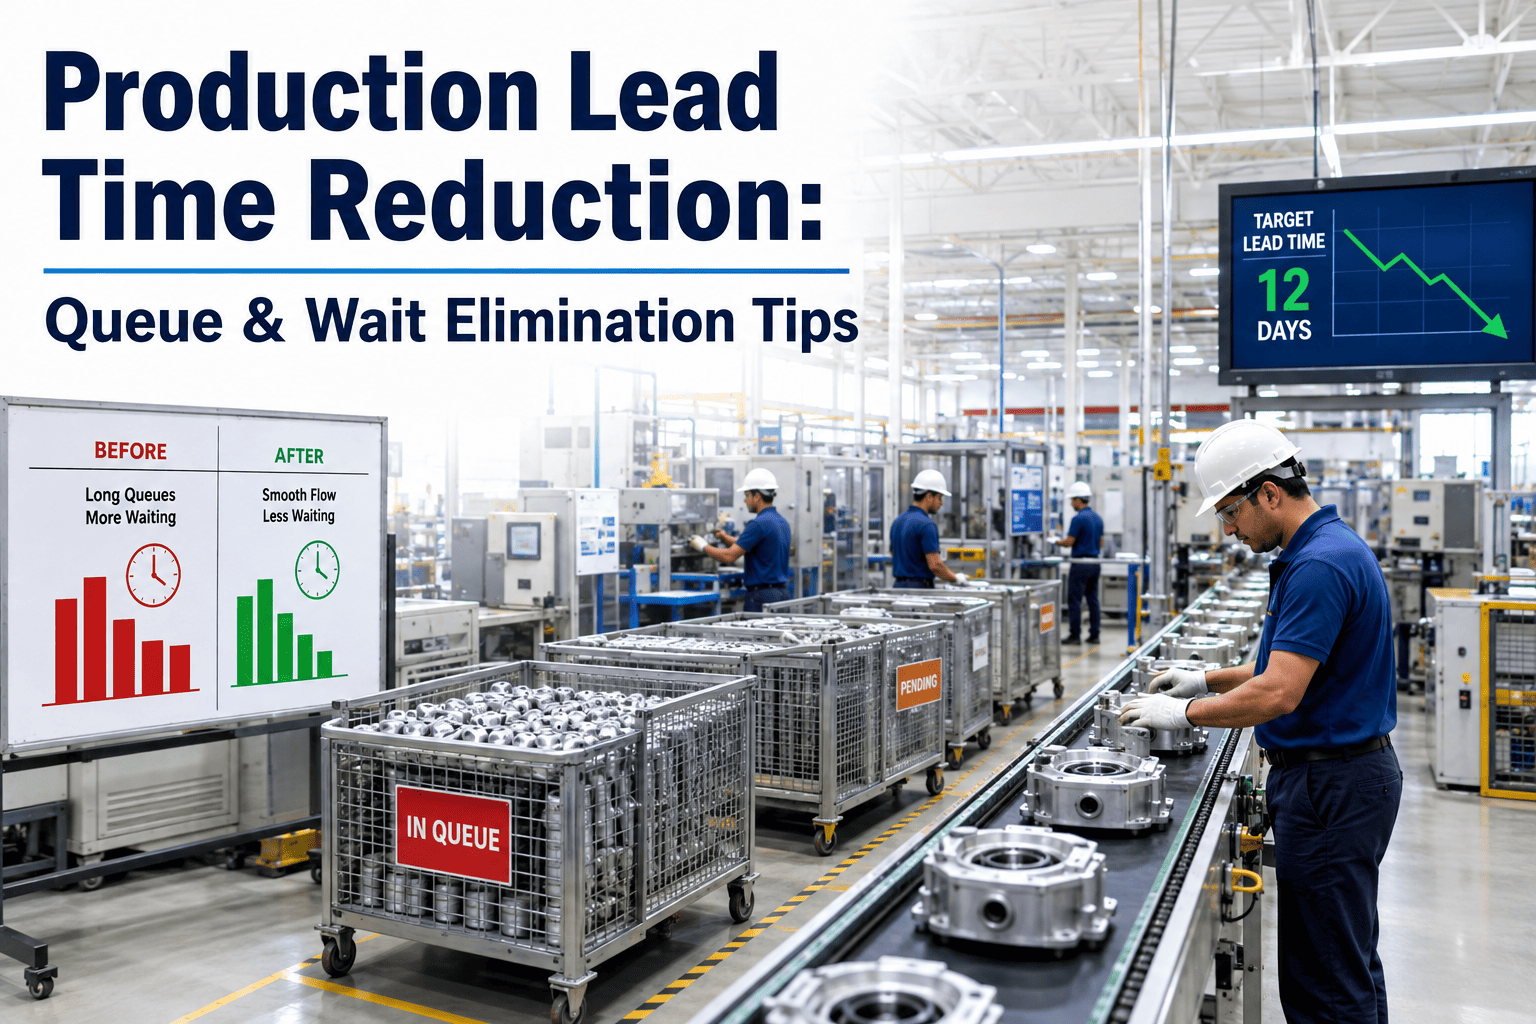
Every minute a machine sits idle waiting for material, a setup change, or a maintenance response, your effective throughput drops. In a typical assembly plant, unplanned waiting accounts for 12–18% of available production time. At 500 units per hour and $40 margin per unit, that's $2,400 lost every ten minutes of idle time — compounded across every shift, every day.
Defects — The Ripple Cost of Quality Escapes
One defect that reaches final inspection doesn't just cost the raw material and labor. It triggers rework routing, expedited shipping, customer returns, and — worst case — a containment sort that halts production. The cost of a single defect is 10x the first-pass yield loss when you factor in inspection hours, scrap disposal, and administrative overhead. In high-volume plants, a 1% defect rate can erase $500,000 in annual profit.
Overproduction — The Waste That Hides All Others
Building more than the customer orders feels productive, but it's the most dangerous waste. It consumes raw material, occupies floor space, increases WIP inventory, and masks downstream bottlenecks. Overproduction is often invisible because ERP systems show "on-time delivery" as green while the warehouse fills with unsold goods. The carrying cost alone — 20–30% of inventory value annually — is a direct drain on working capital.
Motion & Transportation — The Hidden Efficiency Tax
Operators walking 50 feet to retrieve a tool, forklifts crisscrossing the floor to move partial pallets, parts staged three zones away from the point of use. These micro-movements add up to 20–35% of an operator's shift being non-value-added motion. In a plant with 100 operators earning $22/hour, that's $1,300 per shift in wasted labor — $338,000 per year — that no one tracks because it's "just how the line works."
Non-Utilized Talent — The Waste You Can't Afford to Ignore
Your most expensive asset — your people's problem-solving ability — is systematically underused. Operators who spot recurring jams, quality drift, or ergonomic hazards have no mechanism to escalate and resolve. Each untapped improvement idea from a floor operator is a missed opportunity worth $5,000–$20,000 annually. Multiply that by 200 operators, and you're leaving millions on the table because your kaizen system is paper-based and slow.
You can't eliminate what you can't see. iFactory turns every TIMWOODS category into a live, measurable KPI — updated every second. Book a 30-min walkthrough and we'll show you your plant's waste map in one session.
How iFactory Makes TIMWOODS Actionable — In Four Steps
Traditional lean tools rely on manual observation, stopwatches, and post-shift spreadsheets. iFactory automates the entire waste-detection loop. Connect your data sources, and within 6–12 weeks, every instance of the eight wastes is surfaced, categorized, and prioritized for action — without a single new sensor or a cloud data egress.
Connect & Ingest
iFactory's on-premise appliance plugs directly into your plant network — PLCs, SCADA, MES, CMMS, and operator HMI logs. No data leaves the facility. No cloud dependency. The system begins ingesting cycle times, fault codes, throughput rates, quality readings, and operator interaction data within hours of installation.
Classify Every Waste Event
Our AI models — trained on thousands of manufacturing lines — automatically tag each interruption, delay, or quality deviation to the correct TIMWOODS category. A conveyor stop longer than 3 minutes? Waiting. A machine running above target rate for 20 minutes with no downstream demand? Overproduction. An operator walking to a tool crib 30 times per shift? Motion. The taxonomy is built in.
Prioritize by Financial Impact
Every waste event is assigned a real-time cost — in dollars per minute, per hour, per shift. The dashboard ranks waste types by total financial drag, so your lean team tackles the biggest leak first. No more kaizen events that chase low-impact defects while waiting waste drains $40,000 a month.
Drive Daily Kaizen with Live Feedback
The system pushes waste alerts to operator tablets, team lead dashboards, and shift handoff reports. Each alert includes the root cause (e.g., "waiting caused by upstream station B-12 downtime"), the cost impact, and a recommended countermeasure. Your continuous improvement cycle shrinks from monthly to daily — because the waste data is always on, always fresh, and always actionable.
iFactory's AI Analytics Platform: Built for Lean, Ready for Industry 4.0
iFactory isn't a generic analytics dashboard. It's purpose-built for lean manufacturing practitioners who need to see waste, measure waste, and eliminate waste — every shift, every line, every day. Here's what the platform delivers out of the box.
Live TIMWOODS Dashboard
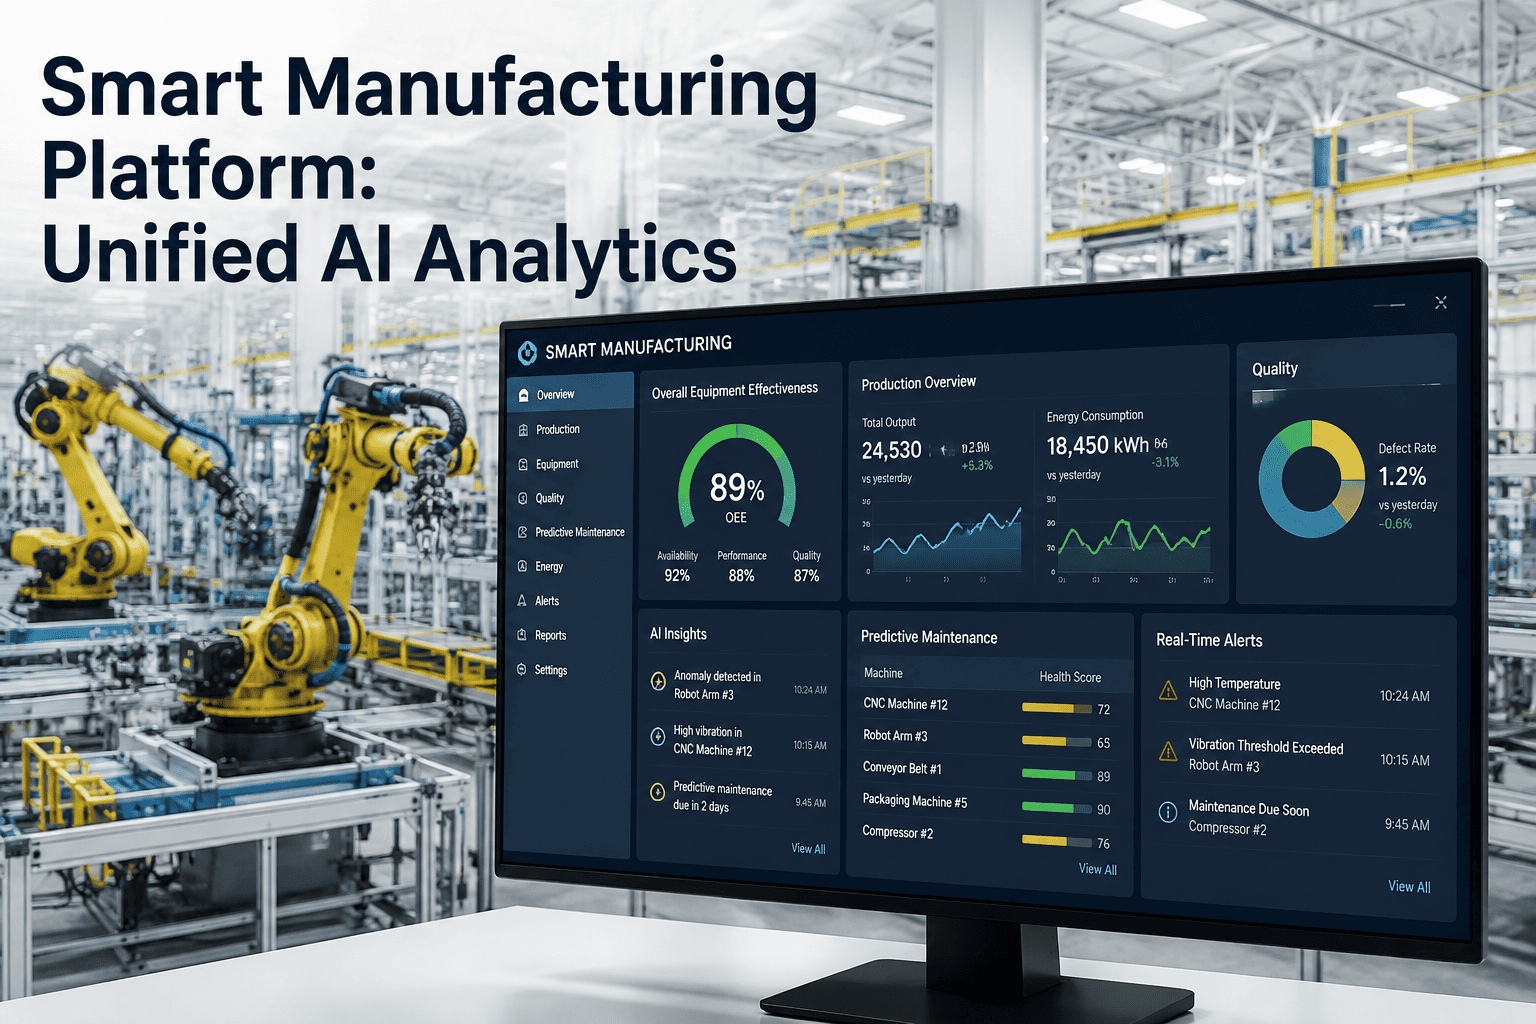
Every waste category is displayed as a live bar — green (within target), yellow (approaching threshold), red (active waste event). Drill into any bar to see the exact event, timestamp, duration, and root cause. The dashboard updates every 1–5 seconds from plant-floor data, not from batch reports.
Real-Time Waste Costing
iFactory calculates the financial impact of every waste event using your plant's actual cost parameters: labor rate, material cost, machine hourly cost, and overhead. The system shows you the total waste cost per shift, per line, and per waste type — so you can prioritize kaizen initiatives by dollar impact, not by gut feel.
Automated Root Cause Analysis
When a defect or waiting event occurs, iFactory's AI traces the upstream data — cycle time changes, temperature drift, operator actions, maintenance history — to identify the most likely root cause. No manual fishbone diagramming. The system surfaces the "why" within seconds of the event, accelerating your PDCA cycle from weeks to minutes.
Shift-Level Waste Reports
Every shift ends with an auto-generated waste report: total waste cost by category, top-3 events, trend vs. prior shift, and recommended countermeasures. Team leads use this report to start the next shift with a focused improvement target — not a blank whiteboard.
Operator Motion & Skill Mapping
iFactory tracks operator motion patterns (via HMI interactions and location data from connected tools) and identifies non-value-added movement. It also logs operator-suggested improvements and ties them to waste reduction outcomes — surfacing untapped talent that manual systems miss.
Lean Audit Trail
Every waste event, every countermeasure, every cost calculation is logged with full traceability. Use the audit trail for ISO 9001, IATF 16949, or internal lean compliance reviews. No more reconstructing kaizen history from paper forms — the data is there, time-stamped, and exportable.
Real Results from Plants That Deployed iFactory for TIMWOODS Elimination
The numbers below are drawn from iFactory's deployment database across 47 discrete manufacturing and process plants. Every metric is measured from the plant's own data — no surveys, no estimates, no vendor-adjusted baselines.
Everything You Need to Make TIMWOODS a Live, Daily Practice
iFactory is delivered as a turnkey, on-premise appliance — no cloud, no data egress, no IT project. We handle integration, configuration, and training. Within one quarter, your lean team has a live waste map that updates every second.
End-to-End Turnkey Deployment
We connect to your existing data sources (PLCs, SCADA, MES, CMMS, HMI logs) and deliver a working pilot in 6–12 weeks. No new sensors required. No custom development.
On-Premise, Zero Cloud Dependency
iFactory runs on an NVIDIA appliance inside your plant network. No data leaves the facility. No cloud subscription. No cybersecurity exposure. Your waste data stays yours.
Pilot-to-ROI in One Quarter
From appliance installation to your first waste-reduction savings report: one quarter. Average pilot customers see positive ROI within 8 weeks of go-live.
24x7 Managed Service
iFactory includes ongoing model monitoring, data pipeline health checks, and system updates. Your lean team focuses on improvement — we keep the waste detection engine running.
Built for Lean Practitioners, Not Data Scientists
The interface is designed for team leads, shift managers, and continuous improvement specialists. No coding. No SQL. No data science background needed. If you can read a dashboard, you can eliminate waste with iFactory.
Seamless Integration with Existing Lean Systems
iFactory feeds data into your existing kaizen boards, ERP systems, and quality management platforms. It complements — not replaces — your current lean toolkit. We provide standard APIs and report exports.
Frequently Asked Questions About AI for TIMWOODS Elimination
Stop Guessing. Start Seeing TIMWOODS Live.
Your plant's waste data is already there — in your PLCs, your SCADA, your MES. iFactory makes it visible, measurable, and actionable in one quarter. No cloud. No data egress. No black belts required.

.jpeg)

