It's 6:54 AM on a Sunday, and the supplier quality manager at a mid-sized automotive parts manufacturer is staring at a spreadsheet that says "OK" for every incoming batch from a tier-2 stamping supplier. But on the plant floor, three of the last five batches have caused a 12-minute micro-stop on the transfer line because of dimensional drift in a mounting bracket. The line runs at 180 units per hour. That 12-minute micro-stop cost $4,200 in lost throughput. The spreadsheet never caught it. The supplier's PPAP was perfect. The problem isn't the batch — it's that nobody can connect the supplier's process data to the plant's actual production outcomes in real time. That blind spot is bleeding margin across every supply lane in the facility.
Stop Managing Supplier Quality by Spreadsheet. Start Connecting Incoming Process Data to Real-Time Production Impact.
iFactory closes the gap between what a supplier ships and what your line actually experiences — automatically ingesting supplier process data, correlating it to downstream defects and downtime, and giving you a single source of truth for supplier performance. No more chasing paper Cpk reports. No more surprise line stops.
Supplier Quality: The Old Way vs. The iFactory Way
The difference isn't just data — it's the ability to act on it in the same shift. Here's what changes when you stop managing supplier quality in the dark.
Without iFactory
- Supplier PPAP and Cpk reports sit in a shared drive, reviewed weeks after production
- Incoming inspection is a sample-based gate that misses 80% of process drift
- Line stops from supplier defects take 2–3 shifts to trace back to the root cause
- Supplier scorecards are built manually from scattered data, updated monthly
- No visibility into whether a supplier's process is actually in control between audits
With iFactory
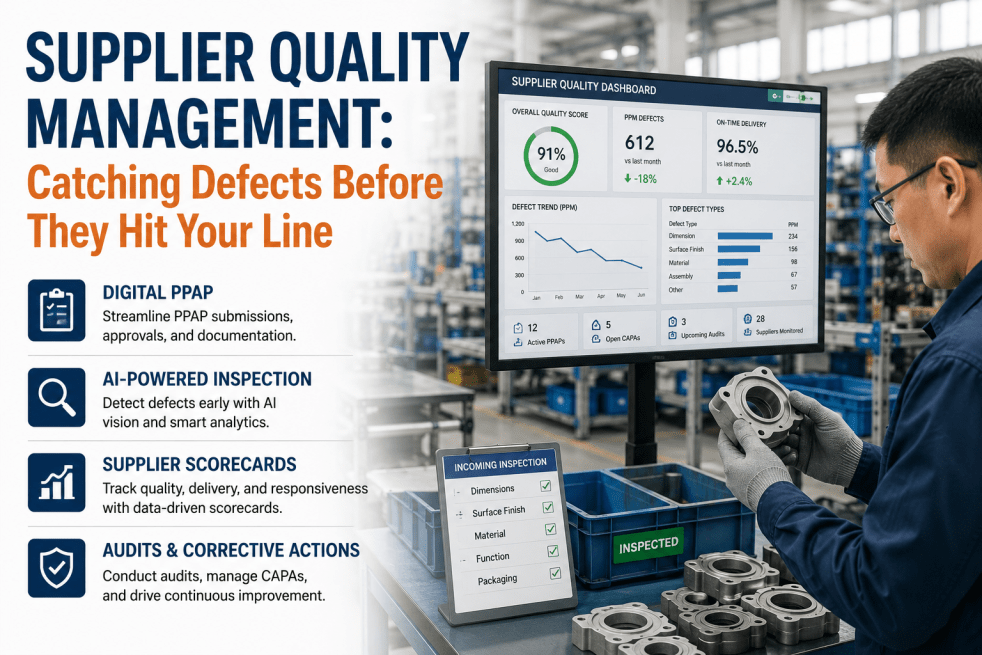
- Supplier process data (SPC, OCV, torque curves) is ingested in real time and correlated to your line performance
- Every incoming lot is risk-scored automatically based on live process capability, not sample size
- Root cause is identified in minutes — the system links a specific supplier parameter shift to the exact downtime event
- Supplier scorecards are generated automatically, updated every shift, with trend data and risk flags
- You see every supplier's process control status on a single dashboard, updated every 10 seconds
What Poor Supplier Visibility Actually Costs You
When you can't connect supplier process data to production outcomes, every gap has a price tag. Here's where the money leaks.
Unplanned Line Stops
Each supplier-related micro-stop (5–15 min) on a high-speed assembly line costs $350–$1,200 in lost throughput. With an average of 4 per week, that's $73,000–$250,000 annually per line.
Rework & Scrap from Incoming Defects
Undetected process drift from a supplier leads to 1.5–3% rework rates on downstream operations. For a plant running 50M units/year at $0.15/unit rework cost, that's $112K–$225K annually.
Expedited Freight & Emergency Sourcing
When a bad batch shuts a line, emergency replacement shipments cost 3x–5x standard freight. A single air-freight emergency for a critical component can run $15K–$40K.
Quality Engineering Time
Your quality engineers spend 12–18 hours per week manually pulling data, building reports, and chasing suppliers for corrective actions. At $85/hr fully loaded, that's $53K–$80K per engineer per year.
Warranty & Customer Penalties
Supplier quality escapes that reach the customer result in warranty claims averaging $2,500–$15,000 per incident, plus potential line-chargeback penalties from OEMs of $500–$2,000 per minute of downtime.
Four Steps to Connected Supplier Quality
iFactory doesn't replace your supplier relationships — it gives you the data framework to manage them with precision.
Ingest Supplier Process Data
Connect directly to your suppliers' SPC systems, torque monitors, or OCV stations via secure API or flat-file upload. iFactory normalizes every format into a single process signature.
Correlate to Your Production Events
The platform automatically links incoming supplier data to your plant's downtime, defect, and throughput logs — identifying which parameter shifts preceded which line events.
Risk-Score Every Lot in Real Time
Every supplier lot gets a live risk score based on process capability trends, not just sample inspection. Lots flagged as high-risk trigger automatic alerts to your quality team.
Auto-Generate Scorecards & Corrective Actions
iFactory builds shift-level scorecards for every supplier, tracks corrective action effectiveness, and surfaces the top 5 process risks across your supply base — every morning.
What iFactory Delivers for Supplier Quality
Four tightly integrated capabilities that turn supplier data into a competitive advantage.
Multi-Source Data Ingestion
Ingest SPC data, torque curves, OCV results, and inspection logs from any supplier regardless of format or system. iFactory's data normalization engine handles CSV, XML, MQTT, and direct PLC connections — no IT project required.
Real-Time Correlation Engine
Automatically link supplier process drift to downstream production events. When a supplier's Cpk drops below 1.33, iFactory checks every line stop in the next 48 hours for a causal match — and flags the correlation in under 60 seconds.
Dynamic Risk Scoring
Each incoming lot is scored on a 0–100 scale using live process capability, historical defect rate, and production impact. High-risk lots trigger automated workflows: alert the buyer, flag for reinspection, or block release to the line.
Automated Supplier Scorecards
Generate shift-level, daily, and weekly scorecards for every supplier — automatically. Scorecards include process capability trends, defect Pareto, corrective action status, and risk trajectory. No manual data pulls. No waiting for month-end.
You can have a live pilot connecting your top 3 suppliers to your production data in 6–12 weeks. Book a 30-min walkthrough and we'll show you how it works on your data.
Everything You Need to Run Supplier Quality Like a Process
iFactory is delivered as a complete, turnkey solution — no integration work on your side, no cloud dependency, no hidden costs.
Turnkey Pilot in 6–12 Weeks
We connect to your data sources and your top 3 suppliers. You get a working pilot with live dashboards and risk scoring — not a proof of concept that needs six months of IT work.
On-Premise & Air-Gapped
iFactory runs on an NVIDIA appliance inside your plant network. Zero data leaves your facility. No cloud. No third-party access. Compliant with ITAR, GDPR, and every corporate data policy.
Supplier-Agnostic Data Model
Works with any supplier data format — SPC charts, torque curves, CMM reports, manual inspection logs. No supplier is too small or too complex. No new software required on their side.
End-to-End Managed Service
iFactory handles data ingestion, model maintenance, dashboard updates, and alert tuning. Your team focuses on supplier relationships and corrective actions, not data plumbing.
Pilot to ROI in One Quarter
From kickoff to measurable reduction in supplier-related downtime — one fiscal quarter. Our average customer sees a 40% drop in supplier-caused line stops within 90 days of go-live.
24x7 Operations Monitoring
iFactory's operations team monitors your supplier quality dashboards around the clock. If a risk threshold is breached, we alert your team before the bad lot hits the line.
Questions Operations Leaders Ask About Supplier Quality Management
Stop Managing Supplier Quality in the Dark
Your suppliers are sending you data. Your line is telling you what's working. iFactory connects them in real time. Book a 30-minute walkthrough and we'll show you what you're missing — on your data, with your suppliers.