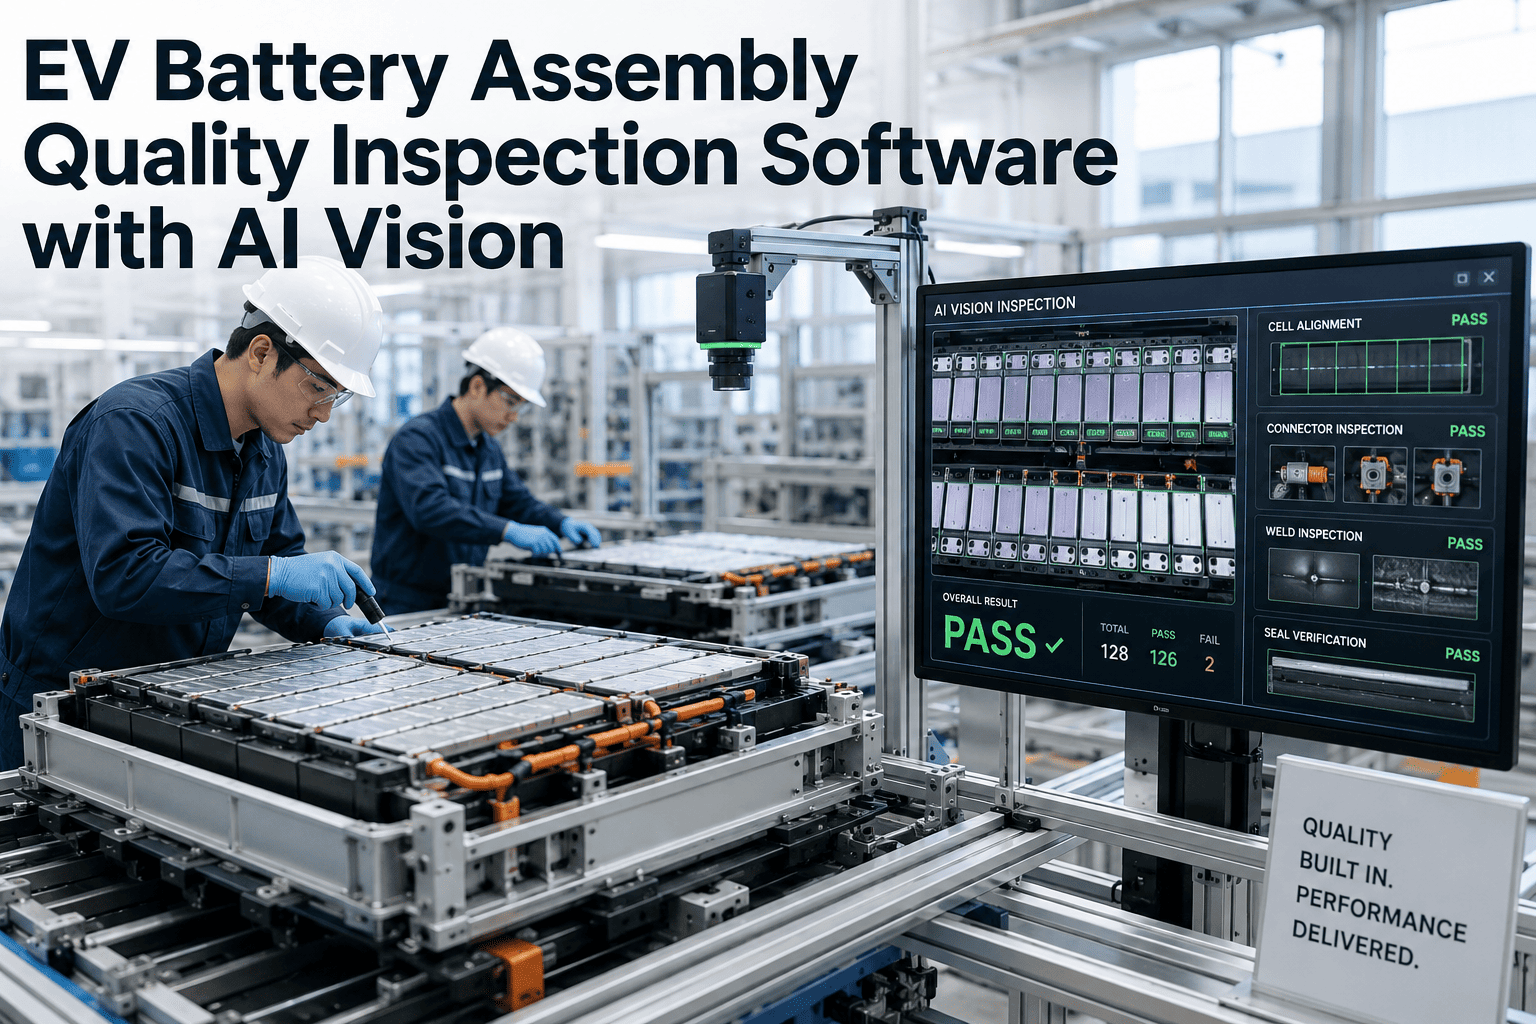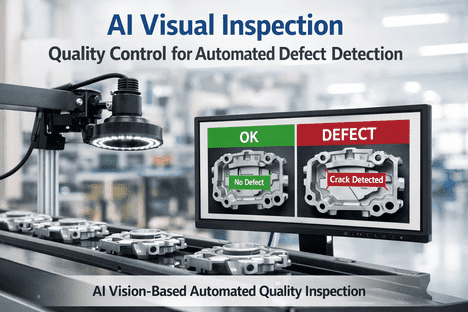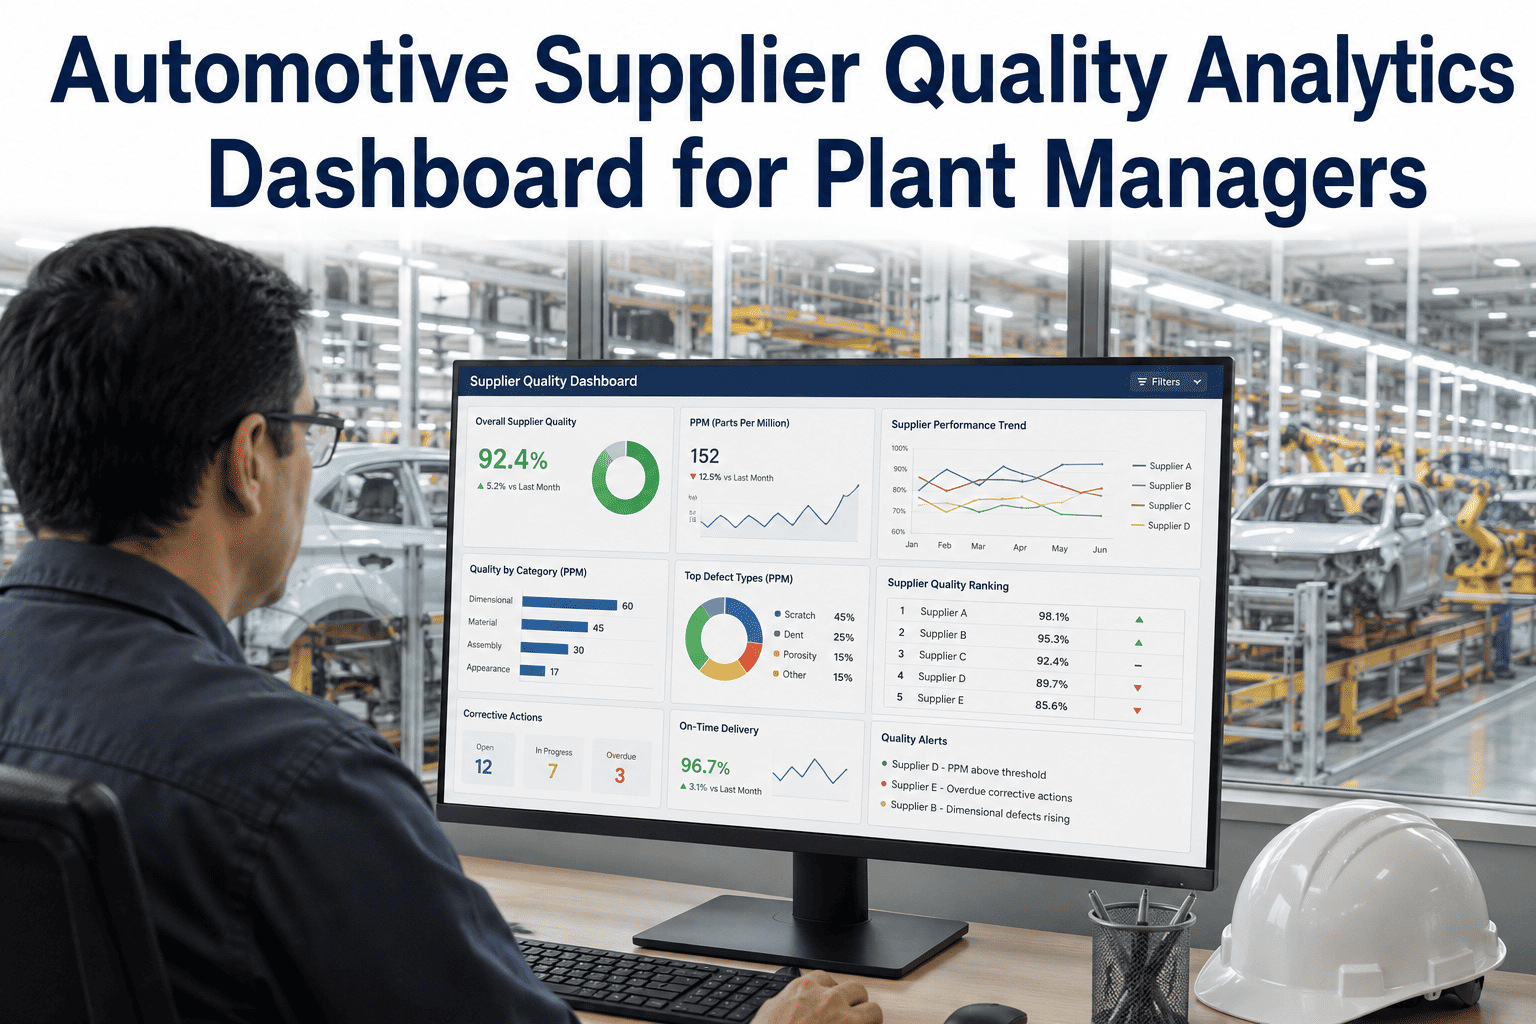
In the fast-paced world of automotive manufacturing, supplier quality is not just a metric; it is the backbone of operational excellence and brand reputation. Plant managers face relentless pressure to maintain zero-defect production lines while managing a complex web of tier-one and tier-two suppliers. Every defective component that slips through can trigger costly recalls, assembly line stoppages, and long-term damage to customer trust. This is where a dedicated quality analytics dashboard becomes indispensable. iFactory's Quality Analytics module transforms raw inspection data into actionable intelligence, enabling plant managers to pinpoint repeat defects, trace root causes, and implement corrective actions with unprecedented speed. By integrating real-time data from assembly lines, weld stations, paint booths, and supplier portals, the dashboard provides a single source of truth for quality performance. Whether you are monitoring EV battery module tolerances or interior trim finish, the ability to visualize defect trends over time empowers proactive decision-making. Book a Demo to see how leading automotive plants use iFactory to turn quality data into a competitive advantage.
Transform Your Quality Data into Actionable Insights
Stop guessing. Start reducing scrap and improving supplier performance with real-time analytics.
The Cost of Unchecked Supplier Defects
Automotive OEMs lose billions annually due to supplier-related quality issues. A single faulty weld can halt an entire assembly line for hours. Plant managers often rely on disconnected spreadsheets and manual reporting, leading to delays in identifying recurring problems. Without a centralized quality analytics dashboard, defect trends remain invisible until they escalate into major crises. iFactory addresses this by aggregating data from multiple sources, including inline inspection stations, supplier portals, and final audit checks. The result is a proactive quality management system that flags anomalies before they impact production schedules.
Key Capabilities of the Quality Analytics Dashboard
Real-Time Defect Monitoring
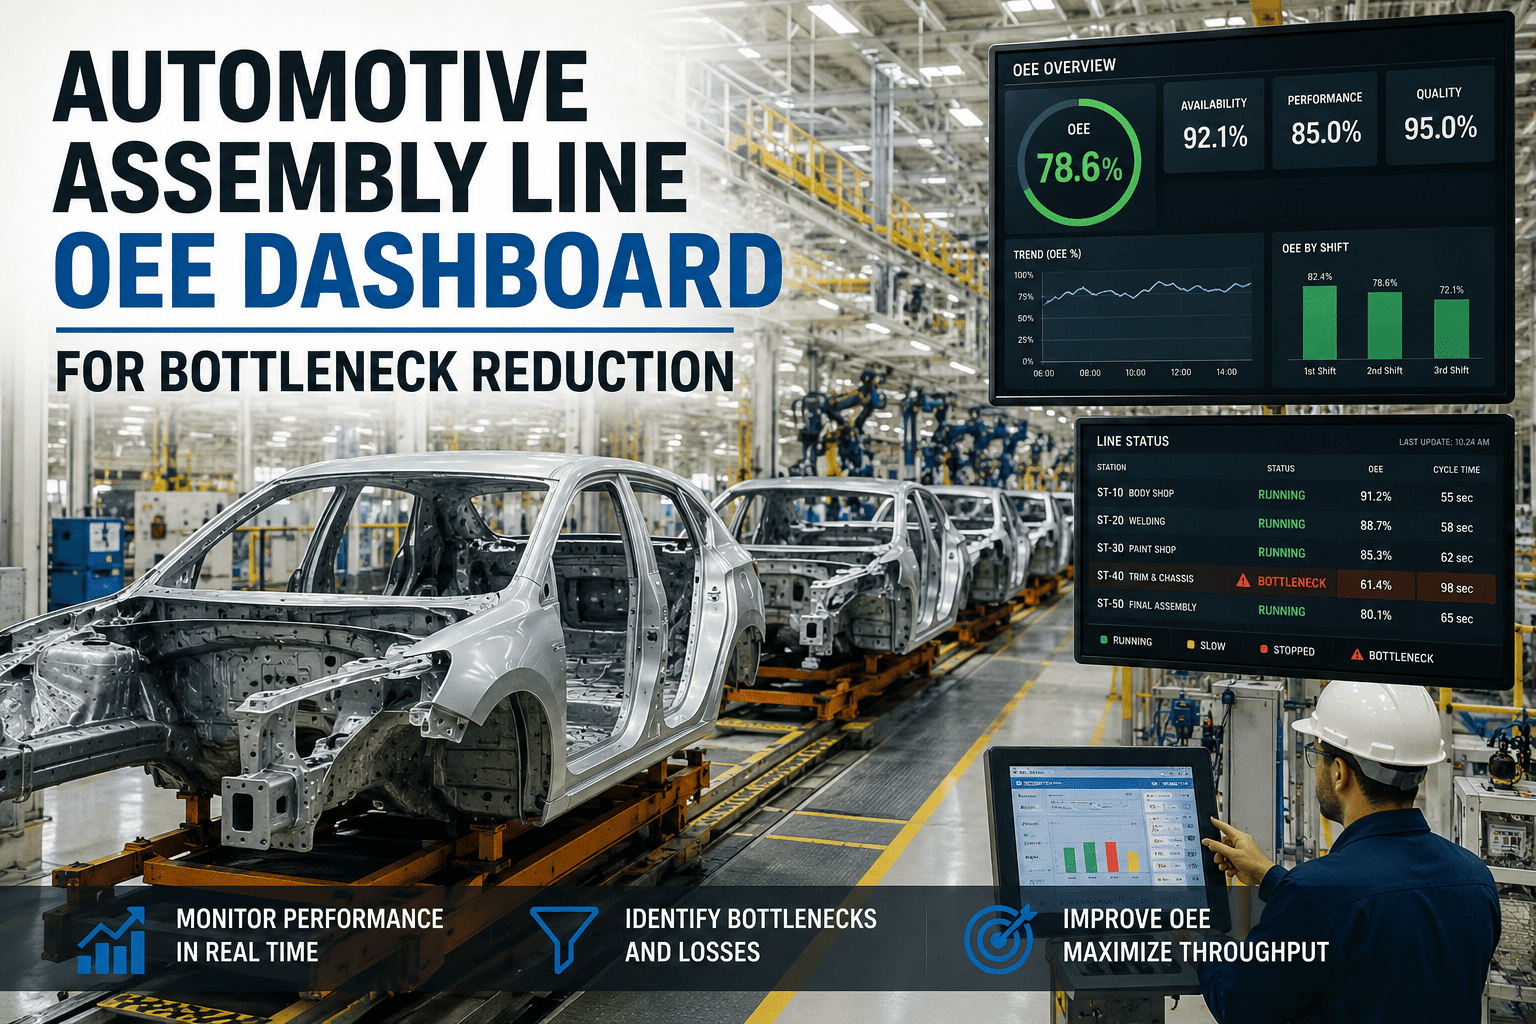
Live dashboards display defect counts per supplier, part number, and production shift. Color-coded alerts notify plant managers when defect rates exceed predefined thresholds, enabling immediate intervention.
Root Cause Analysis Tools
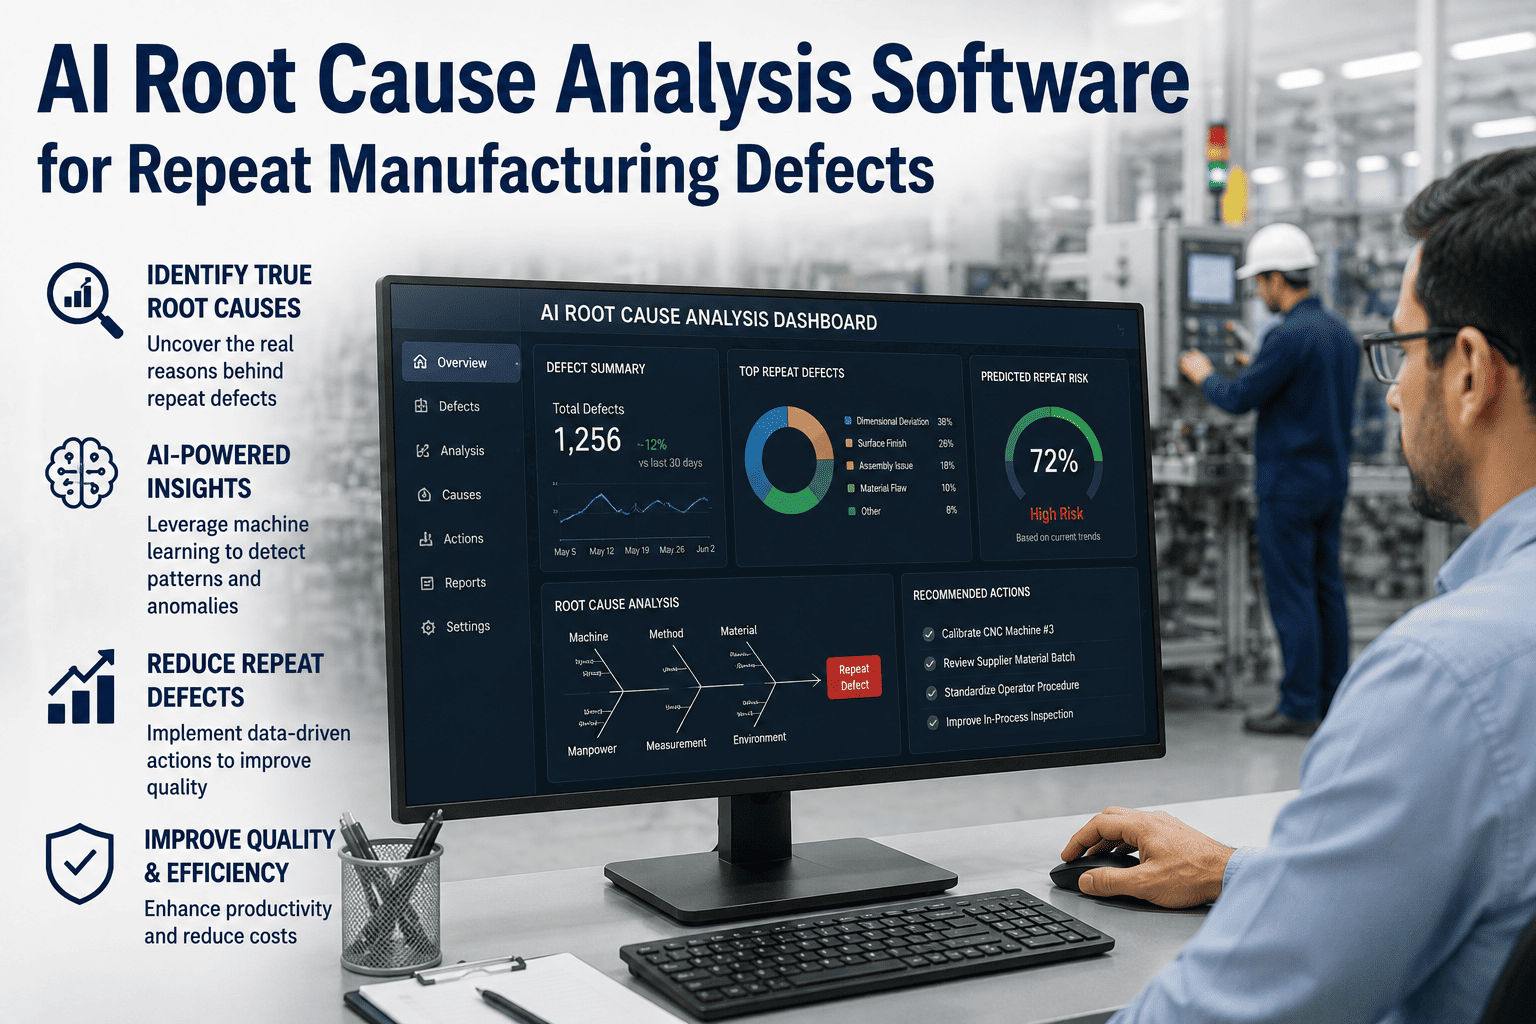
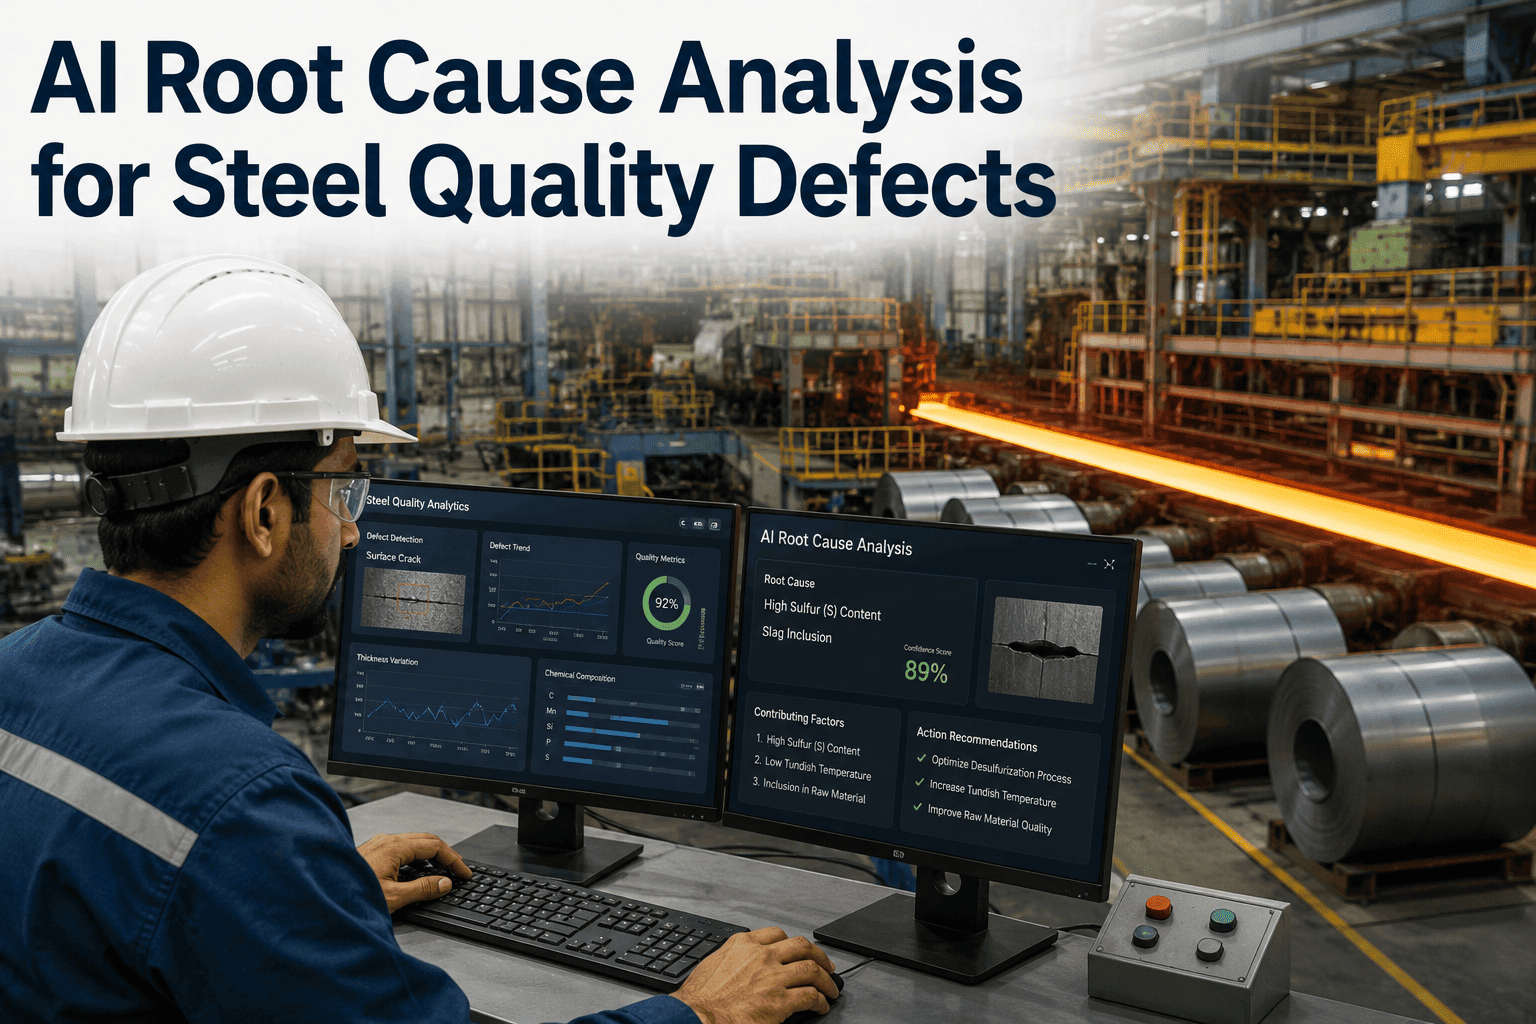
Integrated fishbone diagrams and Pareto charts help teams drill down into the most frequent defect types. Correlation analysis links defects to specific machine parameters or material batches.
Supplier Scorecards
Automated scorecards rank suppliers based on defect rates, delivery compliance, and corrective action responsiveness. This drives accountability and supports strategic sourcing decisions.
Trend Analysis & Forecasting
Machine learning models predict future defect rates based on historical data and current production variables. Plant managers can simulate the impact of process changes before implementation.
From Defect to Resolution: A Step-by-Step Workflow
Data Ingestion
iFactory connects to quality inspection systems, PLCs, and supplier APIs to ingest defect data in real time. No manual data entry required.
Anomaly Detection
AI algorithms identify unusual defect patterns, such as a sudden spike in paint imperfections from a specific supplier batch.
Root Cause Analysis
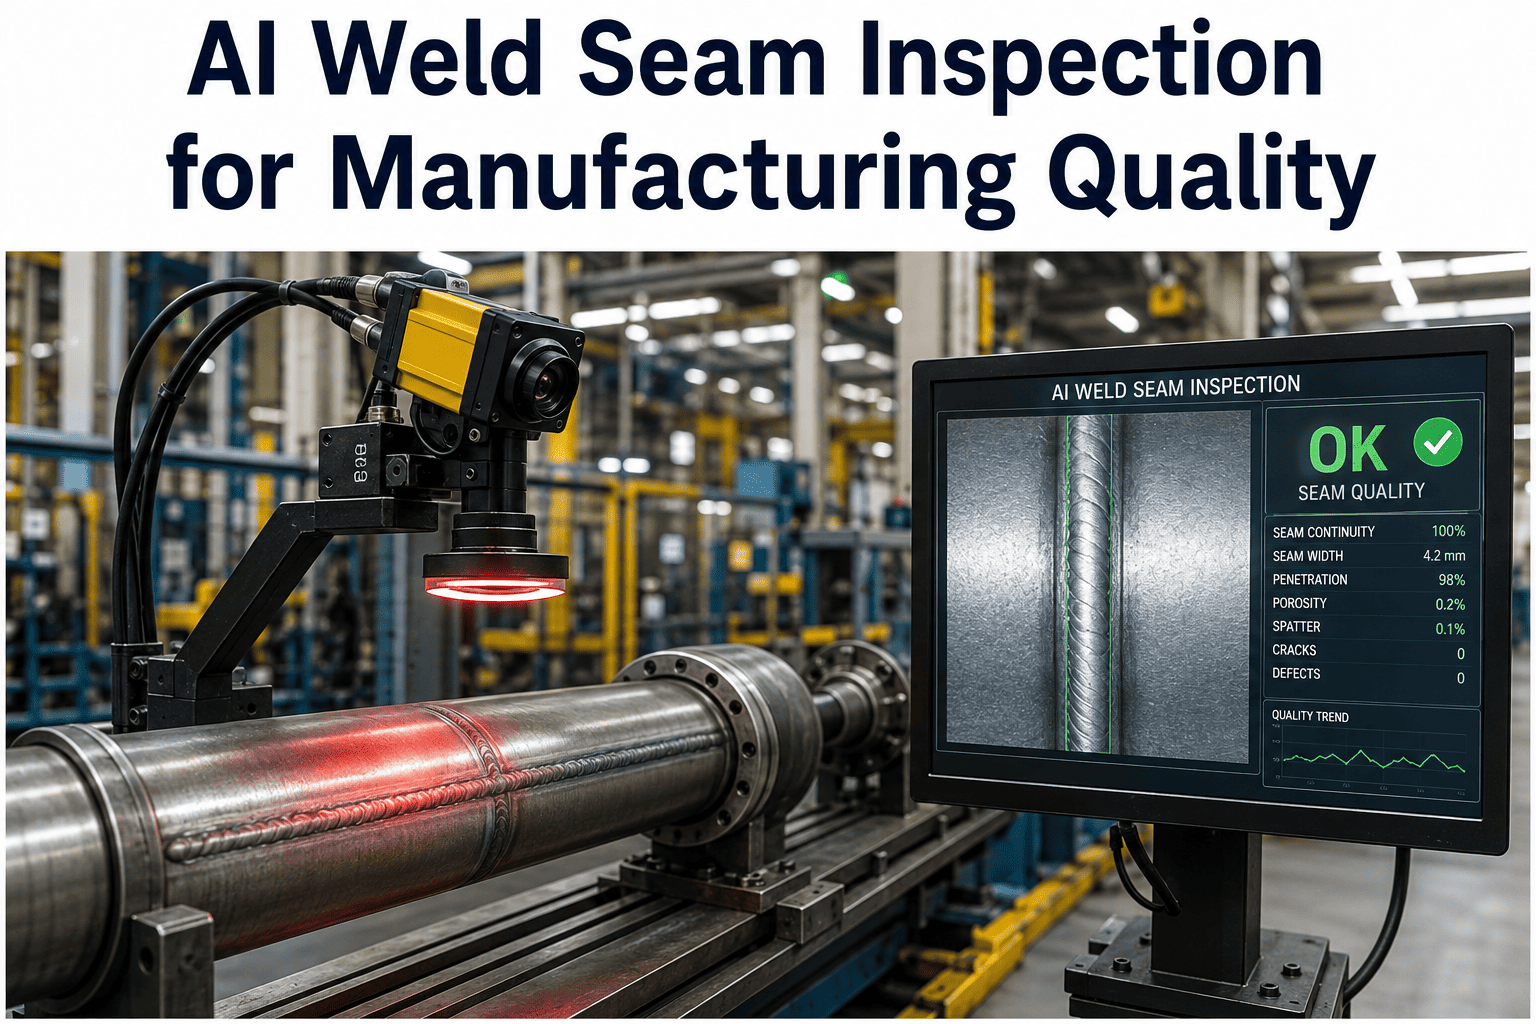
Using drill-down analytics, the team isolates the root cause, such as a calibration drift in a robotic welder.
Corrective Action
Automated workflows assign corrective actions to the responsible team, with due dates and escalation rules.
Verification & Closure
Post-implementation data confirms defect reduction. The entire process is documented for audit and compliance purposes.
See How iFactory Streamlines Quality Management
Join 200+ automotive plants that have reduced scrap by 40% using our AI-powered dashboard.
Defect Trend Analysis: Sample Data Table
| Supplier | Defect Type | Week 1 | Week 2 | Week 3 | Week 4 | Trend |
|---|---|---|---|---|---|---|
| ABC Electronics | Solder Joint | 12 | 8 | 5 | 3 | Decreasing |
| XYZ Plastics | Surface Scratch | 7 | 11 | 9 | 15 | Increasing |
| LMN Metals | Weld Porosity | 4 | 2 | 1 | 0 | Eliminated |
| QRS Assemblies | Misalignment | 9 | 7 | 6 | 5 | Stable |
Quality Improvement Progress Tracker
Frequently Asked Questions
How does iFactory integrate with existing quality inspection systems?
iFactory provides pre-built connectors for common automotive quality systems such as Cognex, Keyence, and custom PLC data streams. Integration is typically completed within two weeks, with no disruption to ongoing production. The platform uses REST APIs and MQTT protocols to ingest real-time inspection results, including dimensional measurements, surface defect classifications, and functional test outcomes. Once connected, the dashboard automatically updates with new data every few seconds, giving plant managers a live view of supplier quality performance. For legacy systems without APIs, iFactory offers a universal data adapter that can parse CSV exports or database dumps. Book a Demo to discuss your specific integration requirements.
Can the dashboard handle data from multiple plants and suppliers simultaneously?
Yes, iFactory's Quality Analytics dashboard is designed for multi-site, multi-supplier environments. Plant managers can view aggregated quality metrics across all facilities or drill down into a specific plant, production line, or supplier. The system supports hierarchical role-based access, so corporate quality directors see enterprise-level trends while plant-level supervisors focus on their own lines. Data from different sources is normalized using a common ontology, ensuring that defect definitions are consistent. This global view enables benchmarking of supplier performance across regions and facilitates best practice sharing. Contact Support to learn about deployment options for global automotive organizations.
What types of defects can be tracked with iFactory?
iFactory supports tracking virtually any defect type encountered in automotive manufacturing, including dimensional deviations, surface imperfections (scratches, dents, paint runs), weld defects (porosity, spatter, incomplete fusion), material contamination, and functional failures. The system allows users to define custom defect categories with hierarchical classification. For example, a paint defect can be further classified as 'dust inclusion', 'orange peel', or 'color mismatch'. Each defect can be tagged with severity levels, associated machine parameters, and operator notes. The dashboard then aggregates these into meaningful trend charts and Pareto analyses. Book a Demo to see how iFactory handles your specific defect types.
How does iFactory help with regulatory compliance and audit readiness?
iFactory maintains a complete, immutable audit trail of all quality data, including raw inspection results, corrective actions, and user activities. The platform supports compliance with IATF 16949, ISO 9001, and other automotive quality standards. Automated reports can be generated for customer-specific requirements, such as PPAP submissions or 8D reports. All data is encrypted at rest and in transit, with role-based access controls to ensure only authorized personnel can view or modify records. For audits, the dashboard provides a 'compliance view' that shows all relevant documentation and evidence in one place. Get Support for assistance with your compliance documentation.
What is the typical ROI after implementing iFactory Quality Analytics?
Customers typically see a return on investment within three to six months. The primary drivers of ROI are scrap reduction (average 40%), decreased rework labor, and fewer line stoppages due to early defect detection. Additional savings come from reduced supplier quality engineering costs, as automated scorecards and root cause analysis replace manual investigations. One EV battery manufacturer reported a 50% reduction in warranty claims within the first quarter after deployment. The dashboard also reduces the time spent on monthly quality reporting from days to minutes. Book a Demo to calculate the potential savings for your plant.
Ready to Transform Your Supplier Quality?
Join the industry leaders who trust iFactory to deliver actionable insights and measurable improvements.