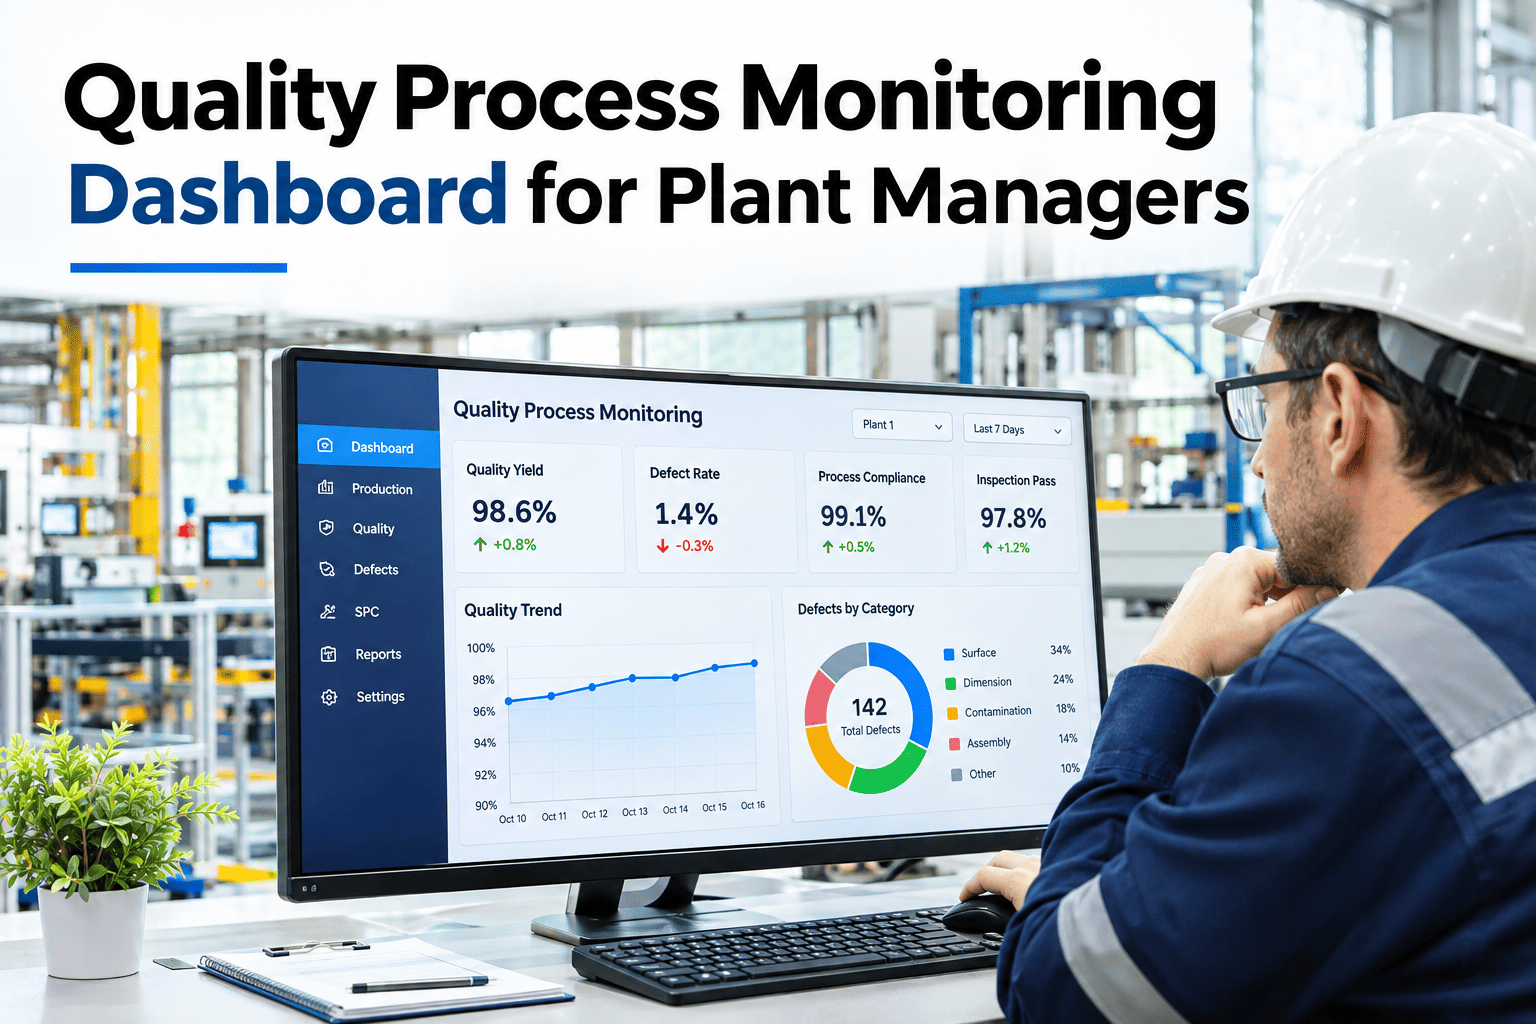
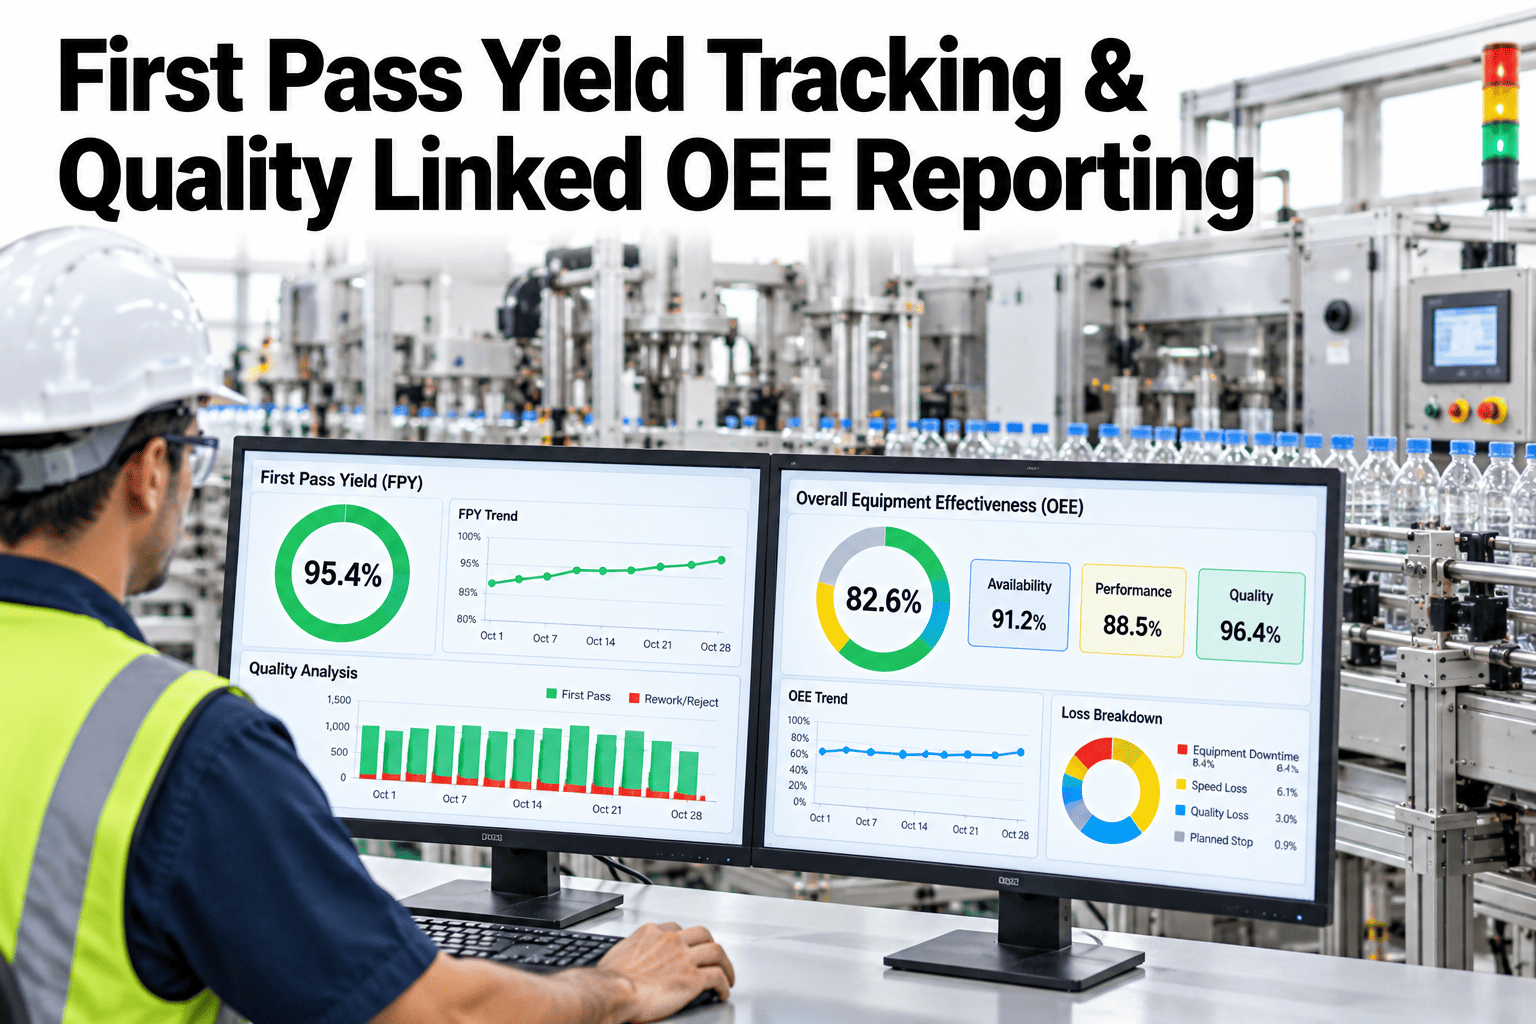
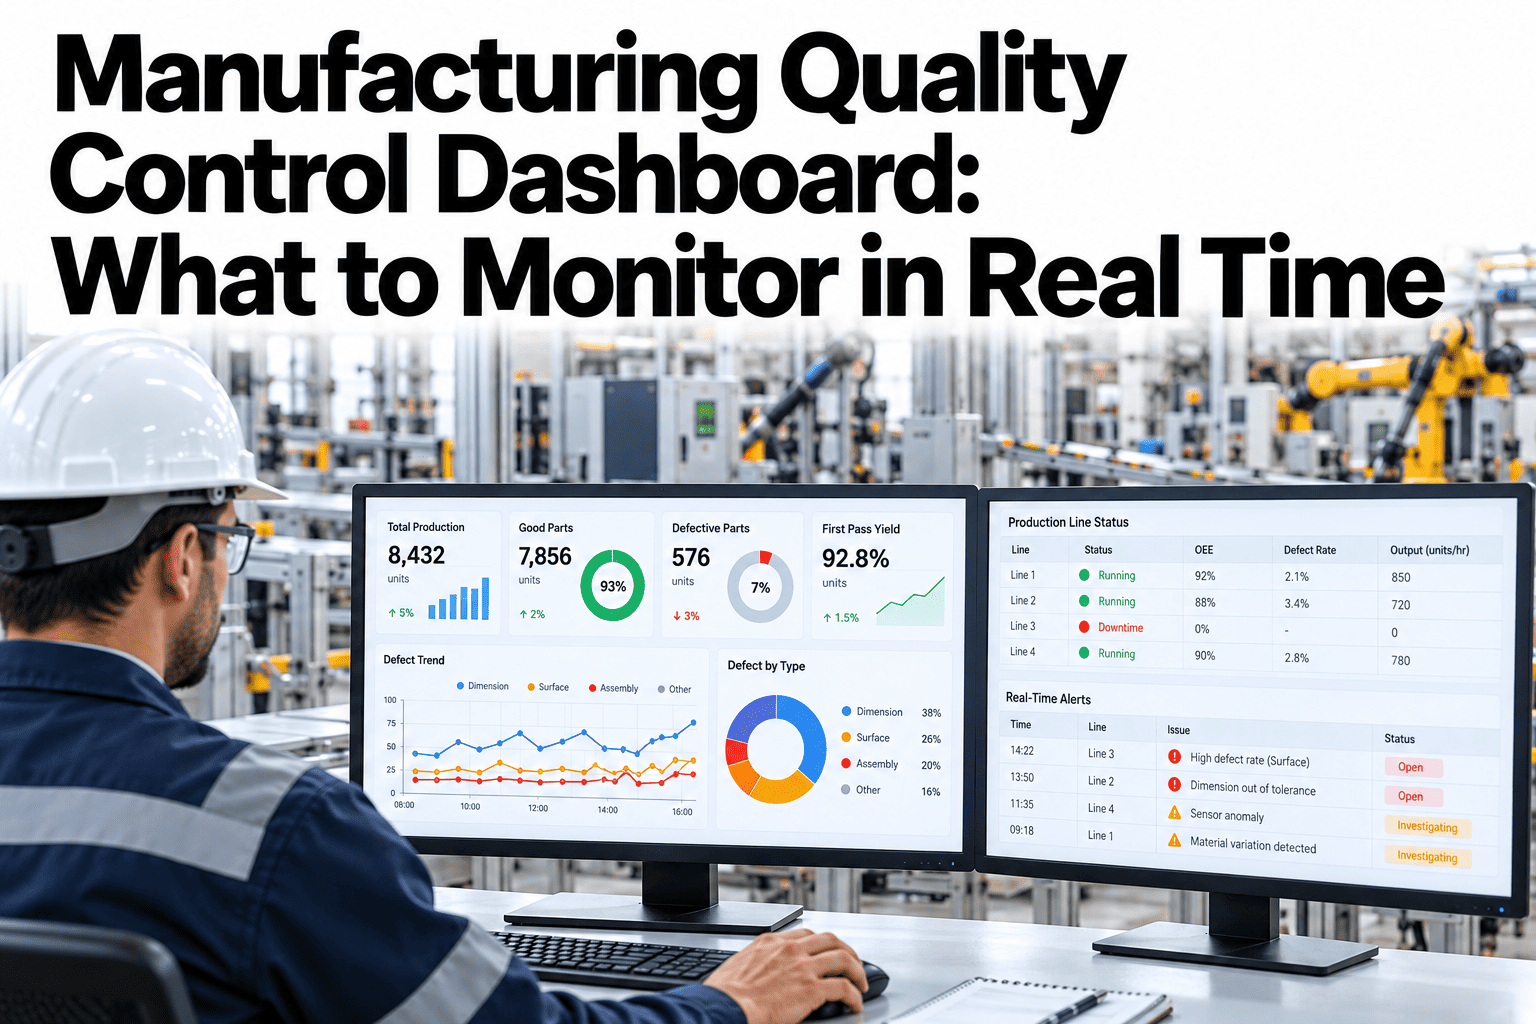
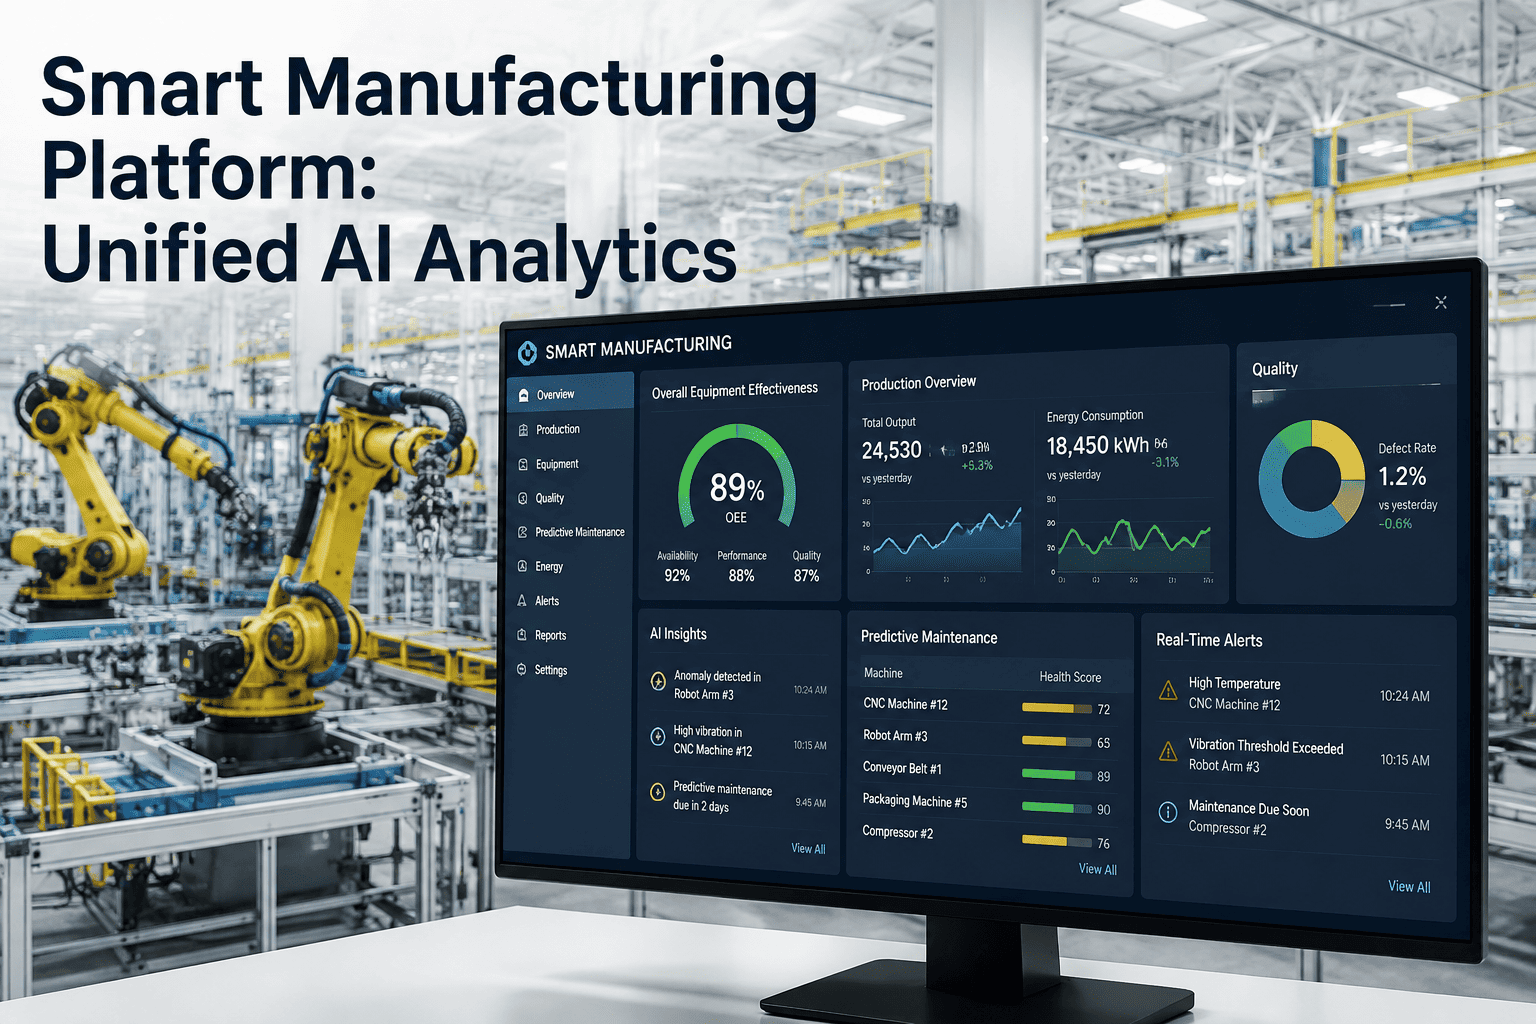
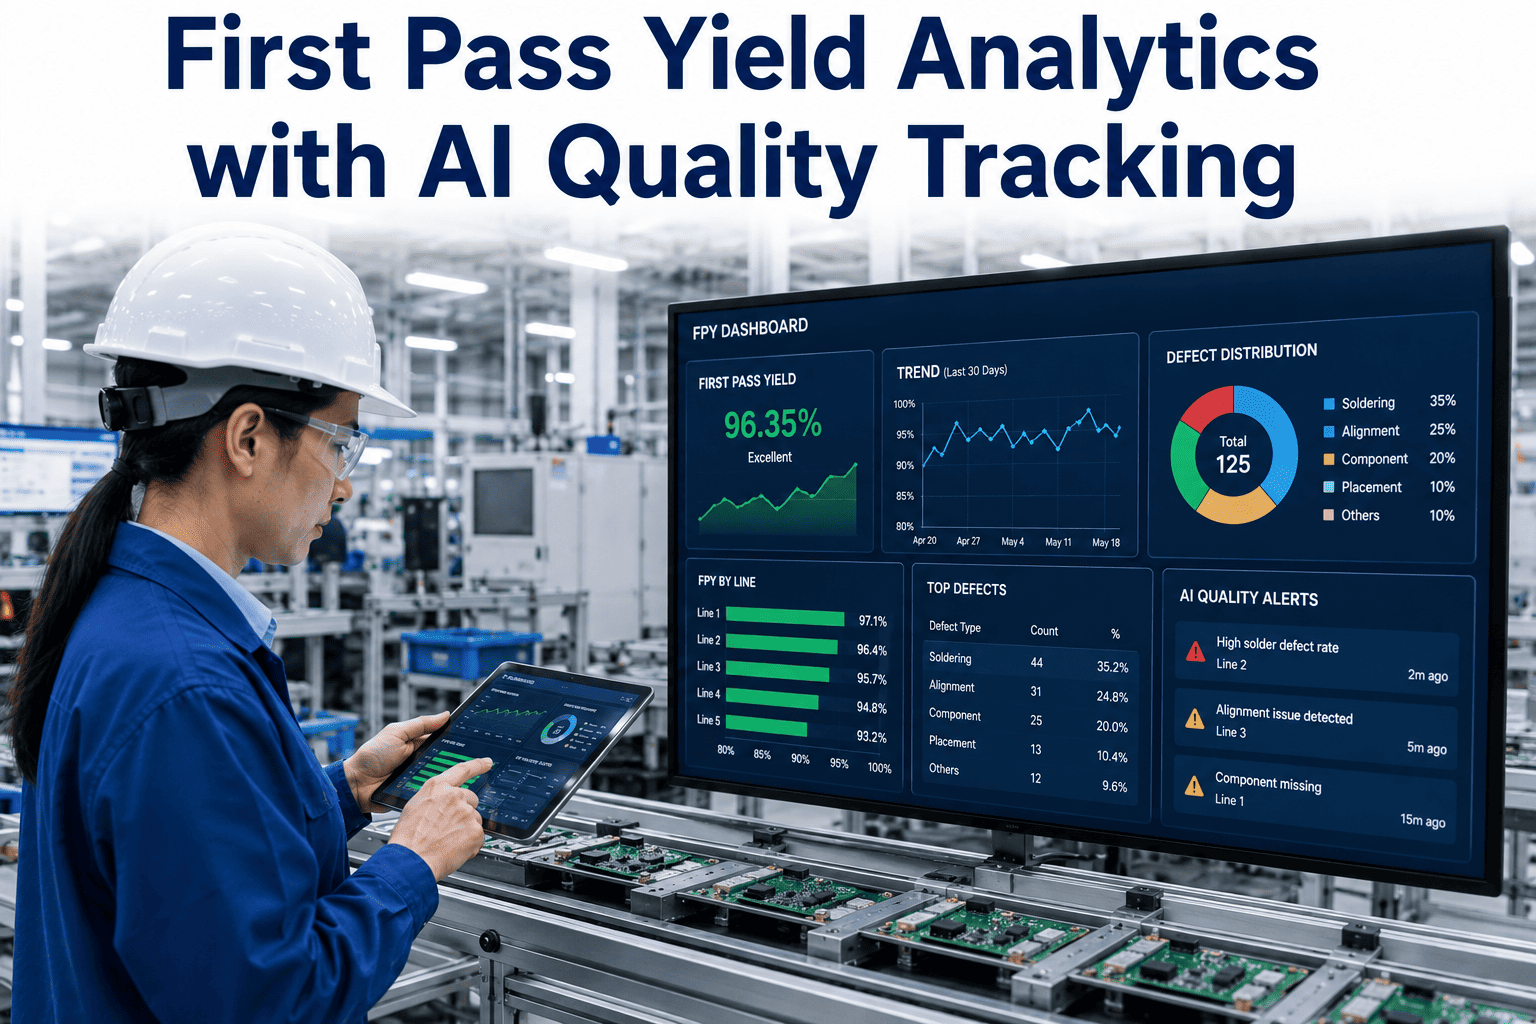
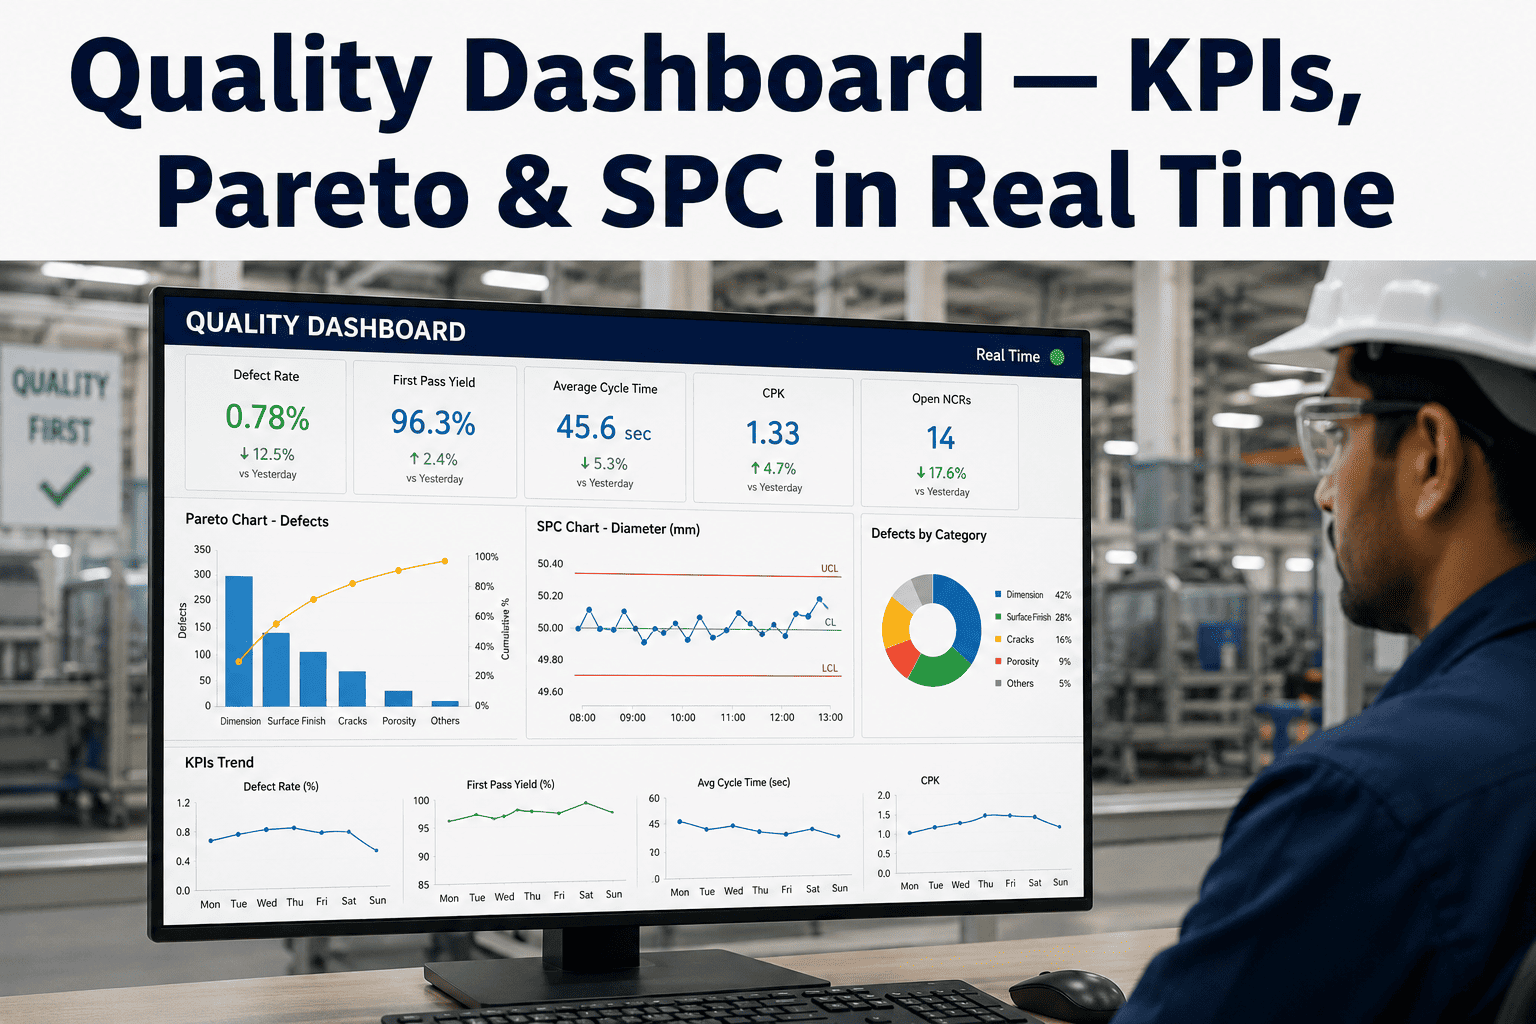
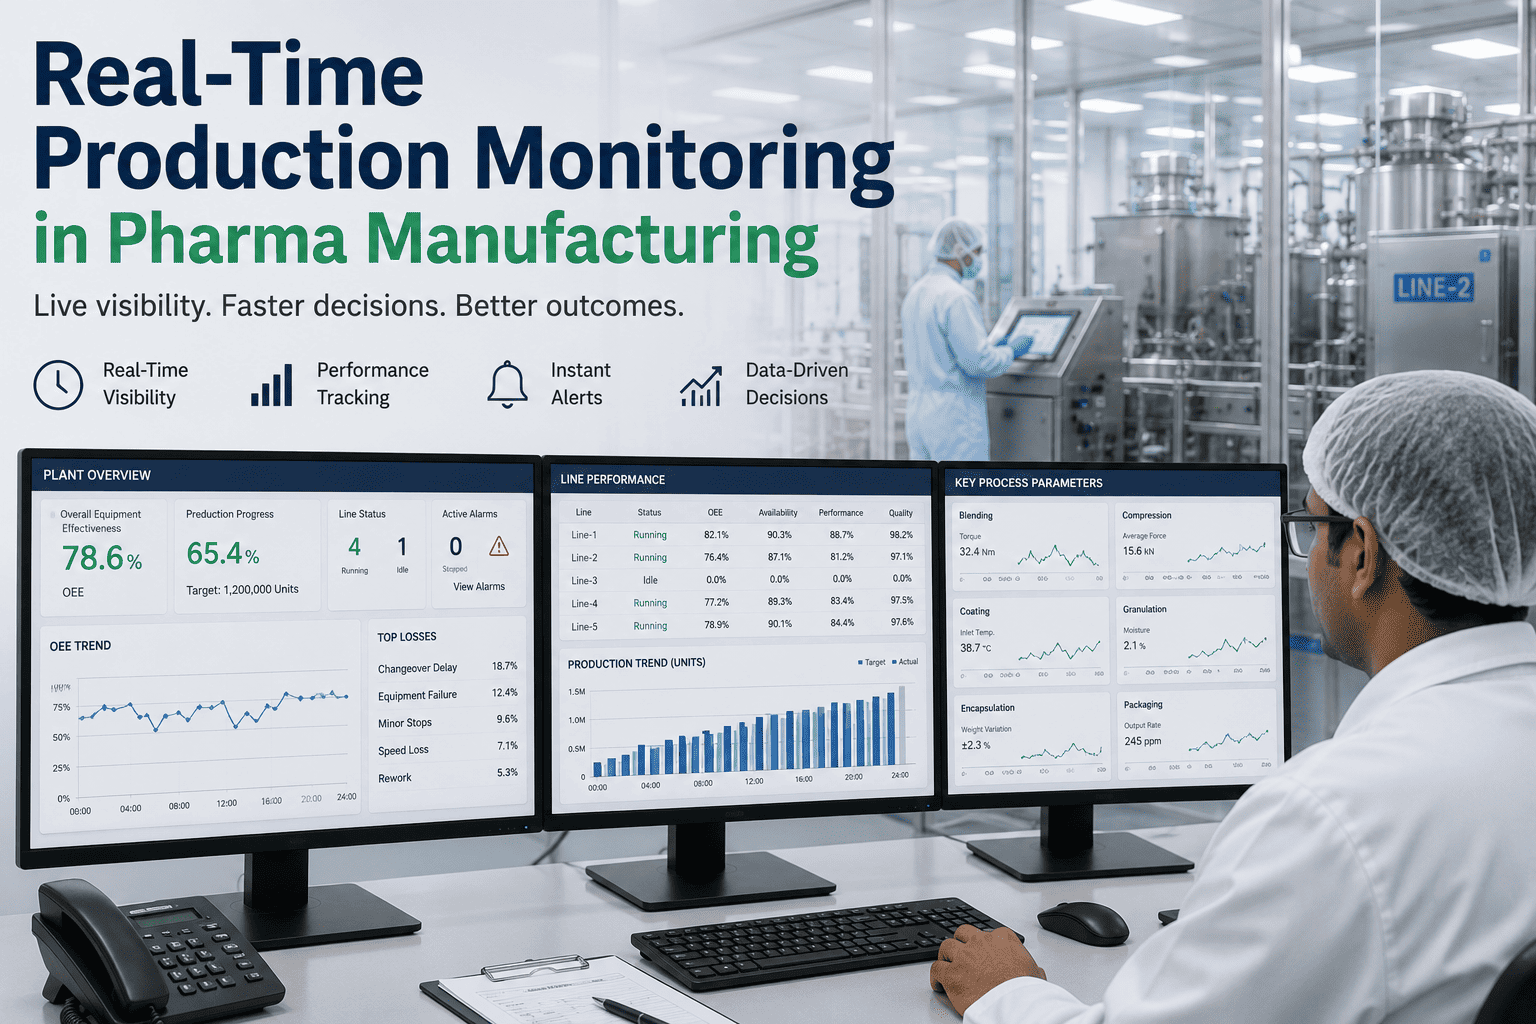
A quality process monitoring dashboard gives a plant manager one live view of first-pass yield, scrap, rework, defect trends, process parameters and alerts, all tied to the machine and shift that produced them. Without that context, a quality number is just a score that arrives too late to change. Plants running at the industry median of about 60 percent OEE (TeepTrak, 2026) often lose a large share of that gap to quality and rework that nobody sees in time. iFactory, an on-premise AI platform for smart manufacturing, builds this view from live line data, and managers can preview a quality dashboard laid out around their own KPIs in a short walkthrough.
Predictive Quality · Plant Manager View
One Screen That Shows Quality Before the Shift Ends
iFactory AI joins yield, scrap, rework, alerts and machine context so managers decide with live evidence.
Line 2 · Quality overview · Illustrative
Defect trend by hour, with the latest hour flagged
The layout
What Should a Quality Monitoring Dashboard Show?
It should show eight things on one screen: yield, scrap, rework, defect trends, process parameters, alerts, machine state and shift context. Each answers a different manager question.
First-pass yield
Scrap and rework
Defect Pareto
Process parameters
Alert feed
Machine state
Shift and lot
Trend versus target
The layout matters as much as the metrics. Put the decision numbers at the top, and the explaining panels beneath them. Teams that want a starting layout can ask our specialists for a sample panel arrangement.
The metrics
Which Quality KPIs Belong on the Dashboard?
Choose measures that describe flow, not only outcomes. First-pass yield (FPY) is the share of units that are good the first time, with no rework. Rolled throughput yield (RTY) multiplies FPY across steps.
| KPI | How It Is Calculated | What It Tells a Manager |
| First-pass yield |
Good first time divided by units started |
How much output needs no second touch |
| Rolled throughput yield |
FPY of each step multiplied together |
Hidden loss across a multi-step line |
| Scrap rate |
Scrapped units divided by units produced |
Material and capacity thrown away |
| Rework rate |
Reworked units divided by units produced |
Labor and time spent making units twice |
| Process capability (Cpk) |
Spread versus tolerance, adjusted for centering |
Whether a parameter can hold spec |
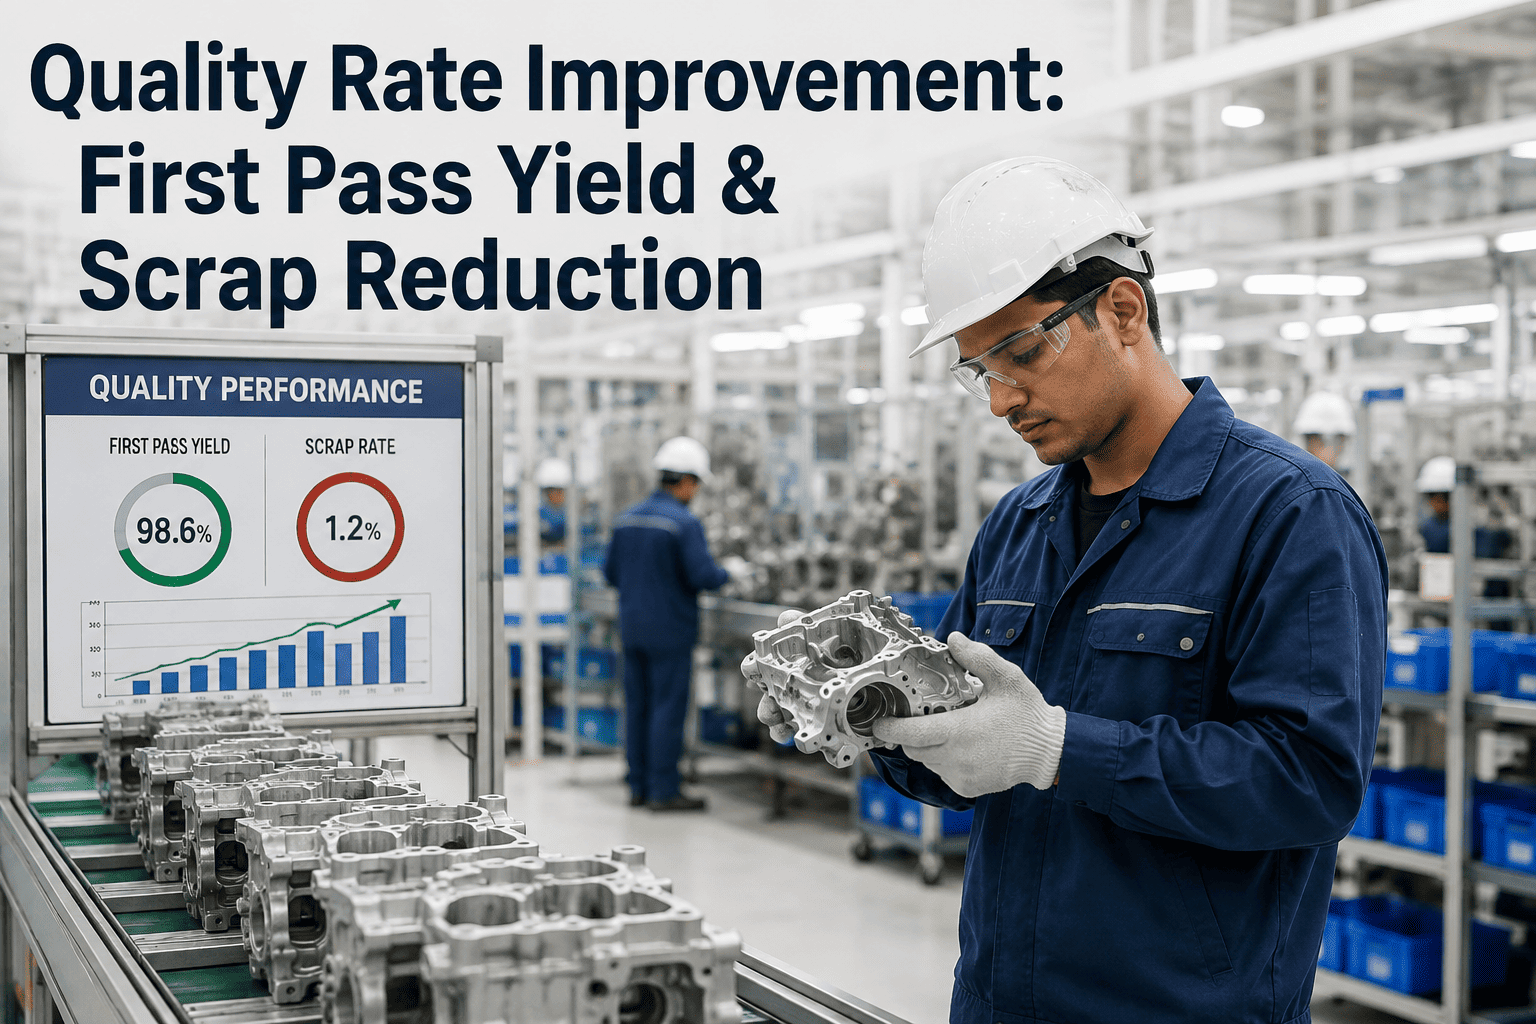
Scrap alone can mislead. A line at 2 percent scrap with 15 percent rework is only about 83 percent first-time-through (TeepTrak, 2026).
See Your KPIs on a Live Quality Screen
Share your quality measures and line layout. iFactory AI will show how they sit on one dashboard.
Alerts
How Should Quality Alerts Be Tiered?
Use three tiers so people trust the feed. Too many alerts teach teams to ignore all of them.
Watch
A parameter trends toward its limit. Operator is informed.
Warn
Defect risk is rising. Supervisor checks the process.
Act
Limit is breached or defects spike. Hold and contain.
Each tier needs a named owner and a target response time. To review tiering for your plant, discuss alert rules with our team.
Drill-down
How Do Managers Drill From Plant to Parameter?
A good dashboard answers why in four clicks. Each level narrows the search.
Plant: yield fell this week
Line: Line 2 drives the drop
Machine: sealer station is the source
Parameter: seal temperature drifted
Roles
Who Needs Which View of Quality Data?
Plant manager
Yield, scrap cost and trend versus target across lines.
Shift supervisor
Live alerts, current lot and the machines needing attention.
Quality engineer
Defect Pareto, capability and parameter history for analysis.
One data source with three views avoids the argument over whose number is right. For role-based layouts, ask support how views are configured.
Context
Why Does Machine Context Change the Answer?
A defect trend without machine context points everywhere. With it, the cause often sits on one machine or one shift.
Trend only
Defects up 20 percent
Cause unclear
Meeting needed to investigate
Trend plus context
Defects up on Line 2 nights
Linked to a sealer fault state
Action assigned in minutes
Build checklist
What Does It Take to Launch a Quality Dashboard?
Agree five to eight KPIs
Define each KPI in writing
Connect line and machine data
Standardize defect and reason codes
Set tiers and alert owners
Design views by role
Pilot on one line
Review use weekly and refine
iFactory is delivered turnkey on an on-premise NVIDIA server, live in 6–12 weeks, with team training and 24×7 remote monitoring included.
Pitfalls
What Mistakes Make Quality Dashboards Fail?
Many dashboards launch well and fade within months. Six mistakes explain most of it.
Too many panels
Keep to the eight panels that answer decisions and move the rest to drill-down pages.
KPIs without definitions
Write each formula and data source on the dashboard itself so every shift reads it the same way.
Delayed data
Refresh live signals within minutes, since a day-old yield cannot guide the current shift.
No machine context
Show the machine, lot and shift beside every defect trend.
Alerts without owners
Name who responds to each tier and how fast.
One view for everyone
Give managers, supervisors and engineers views built for their own decisions.
Fixing two or three of these usually restores trust. To review your current screens, ask our team for a dashboard health check.
Key terms
Which Terms Appear on a Quality Dashboard?
Eight terms cover the measures most managers see every day.
FPY
First-pass yield: good units first time over units started.
RTY
Rolled throughput yield: FPY of each step multiplied together.
Cpk
A capability index comparing process spread with tolerance.
Pareto chart
Bars ranked by size to show the biggest causes.
Control limit
A statistical boundary separating normal variation from a real change.
DPMO
Defects per million opportunities, a normalized defect rate.
Lot
A group of units made under the same conditions.
Drill-down
Moving from a summary to detail in a few clicks.
To see them on a working screen, preview a quality dashboard with our specialists.
Expert review
What a Quality Manager Would Check First
Holds up
Joining yield, scrap and rework to machine state is standard practice and speeds root-cause work.
Verify
That KPI definitions match across shifts and that rework is logged, not hidden inside scrap.
Avoid
Dashboards with dozens of panels. Fewer, clearer numbers drive more action.
Questions
Frequently Asked Questions
What is a quality process monitoring dashboard?
It is a live screen that combines yield, scrap, rework, defect trends, process parameters and alerts with machine and shift context. It lets managers act during the run, not after it.
See a sample on your line data.
How many KPIs should it include?
Five to eight is a practical range. More than that dilutes attention, and fewer may hide cause. Each KPI needs a written definition so every shift reads it the same way.
Ask for help choosing your KPI set.
Can it use data from our existing systems?
Usually yes. iFactory connects to PLCs, sensors, MES and ERP through standard industrial protocols, so existing records become part of one view.
Review integration options with our team for your stack.
How do we avoid alert fatigue?
Use three tiers, name an owner for each and review noisy alerts weekly. Alerts that never lead to action should be retuned or removed.
Plan alert rules for your plant in a short session.
Does the data stay inside our plant?
Yes. iFactory runs on-premise on a plant server, so quality and process data remain on site and under your control.
Ask support about data handling and network setup.
Give Every Shift One Clear Quality View
Book a session to see iFactory AI turn your yield, scrap and alert data into one dashboard managers trust.