First Pass Yield Analytics with AI Quality Tracking
By James Smith on August 5, 2026
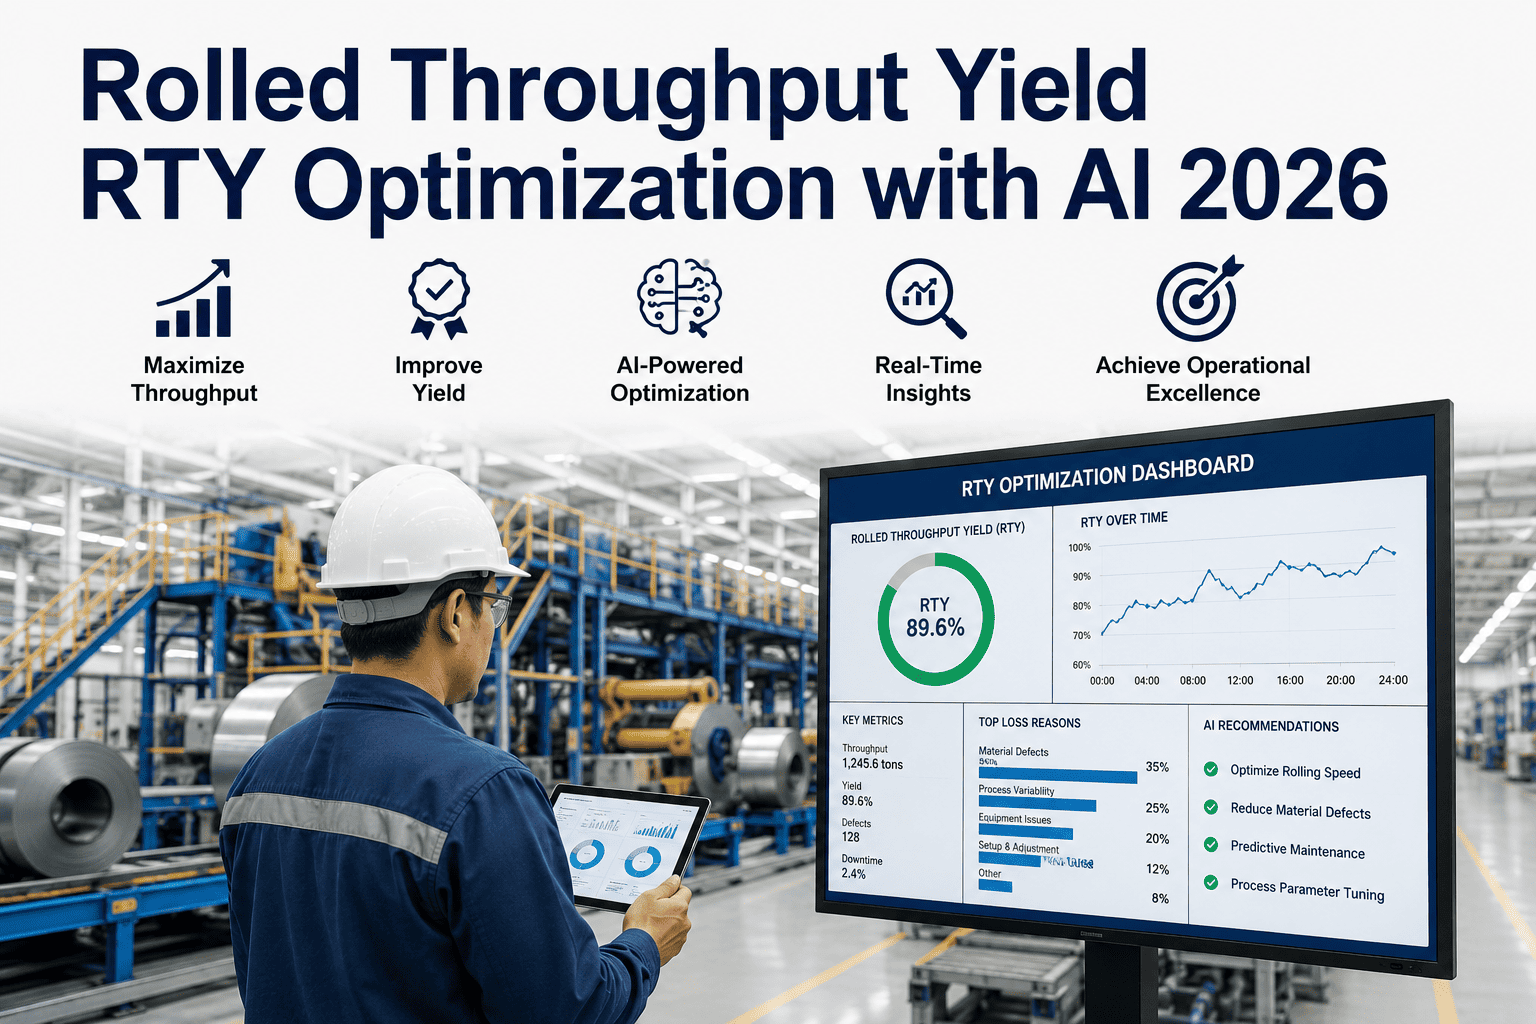
Four process steps, each running a respectable 95% first pass yield, look like a healthy line on paper. Multiply those four numbers together — because that's what actually happens to a unit traveling through all four steps sequentially — and the true end-to-end yield drops to roughly 81.5%. Nearly one in five units requires rework or rejection somewhere along the way, a fact invisible to anyone looking at each station's individual yield number in isolation. This compounding effect, called Rolled Throughput Yield, is the calculation most quality programs never run, and it's usually the gap between a Quality Manager's confident FPY report and a plant that's quietly running a second, unofficial rework factory in parallel with the real one — consuming real capacity and real labor hours that never show up as their own line item anywhere. See how iFactory calculates true first pass yield and rolled throughput yield automatically from inline inspection and rework event data, by line, shift, and product.
Quality Management & SPC Analytics · First Pass Yield
First Pass Yield Analytics with AI Quality Tracking
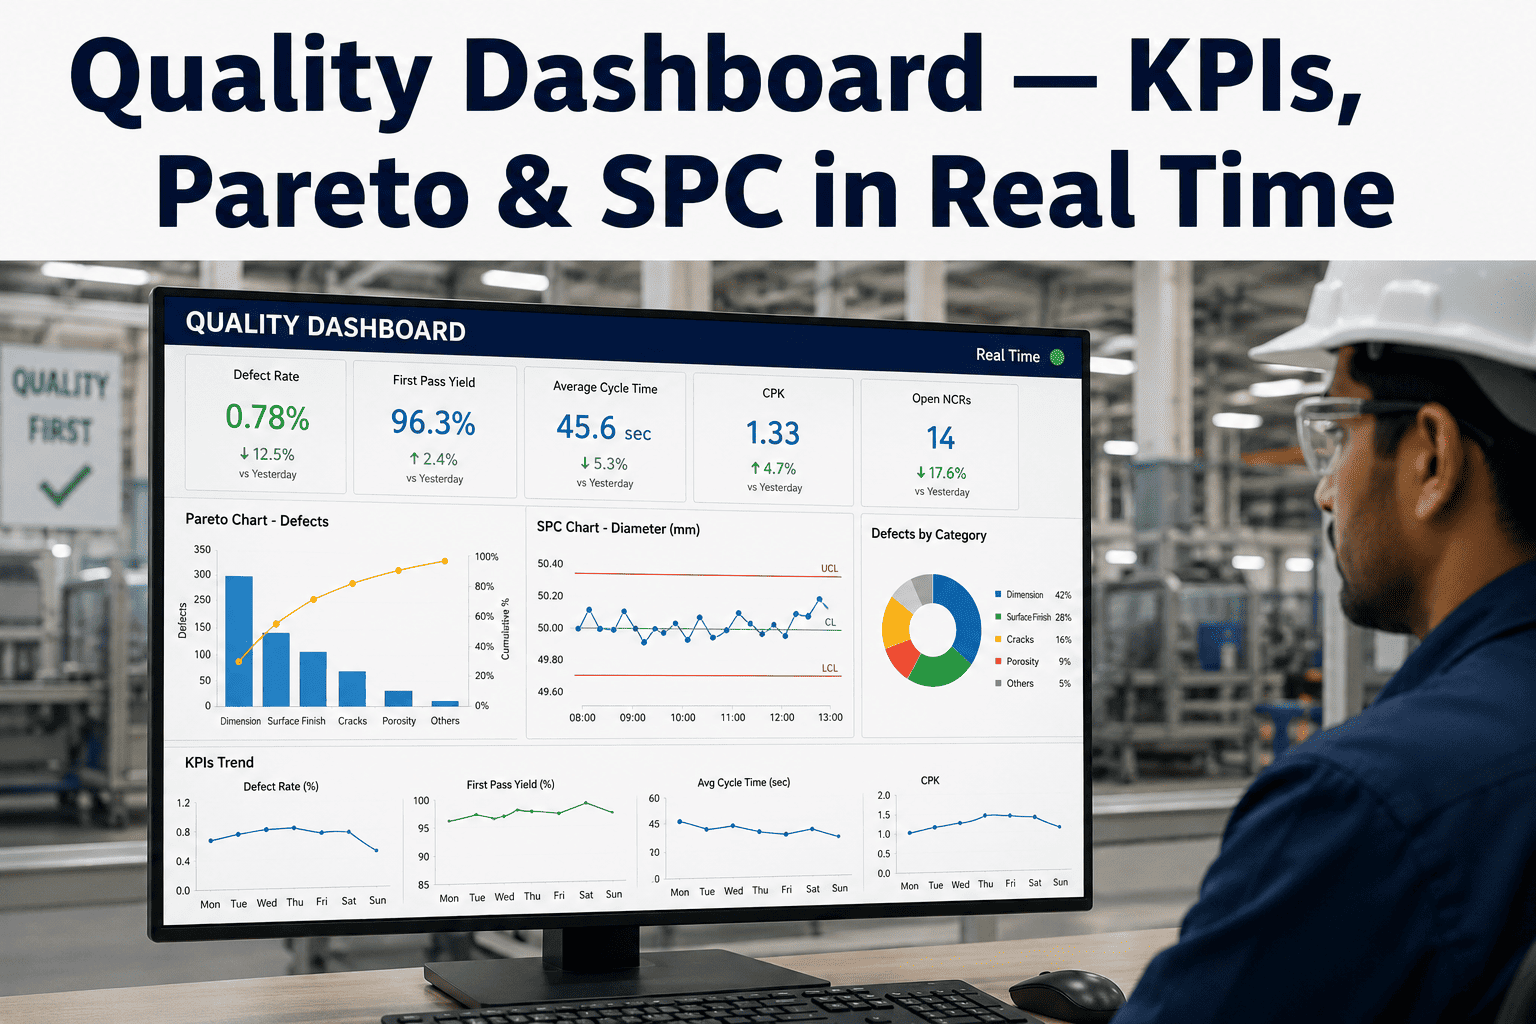
Right-first-time rates by line, product, and shift — plus the Rolled Throughput Yield calculation that reveals how small per-step losses compound into a much larger hidden rework problem most quality reports never surface.
Four steps at 95% FPY each compounds to roughly 81.5% true end-to-end yield
FPY ≠ FinalReworked units still count as loss under FPY, not final yield
RTY = ∏FPYMultiply every step's FPY to get true process yield
Hidden factoryRework capacity running in parallel with real production
3 dimensionsLine, shift, and product — sliced together
What FPY Actually Measures
The Calculation Error That Inflates Nearly Every Reported FPY Number
First Pass Yield is the percentage of units that move through a process step correctly on the first try — no rework, no repair, no scrap. The formula is precise: FPY equals good units output minus reworked units, divided by units in. The most common error in practice is dropping the "minus reworked units" term entirely, which quietly converts FPY into ordinary final yield — a materially different and more flattering number.
Correct FPY Calculation
FPY = (Good Units Out − Reworked Units) ÷ Units In
A CNC cell starts 200 housings, finishes 195 to spec, and 12 of those 195 required a second pass to remove burrs. FPY is (195 − 12) ÷ 200 = 91.5 percent.
The Common Error — Final Yield Mistaken for FPY
Final Yield = Good Units Out ÷ Units In (no rework subtraction)
The same cell, calculated without subtracting reworked units, reports 195 ÷ 200 = 97.5 percent — a 6-point gap that represents real rework labor and cycle time completely invisible in the inflated number.
This 6-point gap is not a rounding error or a matter of definitional preference — it is the cost of getting it right the first time, expressed as a percentage, and it disappears into labor variance and schedule slack in most plants precisely because the reported metric was never actually FPY in the first place. The fix is not a new measurement system — it's confirming the existing formula subtracts rework correctly, which is a data audit most quality teams can complete in an afternoon once they know to look for it.
The Rolled Throughput Yield Compounding Effect
Why Every Step Looking Fine Doesn't Mean the Process Is Fine
Single-step FPY is necessary but not sufficient. Most products move through several sequential operations, and yield losses compound multiplicatively, not additively — Rolled Throughput Yield captures this by multiplying every step's FPY together to calculate the true probability that a unit makes it through the entire process without any rework or rejection at any stage. This is the calculation that separates a station-level quality dashboard from a genuine picture of end-to-end process health, and it's the one most shop-floor reporting systems still don't run automatically.
This is not a hypothetical edge case — it's the standard mathematical behavior of any multi-step process, and it applies regardless of industry or product type. A five-step process would compound further; a two-step process compounds less. What stays constant is the direction of the error: reporting station-level FPY figures without calculating RTY will always overstate true process performance, and the more sequential steps a product passes through, the larger that overstatement becomes.
Every Station Looks Fine. The Process Might Not.
RTY Is the Multiplication Most Quality Reports Never Run
iFactory calculates FPY correctly at every station and rolls it up into true end-to-end RTY automatically — no manual spreadsheet multiplication required.
Rework Capacity Running in Parallel With Real Production
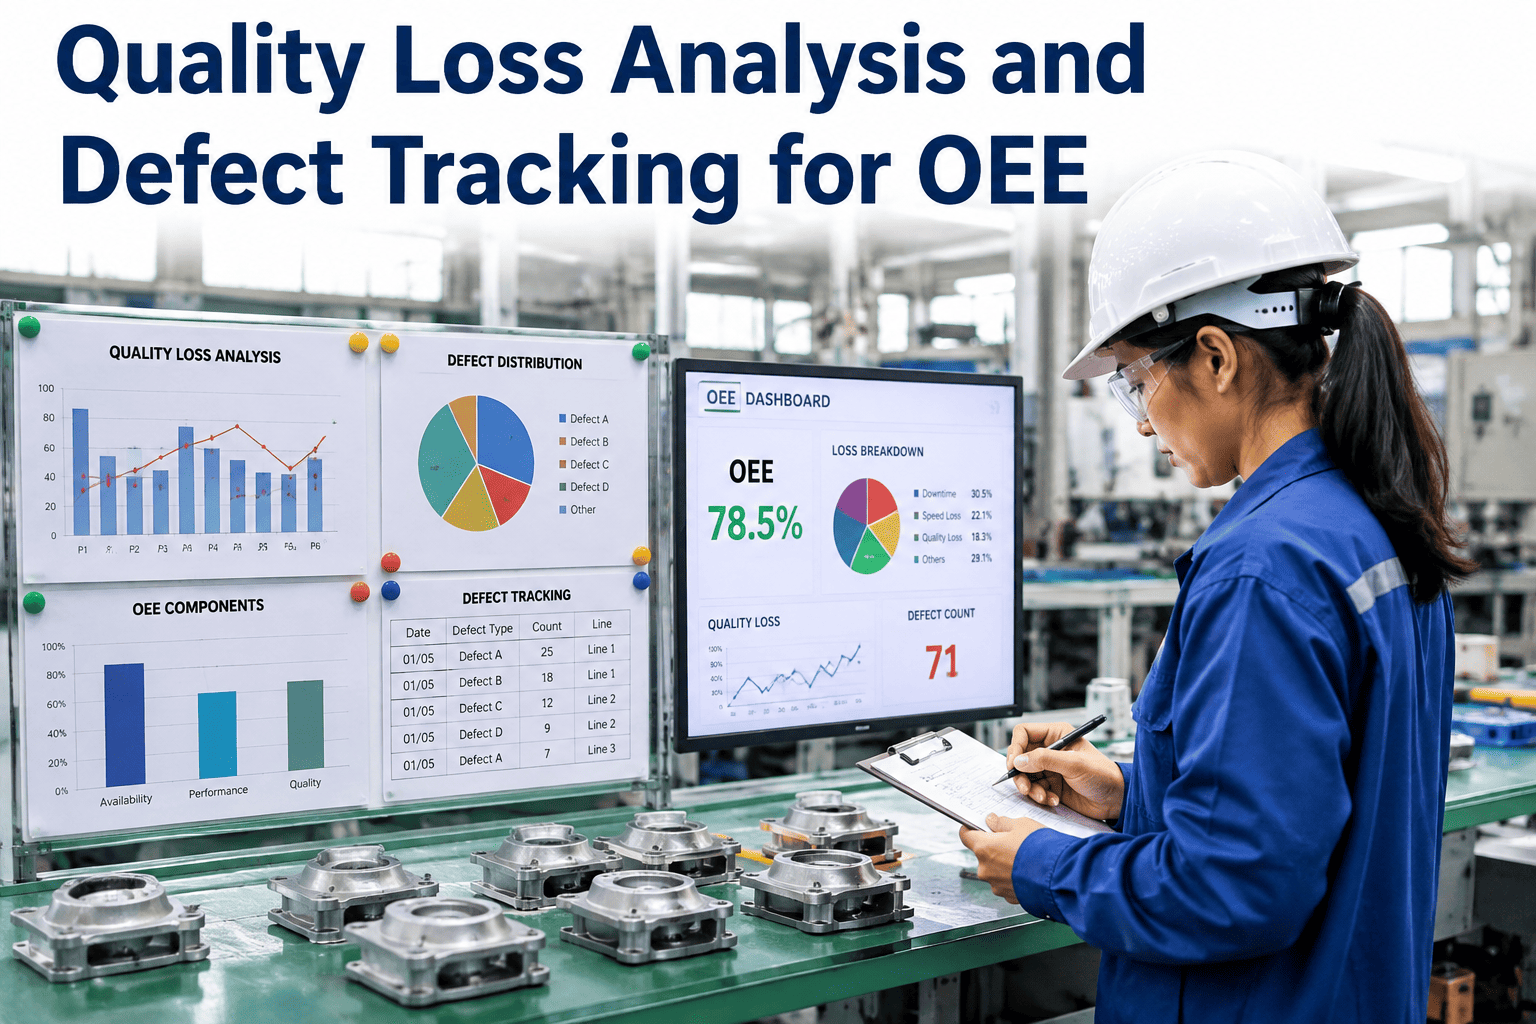
A plant reporting 90% FPY alongside a comfortable 98% final yield looks healthy at a glance — but that 8-point gap means roughly 8 percent of total production capacity is being consumed by rework, invisibly, every single day. This gap is sometimes called the hidden factory: a parallel rework operation that disrupts scheduling, extends cycle times, inflates work-in-process, and delays other orders, without ever appearing as its own line item on a capacity plan. Recognizing the hidden factory is the first step toward actually costing it, rather than accepting it as an unavoidable background cost of doing business.
Why It Stays Hidden
Rework loops rarely get logged as a distinct, trackable event — a part that fails inspection, gets corrected, and passes on the second attempt often just disappears back into the normal flow, with only the delay showing up anywhere, usually attributed to something else entirely.
Why It Compounds
A unit can cycle through inspect-rework-reinspect more than once, and each additional pass consumes capacity that a single FPY percentage doesn't capture — the true cost is a function of both how often rework happens and how many cycles a typical reworked unit requires.
Why It Matters for Capacity Planning
Lost capacity cost can be estimated directly: (1 − FPY) multiplied by constraint hours available multiplied by throughput dollars per constraint hour — a calculation most cost-of-poor-quality models include but few plants actually run against their real FPY figure.
Worked Example
From Individually Acceptable Steps to a Concerning True Yield
The scenario below uses a realistic four-station assembly process to show how individually acceptable FPY figures compound into an RTY that changes the entire quality conversation — and, importantly, how that gap would remain completely invisible to a review process that only checked each station's dashboard independently.
True end-to-end RTY (0.965 × 0.972 × 0.958 × 0.981)~88.2% — not the ~97% a quick glance at any single station suggests
Every station in this example individually clears 95 percent — a threshold many quality dashboards color green without further comment. The RTY calculation reveals that nearly 12 out of every 100 units require rework or rejection somewhere across the four stations, a materially different risk picture than four green checkmarks suggests, and precisely the kind of gap that a Quality Manager needs surfaced automatically rather than discovered during a customer escape investigation.
FPY and Process Capability
Distinguishing an Operator Problem From a Process That Can't Meet Spec
A low FPY number alone doesn't tell a QA engineer why a station is underperforming — it could be operator-to-operator inconsistency, a tool or fixture issue, or a process that is fundamentally incapable of holding the required tolerance regardless of who's running it. Pairing FPY trend data with process capability indices, particularly Cpk, is what separates a coaching conversation from a process redesign conversation.
Low FPY, High Cpk
The process is statistically capable of meeting spec, but something outside the process itself — operator technique, a specific shift, inconsistent material lots — is driving the yield loss. This pattern points toward training, standardization, or supply consistency as the fix, not equipment or tooling changes.
Low FPY, Low Cpk
The process itself is not centered or not tight enough to reliably meet specification, regardless of operator skill. No amount of training will fix a station where the natural process variation exceeds the tolerance band — this pattern points toward tooling, fixturing, or equipment capability as the actual constraint.
Getting Started
Building an Accurate FPY and RTY Program
These four steps address the specific gaps that most commonly separate a reported FPY number from the true first-pass performance of the process, starting with the calculation itself before moving to the multi-station analysis that reveals the full picture.
01
Confirm Rework Is Actually Being Subtracted From the FPY Calculation
Audit the current FPY formula in use against the correct definition — good units minus reworked units, divided by units in — since many shop-floor systems silently calculate final yield and label it FPY, producing a materially inflated number.
02
Log Every Rework Event as Its Own Occurrence
Capture rework as a distinct, timestamped event rather than letting it disappear into the normal production flow — this is the data foundation the entire FPY and hidden-factory calculation depends on, and it's the step most commonly skipped.
03
Calculate RTY Across Every Sequential Process, Not Just Individual Stations
Multiply station-level FPY figures together for every product's actual process route — a product skipping certain optional stations has a different RTY calculation than one passing through all of them, so route-specific RTY matters more than a single plant-wide average.
04
Prioritize the Lowest-FPY Station, Not the Most Visible One
Because RTY is multiplicative, the station with the lowest individual FPY has an outsized effect on the overall result — identifying and improving that specific station delivers more RTY improvement than spreading effort evenly across every station in the process.
Field Perspective
“
The RTY conversation is the one that changes how a plant manager thinks about quality, every single time I've run it. Show someone four stations each hitting 96 to 98 percent and they nod — that all looks fine. Multiply those numbers together in front of them and watch the number drop into the mid-eighties, and suddenly the tone in the room changes. That gap is not a rounding error, it's the rework happening every day that never gets its own line on anyone's report. I've seen plants discover their true RTY was in the low eighties after believing for years they were running a high-nineties operation, purely because nobody had ever done the multiplication. The math isn't hard. It's just never been run, and once it is, it's very hard to go back to only looking at station-level FPY again.
Simone Achterberg-Reyes
Quality Manager & Six Sigma Black Belt · 16 years leading quality programs across multi-station assembly and electronics manufacturing
Common Questions
Frequently Asked Questions
What's the actual difference between first pass yield and final yield?
First pass yield measures the percentage of units that pass through a process step correctly on the first attempt — good units minus reworked units, divided by units in — while final yield simply measures good units out divided by units in, without subtracting units that required rework along the way. A part that failed inspection, was corrected, and eventually passed counts as a loss under the FPY definition but looks identical to a part that passed the first time under final yield. This distinction matters because final yield can look healthy — often above 95 percent — while FPY reveals a materially lower number that reflects the true rework cost the plant is absorbing. Book an FPY assessment to confirm which calculation your current quality reporting actually uses.
Why does multiplying FPY values across process steps produce such a dramatically lower number than any single step?
Because yield losses compound multiplicatively as a unit moves through sequential steps — a unit has to survive every single station without needing rework to count as a true first-pass success, and the probability of surviving all stations is the product of each station's individual survival probability, not an average. Four stations each at 95 percent FPY individually look strong, but the probability of a specific unit clearing all four without any rework is 0.95 raised to the fourth power, which works out to roughly 81.5 percent — a gap of over 13 percentage points that a station-by-station review would never surface, since each station in isolation appears to be performing well.
How do we calculate the actual cost of a hidden rework factory once we know our true FPY?
A commonly used estimate for the lost capacity component of cost of poor quality is (1 minus FPY) multiplied by constraint hours available multiplied by throughput dollars per constraint hour, which converts the yield gap directly into a capacity and revenue figure rather than leaving it as an abstract percentage. This lost capacity cost sits alongside direct scrap cost, rework labor cost, additional inspection cost, and warranty cost as components of total cost of poor quality, and it's frequently the largest and least visible component because it reflects capacity that could have produced additional good units rather than a direct cash outlay.
Should RTY be calculated the same way for every product, or does it vary by process route?
RTY should be calculated against each product's actual sequential process route rather than applied as a single plant-wide average, since two products that share some stations but skip others will have genuinely different true end-to-end yields even if every individual station's FPY stays constant. A product passing through five stations has more compounding opportunity for yield loss than a product passing through three of those same five, and averaging RTY across product families with different routes can mask which specific product-route combinations actually carry the highest hidden rework risk. Talk to solutions engineering about calculating route-specific RTY for your actual product mix rather than a blended plant average.
Which station should get improvement priority when RTY reveals a compounding yield problem?
Because RTY is a multiplicative calculation, the station with the lowest individual FPY typically has the largest impact on overall process yield, and improving that specific station delivers more RTY gain than spreading improvement effort evenly across every station in the line. This is a straightforward consequence of multiplication — raising the lowest number in a multiplied sequence moves the product more than raising a number that's already relatively high — which makes RTY analysis a natural prioritization tool for where a limited improvement budget should go first, rather than requiring a separate ranking exercise.
Stop Multiplying Yield by Hand
Correct FPY, Automatic RTY, and the Hidden Rework Your Reports Are Missing
iFactory tracks first pass yield correctly at every station — subtracting rework the way the metric actually requires — and rolls it up into true end-to-end RTY by line, shift, and product route, automatically.