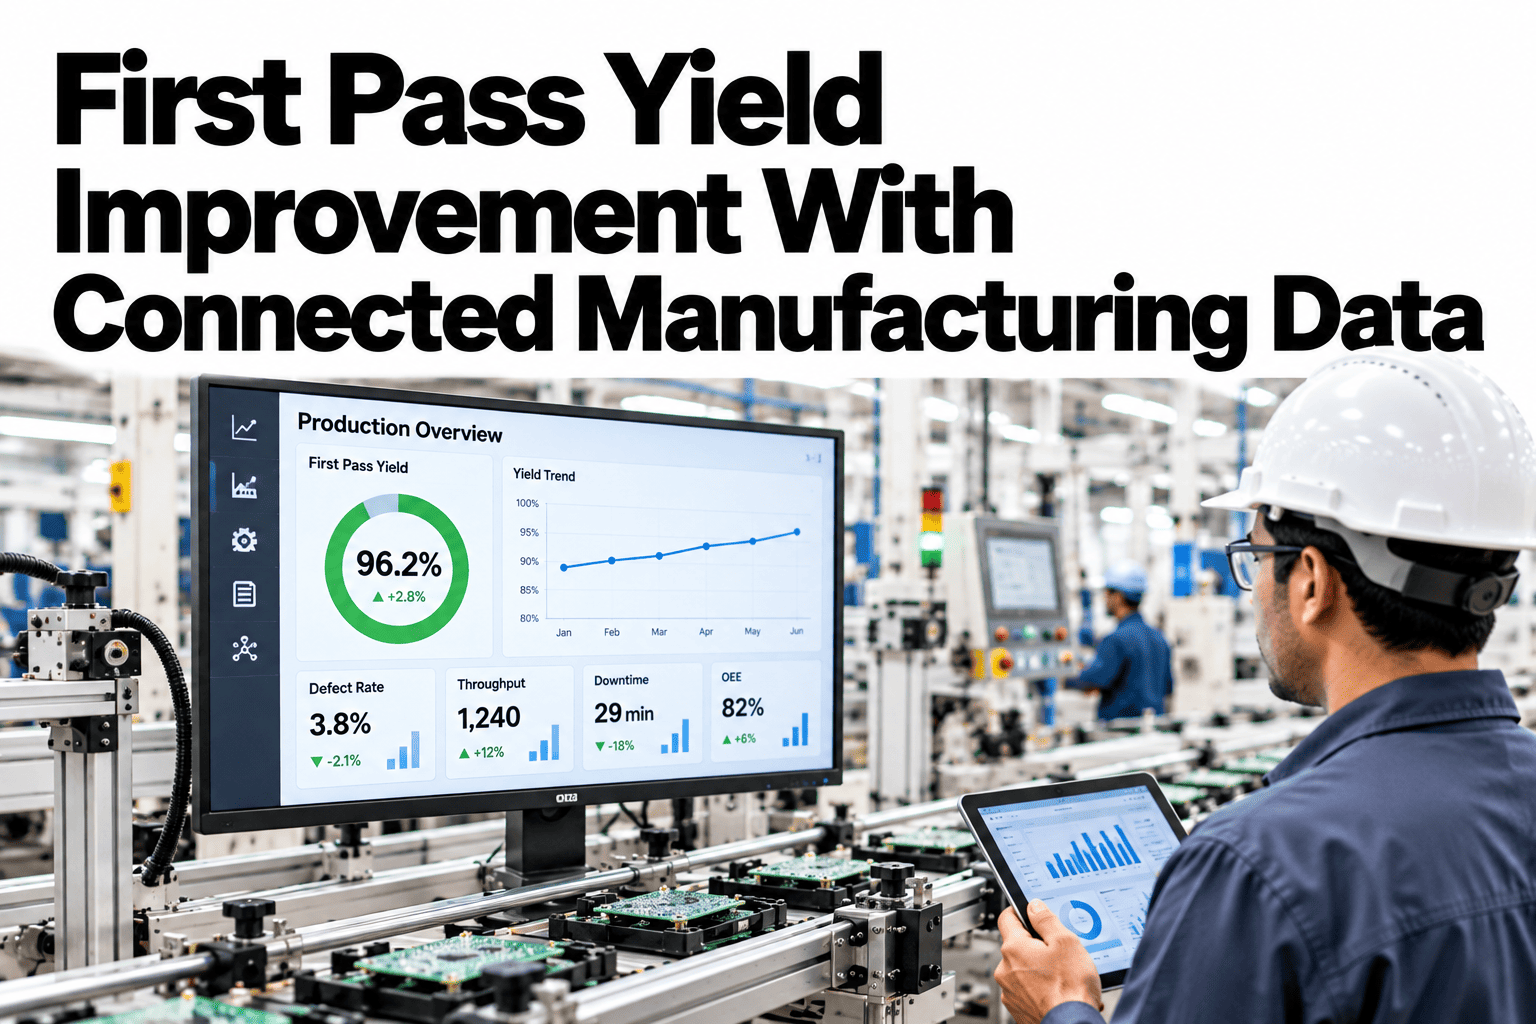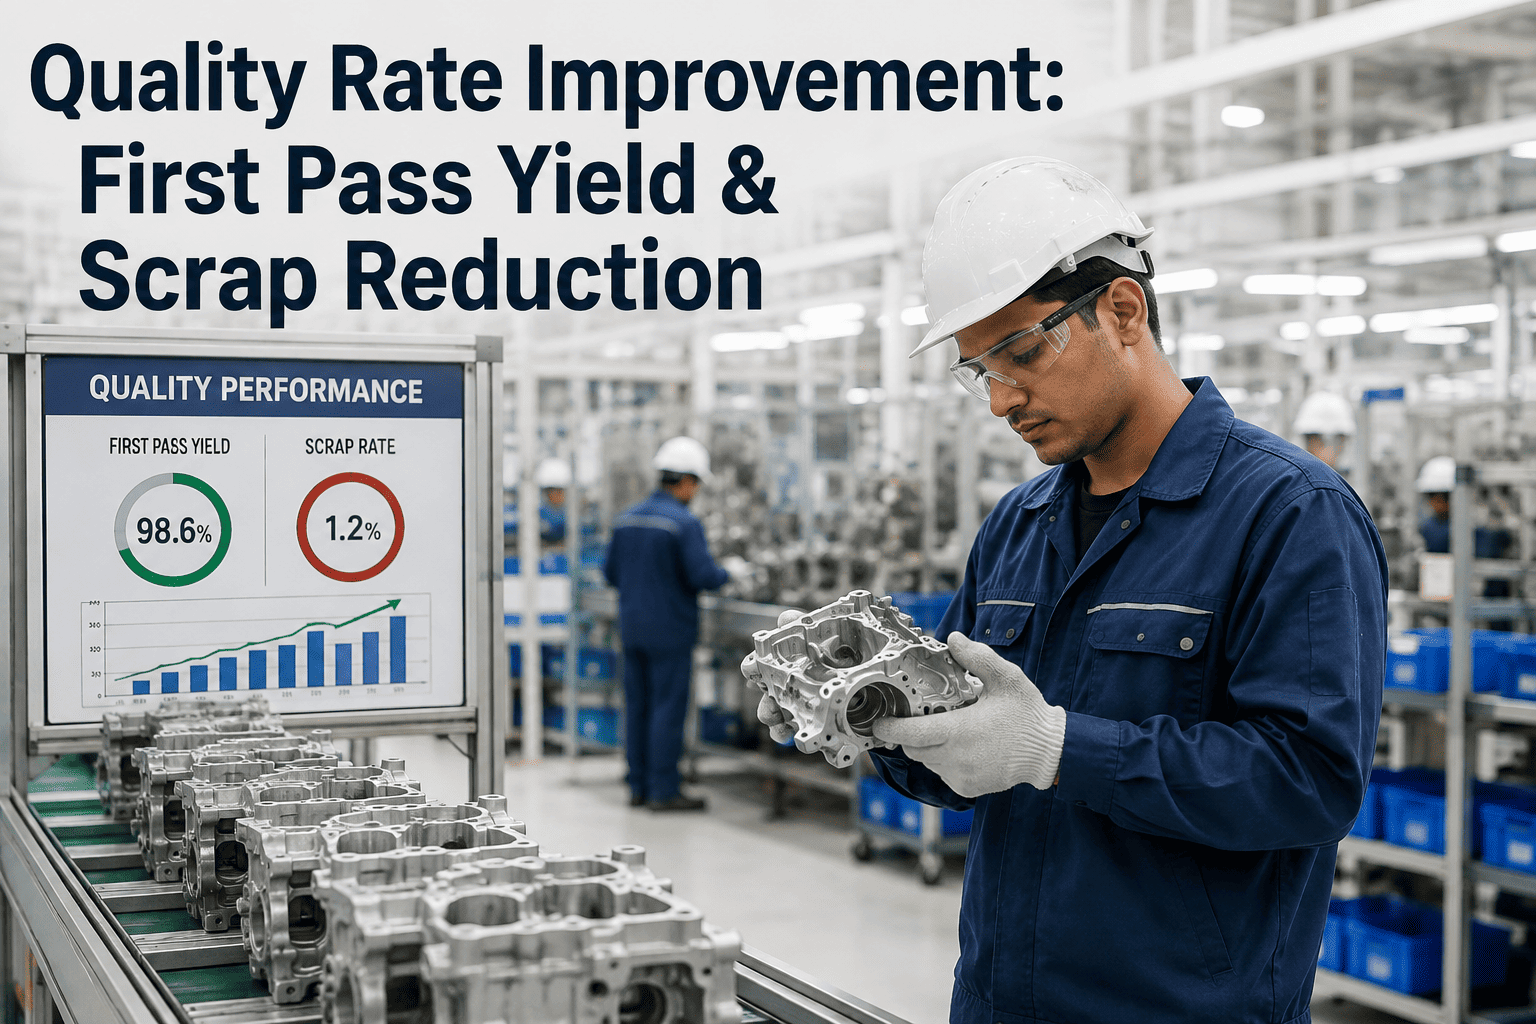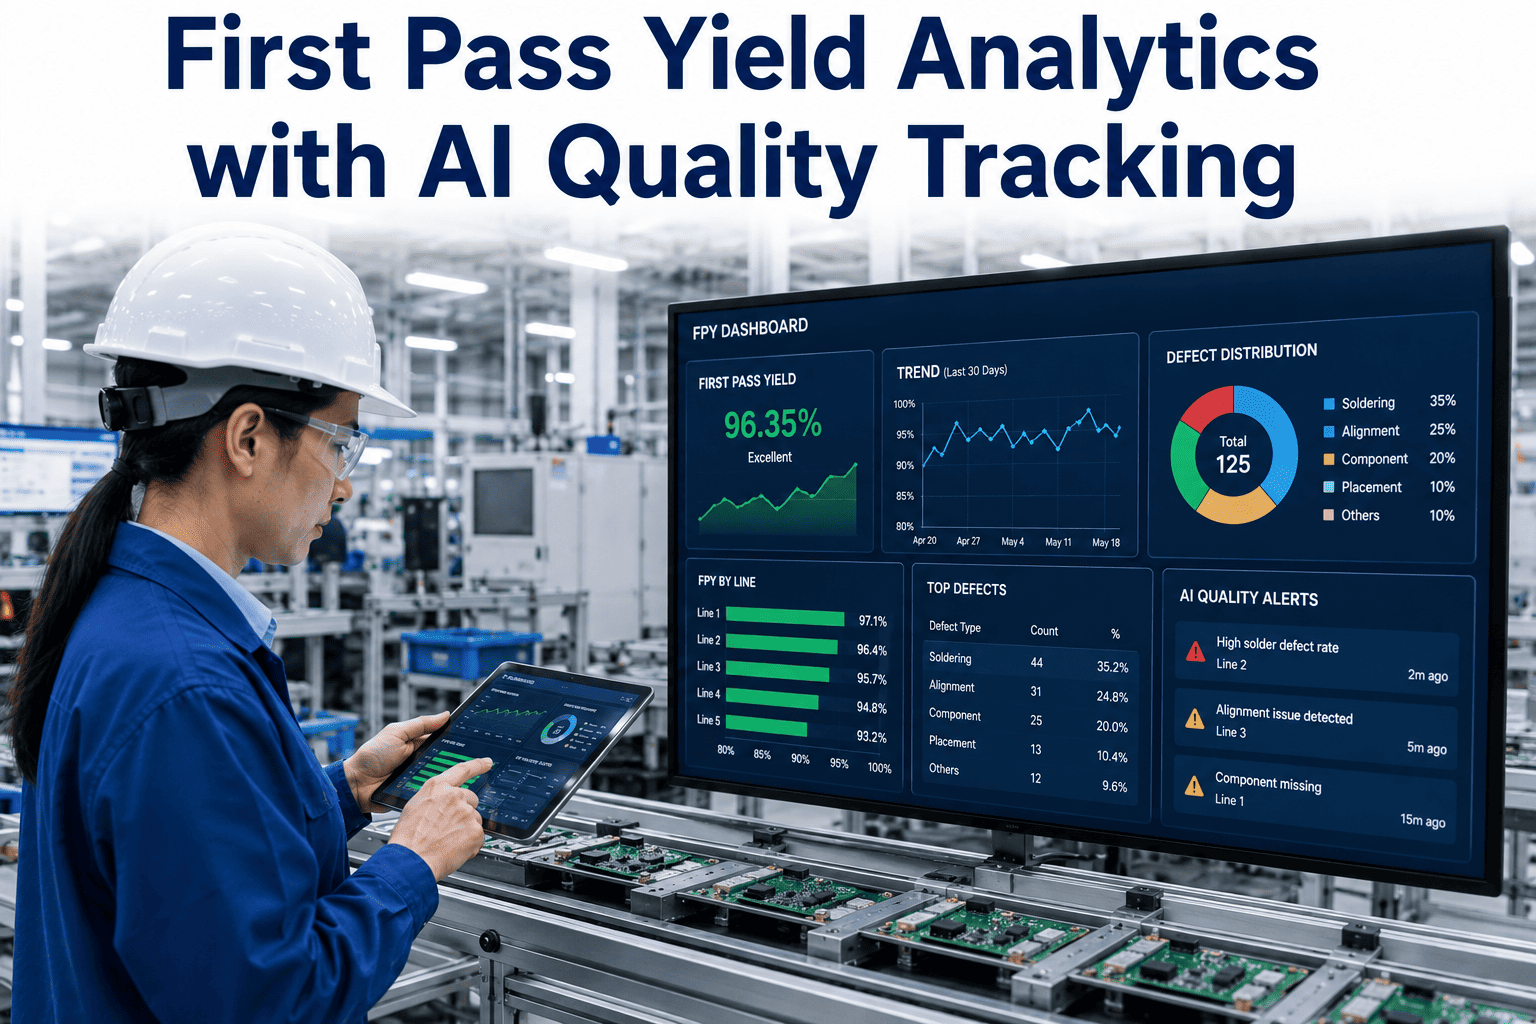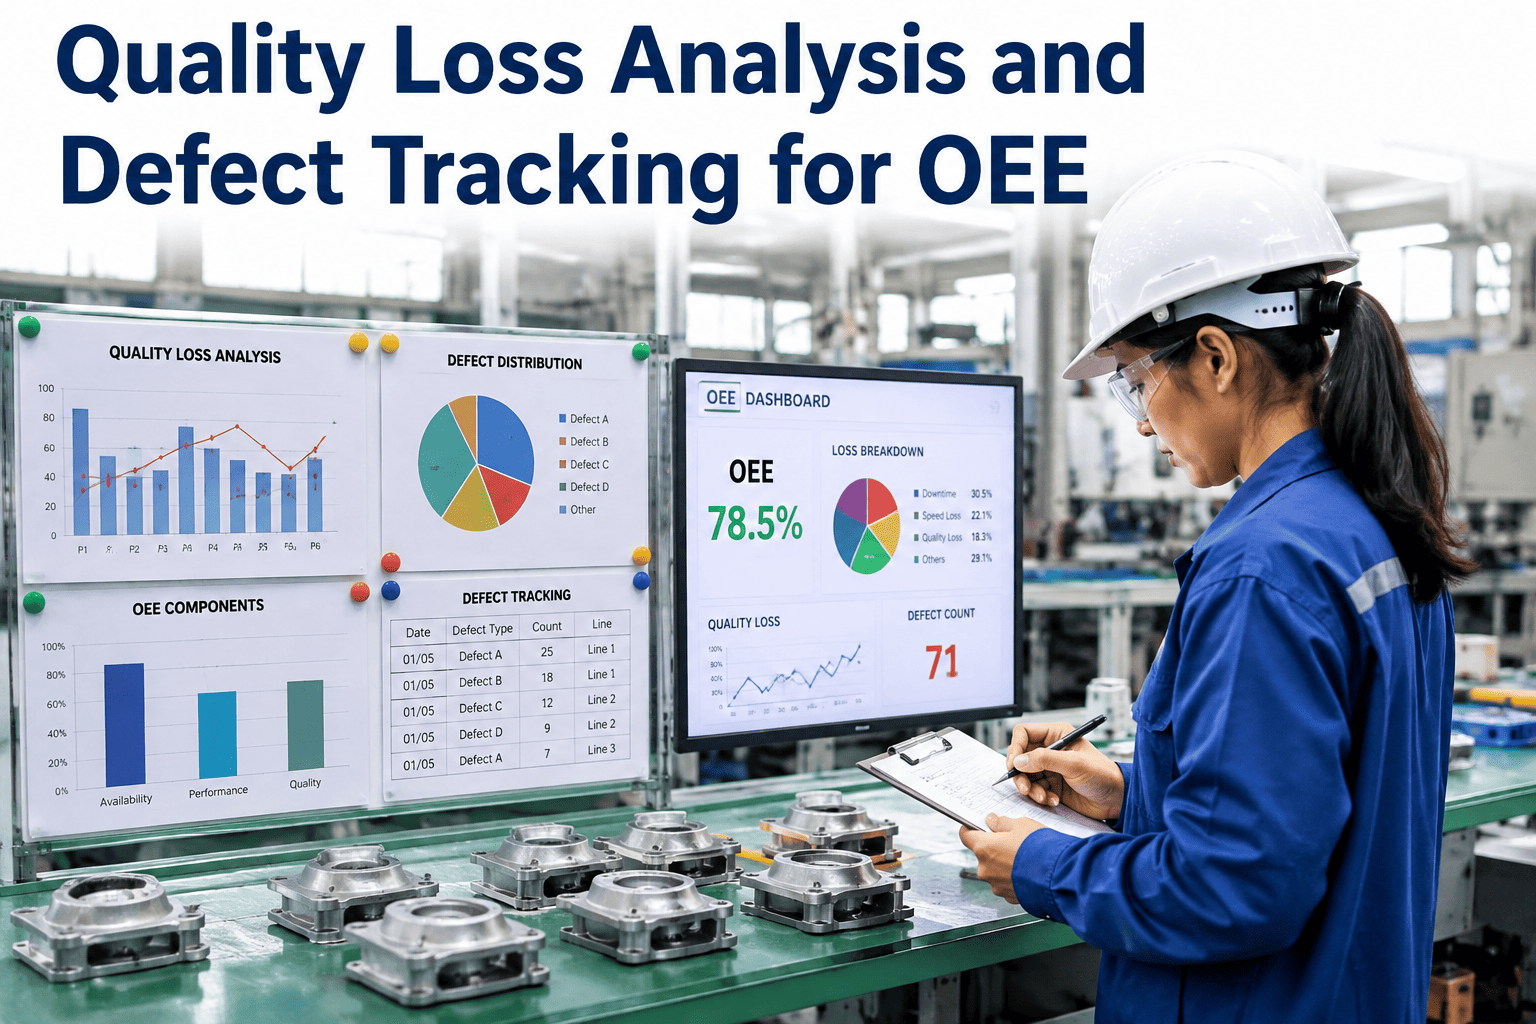
A line running at high speed with strong uptime looks like a success story on a standard OEE report, right up until someone asks how much of that output actually passed inspection the first time. OEE's quality factor often gets calculated from a plant-wide scrap percentage that arrives days after the fact, disconnected from the specific shift, station or product that produced it. First pass yield, tracked at the same resolution as availability and performance, closes that gap and surfaces an uncomfortable truth some lines would rather not see: a line running fast while quietly producing rework is not actually running well. Quality managers rethinking how yield connects to OEE can see first pass yield tracked inside the OEE conversation live before the next production review buries quality loss in a footnote.
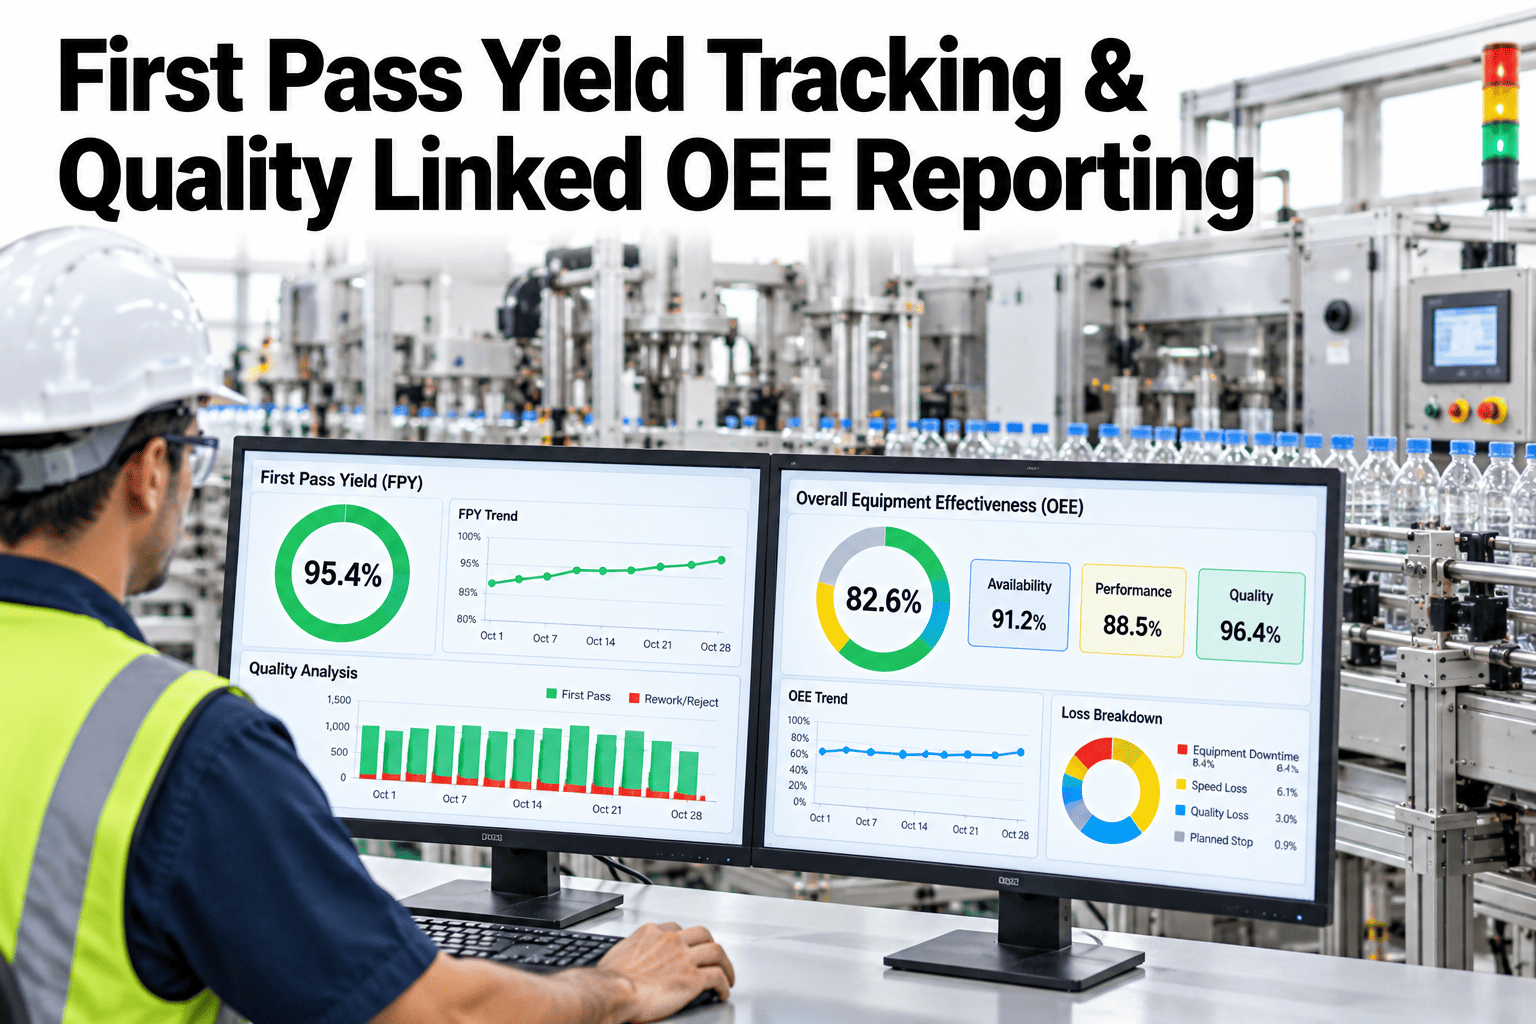
First Pass Yield Tracking & Quality Linked OEE Reporting
FPY tracked at the same resolution as availability and performance, not buried in a separate quality report.
Why Quality Loss Hides Inside a Speed Story
OEE's three factors are not weighted equally in most production conversations.
A plant-wide scrap percentage often arrives days after the shift that actually produced it.
Quality loss is rarely tracked by station or shift the way speed and uptime already are.
A fast, high-uptime line gets praised in review even when its quality factor is quietly weak.
Tracking FPY at the same resolution as the other two factors is what keeps quality loss from disappearing into the OEE average.
FPY vs Rolled Throughput Yield
These two related metrics answer slightly different questions and both matter for a full picture.
| Metric | What It Measures | Best Used For |
|---|---|---|
| First pass yield | Share of units passing a single process step without rework | Station or step-level quality tracking |
| Rolled throughput yield | Share of units passing every process step without rework | End-to-end line quality tracking |
See Your Own Line's Real Quality Factor
Book a 30-minute session and bring your current OEE and quality data. iFactory AI will show FPY broken out by station and shift.
What iFactory AI Supports
FPY, rework and scrap data are tracked continuously and tied directly into the OEE calculation.
Station-Level FPY
Yield is tracked by station and shift, not just as a plant-wide average.
Live Quality Factor
The OEE quality factor updates continuously from live yield data, not a lagging scrap report.
Rework vs Scrap Breakdown
Rework and scrap are tracked separately, since they carry different costs and causes.
Integrated OEE Reporting
Availability, performance and quality appear together in one production review.
iFactory AI connects quality inspection and production data into one OEE model. Scope covers data integration, station-level tracking and reporting setup.
Expert Review
The lines that look best on a traditional OEE report are sometimes the ones with the weakest real quality factor, simply because speed and uptime data update in real time while quality data lags. Bringing FPY onto the same timeline often changes which line actually tops the leaderboard.
Separating rework from scrap matters more than it first appears. A high rework rate with low scrap points at a correctable in-process issue, while high scrap with low rework points at something closer to a design or material problem, and the two deserve different responses.
Frequently Asked Questions
How does live FPY tracking differ from our current scrap reporting?
Current scrap reporting often aggregates data at the end of a shift or day, while live FPY tracking updates continuously at the station level as inspection results come in, giving a much finer-grained and more current view. See the difference in a live session.
Does this require new inspection equipment at every station?
Many stations already have inspection data from existing quality checks that can be connected to. New inspection capability is added only where a genuine gap exists in current quality data coverage. Ask support about your current inspection data sources.
Can FPY be compared across different lines or shifts?
Yes, station-level FPY data supports comparison across lines, shifts or even specific operators, which often surfaces patterns a plant-wide average would hide entirely. Request a cross-line FPY comparison.
How does this integrate with our existing OEE reporting tool?
The quality factor feeds directly into the same OEE calculation already used for availability and performance, so the existing OEE report gains a live, accurate quality component rather than requiring a separate tool. Contact support about your current OEE reporting setup.
How long before FPY data is reliable enough for the daily production meeting?
Most lines have station-level FPY data validated and ready for daily use within five to eight weeks, depending on how many inspection data sources need connecting. Book a session to estimate your own timeline.
Stop Letting Speed Hide a Weak Quality Factor
iFactory AI tracks first pass yield at the same resolution as availability and performance. Book a walkthrough on your own OEE data.