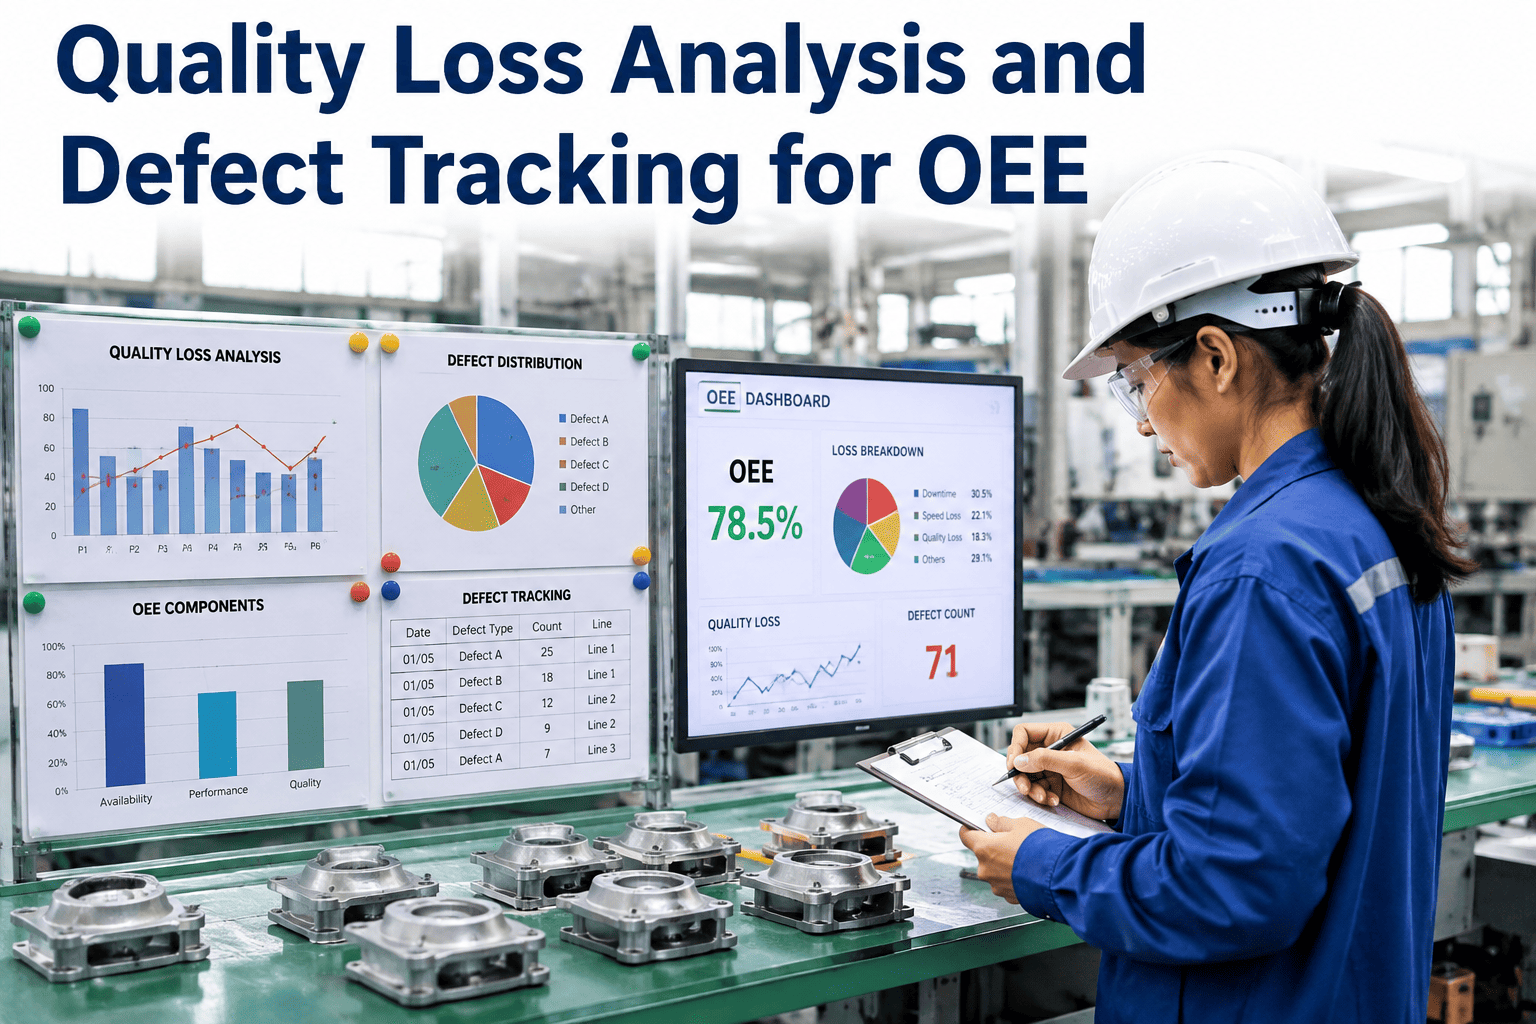
OEE has a blind spot, and it is hiding in the quality number. Overall Equipment Effectiveness multiplies three factors — Availability, Performance, and Quality — and that multiplication is brutal: a line running 90% on each scores just 73% overall, with a third of its capacity lost to the hidden factory. Most plants chase the availability and speed losses because downtime is loud and visible. The quality component gets a quick "good parts over total" calculation and a nod. But that is where the subtle, expensive losses live — and worse, standard OEE quality counts a reworked part as eventually good, so a line can show 99% OEE quality while its true first-pass yield is 85%, the gap swallowed by an invisible rework operation. Scrap is thrown away; rework quietly consumes machine time, material, and labor to fix what should never have failed. iFactory's OEE quality analytics separates those losses, exposes the hidden rework factory, and links each defect to its root cause.
iFactory Quality Analytics
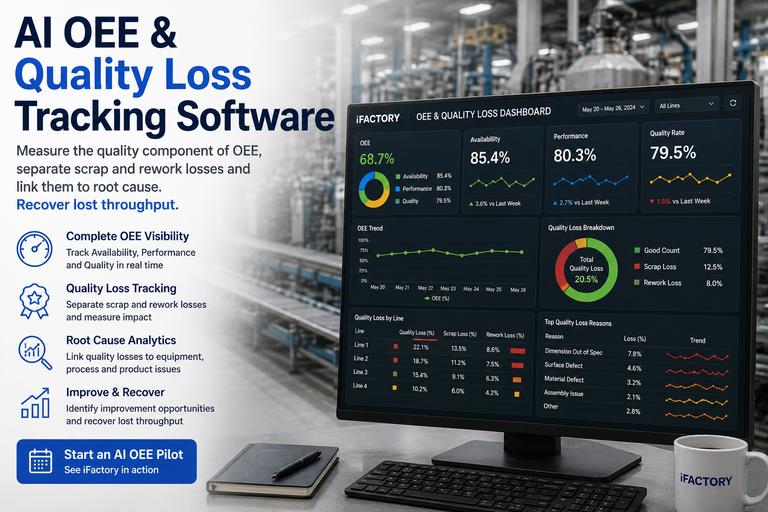
AI OEE & Quality Loss Tracking Software
Measure the quality component of OEE, separate scrap from rework, and link every loss to its root cause — so the throughput hiding in your quality number becomes throughput you recover.
The power and the cruelty of OEE is that it multiplies. Three respectable-looking scores compound into a mediocre one, and quality — the factor teams scrutinize least — drags the whole product down just as hard as downtime does. A point of quality lost is not a point off the total; it is a multiplier against everything else the line achieved. That is why the quality component deserves the same rigor as availability, not a footnote.
OEE Is a Product, Not a Sum — Quality Pulls Its Full Weight
Because the factors multiply, a quality loss is never isolated — it discounts all the availability and speed the line worked hard to earn.
Scrap and Rework Are Not the Same Loss
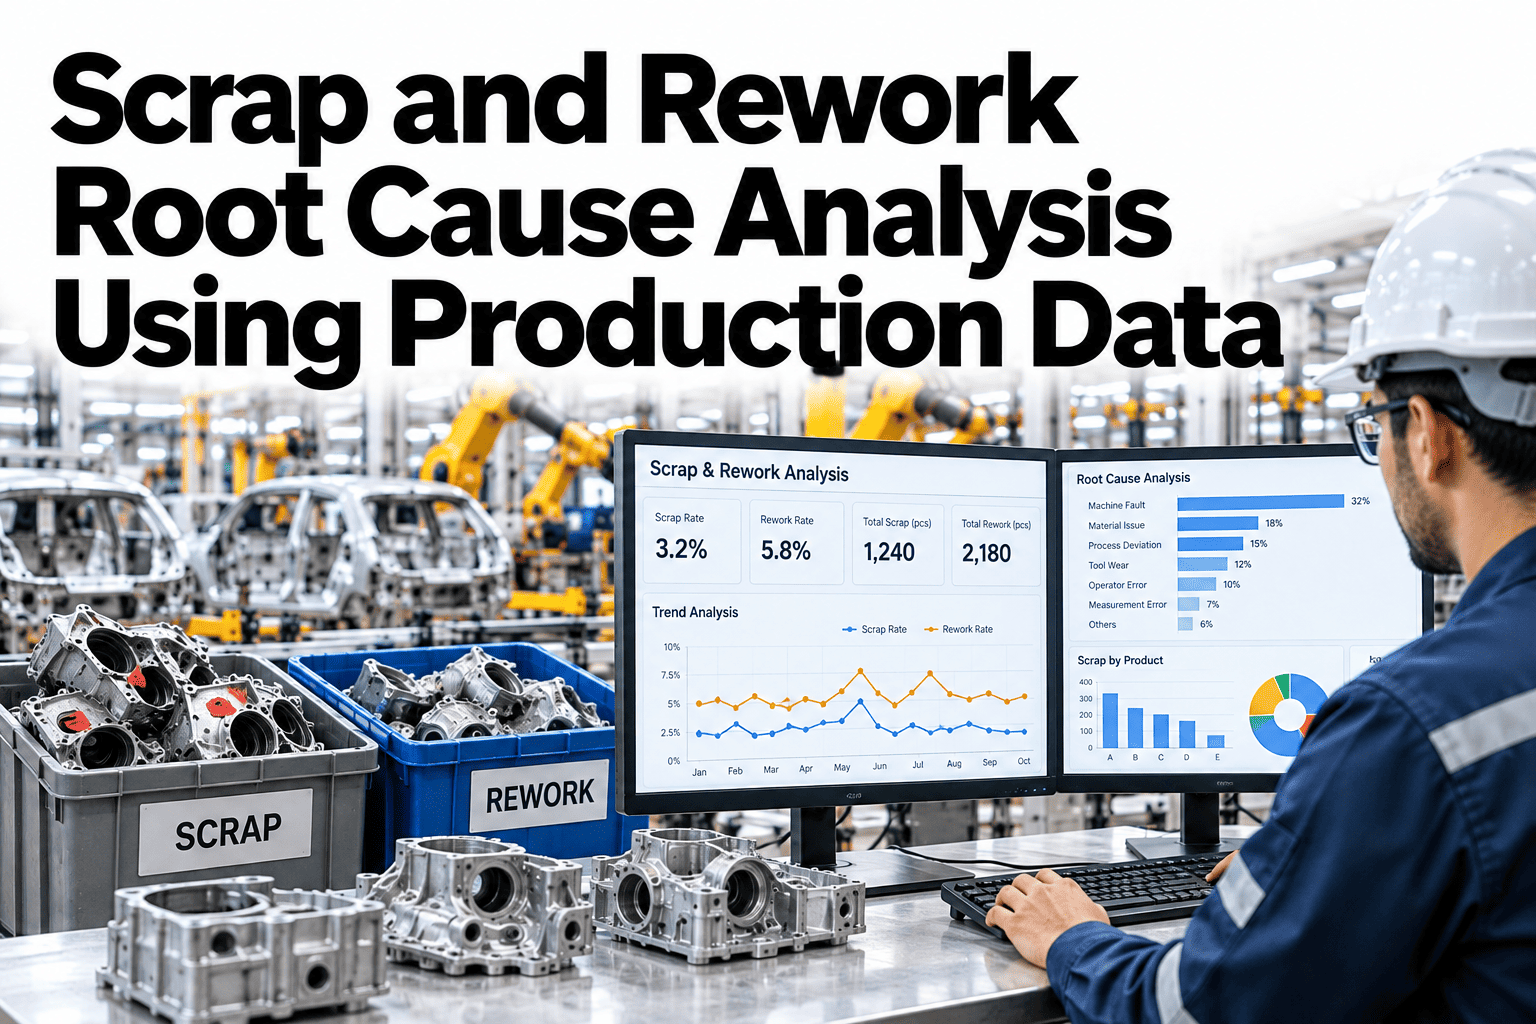
Lumping all quality loss together hides the most important distinction. A scrapped part is lost entirely — material, machine time, and labor, gone. A reworked part is recoverable, but fixing it consumes additional machine time, material, and labor, and standard OEE quietly counts it as a good part in the end. Tracking them as one number means you never see how much capacity the rework operation is silently eating.
Scrap Loss
Gone Entirely
The part fails beyond recovery. You lose the material, the machine time that made it, and the labor — and you still have to make a replacement. A direct, visible hit to yield.
Rework Loss
Recovered, but Costly
The part is salvageable, but rework burns extra machine time, material, and labor — and standard OEE counts it as eventually good, so the cost hides inside an apparently healthy quality number.
Why First-Pass Yield Tells the Truth OEE Quality Hides
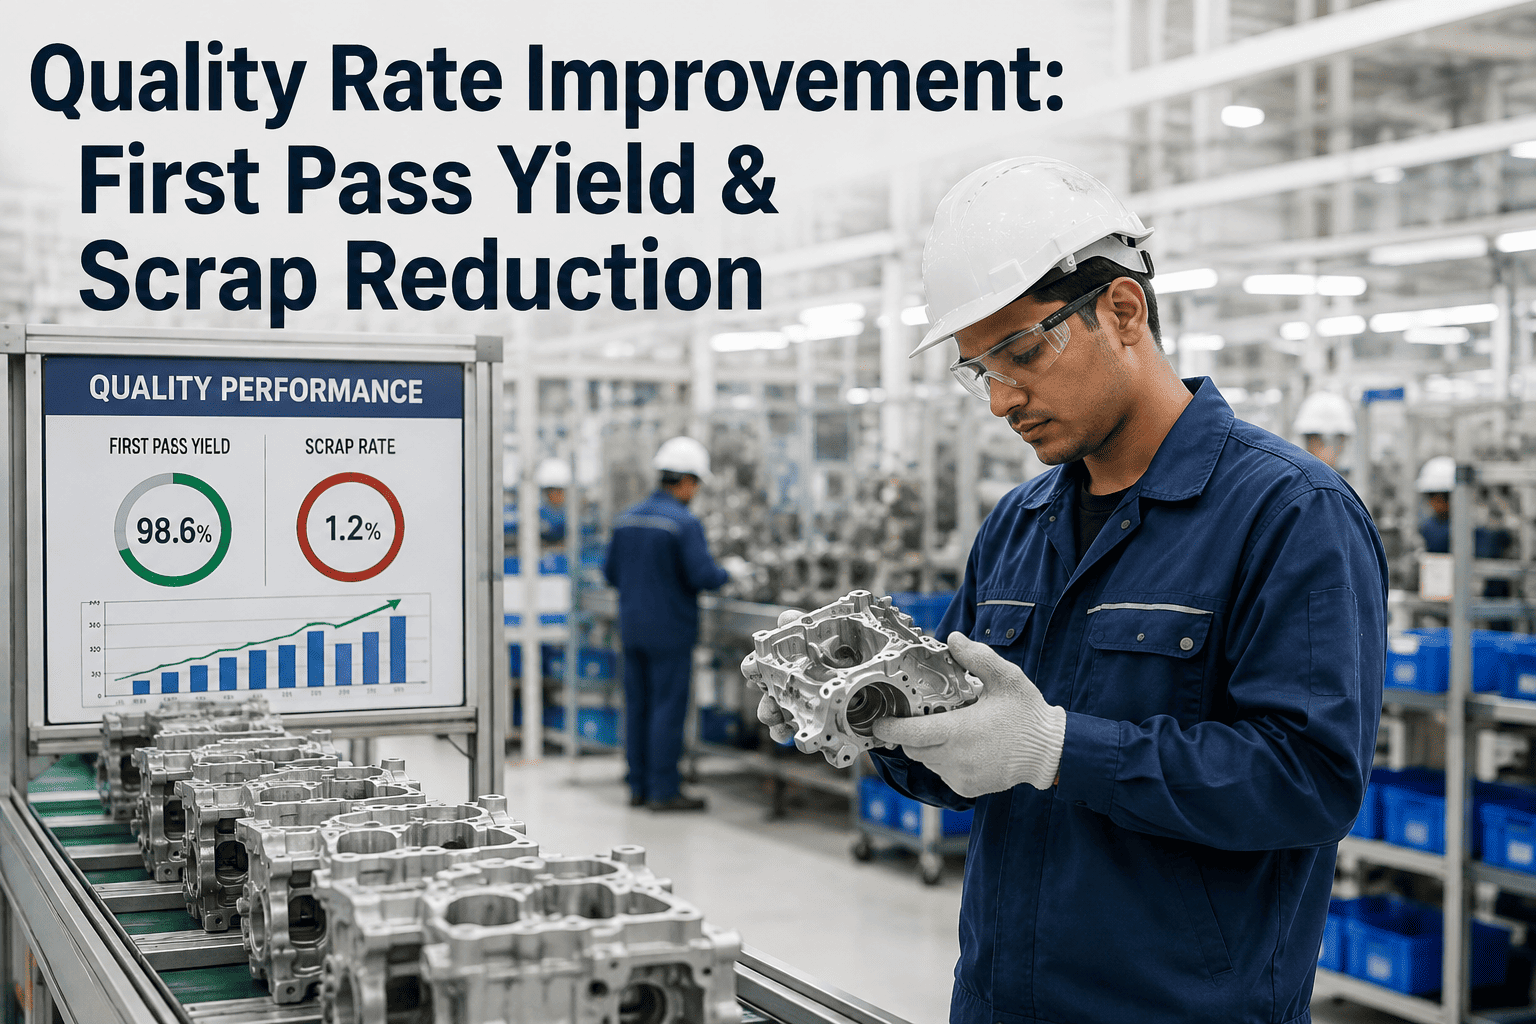
Here is the gap that surprises most teams: OEE's quality component counts a reworked part as good, because it eventually shipped. First-pass yield does not — it only credits parts that passed the first time, with no rework or repair. A line can post 99% OEE quality while its true first-pass yield is 85%, and that 14-point gap is the hidden factory: an entire shadow operation spending real capacity fixing defects that the headline number conceals.
OEE Quality vs First-Pass Yield — the Hidden Rework Factory
The amber slice is capacity spent re-fixing parts — invisible in OEE quality, exposed by first-pass yield. Tracking both is how you find it.
Want to see your true first-pass yield next to your OEE quality number? Book a 30-minute walkthrough and we'll calculate both on your production data.
From Quality Loss to Root Cause
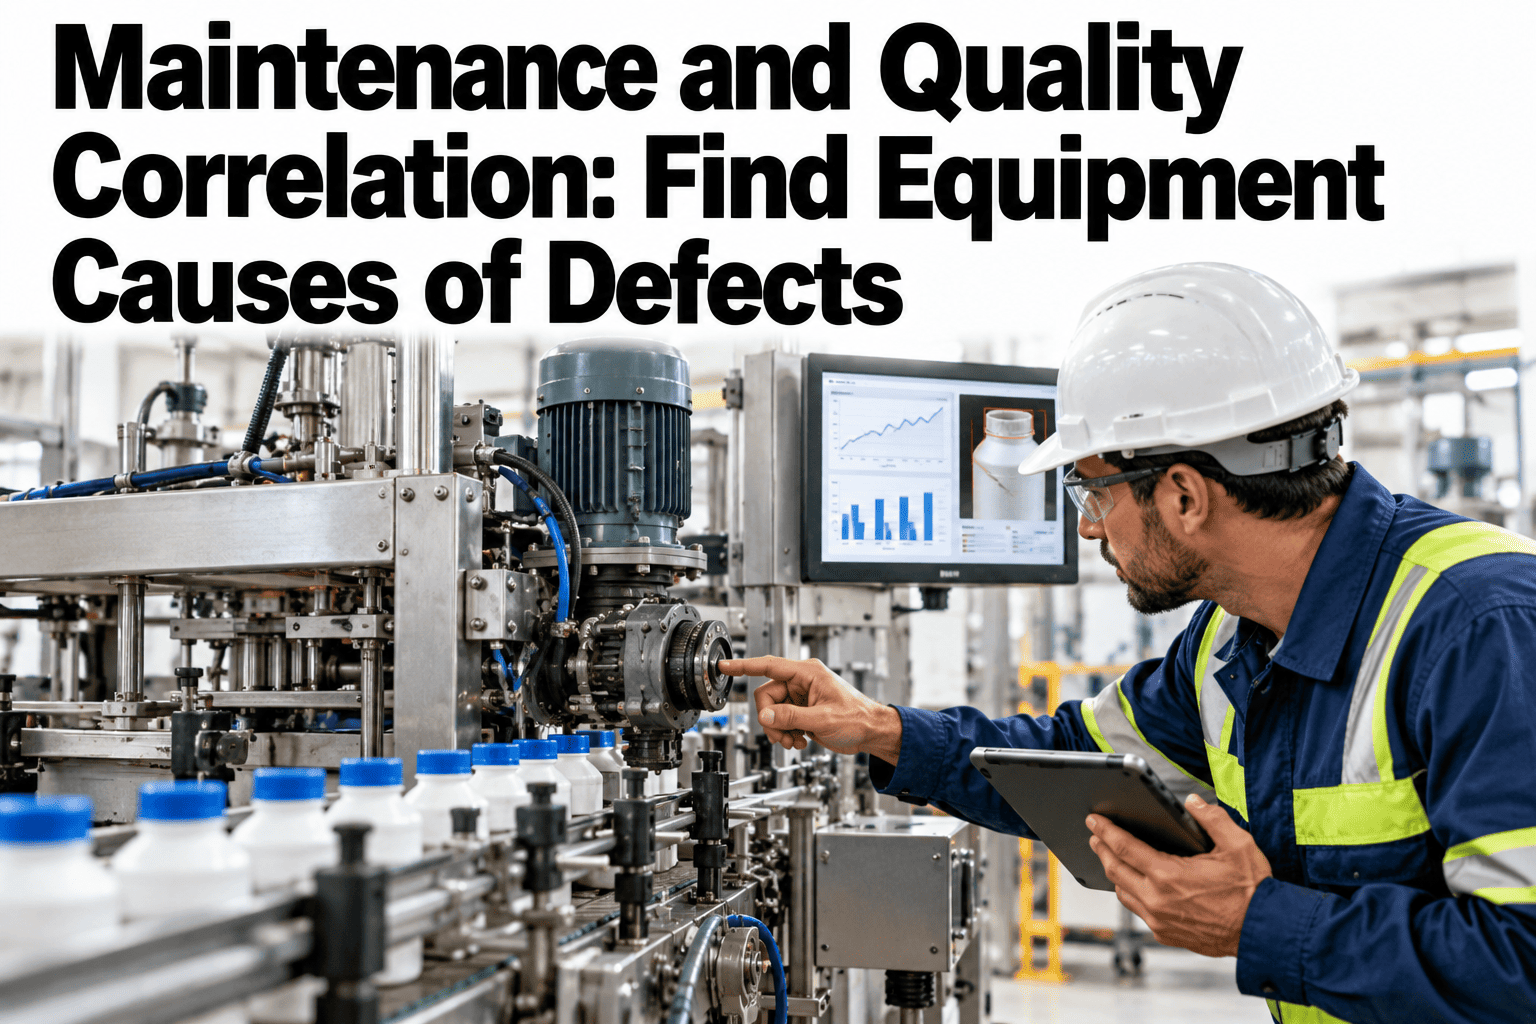
Measuring the loss is only useful if it points to a cause. The platform does not just report a quality percentage — it attributes each scrap and rework event to a defect type, a station, a shift, and a likely root cause, so the loss becomes a work list. This is where OEE quality stops being a scoreboard and starts driving the improvement.
By Defect Type
Every loss tagged to a defect category, so you see which failure modes are eating the quality number and feeding the rework queue.
By Station & Shift
Losses attributed to where and when they happened, surfacing the machine, line, or shift pattern behind a quality dip.
Startup vs Steady-State
Separates startup-reject losses from production defects — two of the Six Big Losses with very different fixes.
Linked to Action
Each recurring loss feeds root-cause investigation and a work order, closing the loop from measurement to fix.
What the Analytics Tracks
The platform turns the quality component from a once-a-shift hand calculation into a live, decomposed view. It computes the numbers continuously, separates the loss types, and benchmarks against where you should be — so the quality conversation runs on data, not assumptions.
Live Quality Rate
Good first-pass units over total started, computed continuously per machine, line, shift, and product — not a daily back-calculation.
Scrap / Rework Split
The two loss types tracked separately, so the cost of the rework operation is visible instead of buried in the quality number.
True FPY
First-pass yield alongside OEE quality, exposing the hidden-factory gap between parts that shipped and parts that were right first time.
Full OEE Context
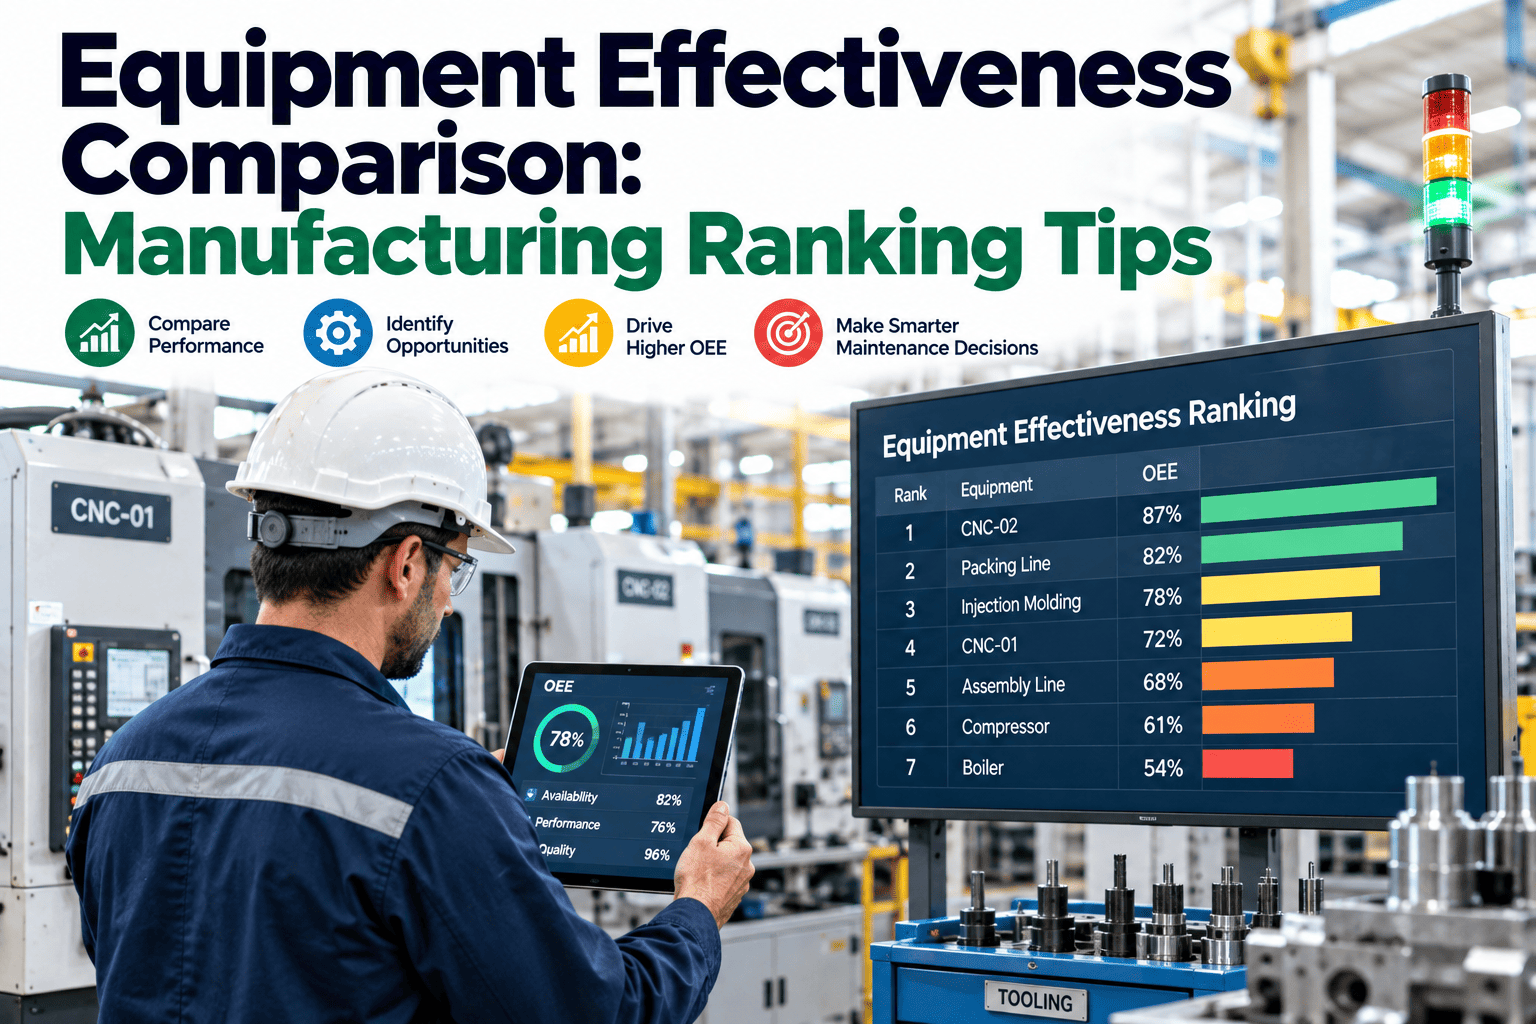
Quality shown within the Availability and Performance picture, so you see how the three losses interact rather than in isolation.
Loss Costing
Each loss carries its cost — material, machine time, labor — turning a percentage into a dollar figure that earns improvement budget.
Benchmark & Trend
Track against world-class targets and your own history, so a quality improvement shows up as a measurable, sustained shift.
Want the quality losses costed and wired to your machines so the dashboard builds itself? Talk to our quality engineers about connecting your data.
Recovering the Hidden Factory
The reason to track quality loss this precisely is that it converts directly into recovered capacity — output you get without buying a single new machine. Because a quality and rework event averages well over two hours, even a modest reduction in defect frequency returns real production time. The loop is straightforward: measure, attribute, fix, and watch the quality rate climb.
The Quality-Loss Recovery Loop
1
Measure
Decompose
Quality rate and true FPY computed live, scrap and rework split out
2
Attribute
Find the Cause
Each loss tagged to defect, station, shift, and likely root cause
3
Fix
Target the Few
Improvement effort aimed at the costliest losses, not every defect
4
Recover
Reclaim Capacity
Quality rate rises, the hidden factory shrinks, throughput returns
What Quality-Loss Tracking Delivers
The return on tracking the quality component properly is throughput recovered from capacity you already own. These figures come from OEE and quality-loss data across discrete and process manufacturing.
~1/3
Capacity in the losses
at typical OEE, a third of potential output is recoverable
~142 min
Per quality event
why the quality component needs dedicated tracking
Hidden
Rework exposed
the FPY gap OEE quality conceals, made visible
No new
Capital needed
recovered throughput from machines you already run
Every point of recovered quality is capacity you already paid for. Want it scoped to your lines and cost model? Talk to our quality engineers.
Frequently Asked Questions
How is the quality component of OEE calculated?
Quality is good units produced divided by total units started — the first-pass yield concept. It captures the productivity lost to making parts that don't meet standard the first time, including both scrap and rework. Because OEE multiplies Availability, Performance, and Quality, even a high quality score compounds against the others: 90% on all three yields just 73% OEE, so quality losses cost more than the percentage alone suggests.
Why separate scrap from rework if both are quality losses?
Because they cost differently and demand different fixes. A scrapped part is lost entirely — material, machine time, and labor gone. A reworked part is recovered, but fixing it consumes additional machine time, material, and labor, and standard OEE counts it as good in the end. Tracking them as one number hides how much capacity the rework operation eats; splitting them shows you the true cost of each and where to focus.
What's the difference between OEE quality and first-pass yield?
OEE quality counts a reworked part as good because it eventually shipped; first-pass yield only credits parts that passed the first time with no rework or repair. The result is that a line can show 99% OEE quality while its true FPY is 85% — and that gap is the hidden factory, a shadow operation spending real capacity on repairs. Tracking both together is the only way to see and recover that loss.
If quality events are rare, why dedicate tracking to them?
Because they're disproportionately expensive per event. Quality and rework events can represent a small share of total downtime yet average well over two hours each — far longer than a typical stop. That per-event cost, combined with the way OEE hides rework inside an apparently healthy quality number, is exactly why the quality component deserves dedicated, decomposed tracking rather than a single rolled-up figure.
How does tracking quality loss recover throughput?
Quality loss is recoverable capacity — output you can reclaim from machines you already own, without new capital. By measuring the quality rate live, separating scrap from rework, attributing each loss to a root cause, and fixing the costliest few, you reduce defect frequency and the rework burden. Because each quality event consumes significant machine time, even a modest reduction returns meaningful production hours, and the quality rate climbs measurably.
The Throughput Is Hiding in Your Quality Number.
See Your Quality Loss Decomposed — Start a Pilot
Bring a line and its production data. We'll compute the live quality rate, separate scrap from rework, reveal the first-pass-yield gap that OEE hides, attribute the losses to root cause, and put a cost on each — so you can see exactly how much capacity is recoverable. One line, proven first.