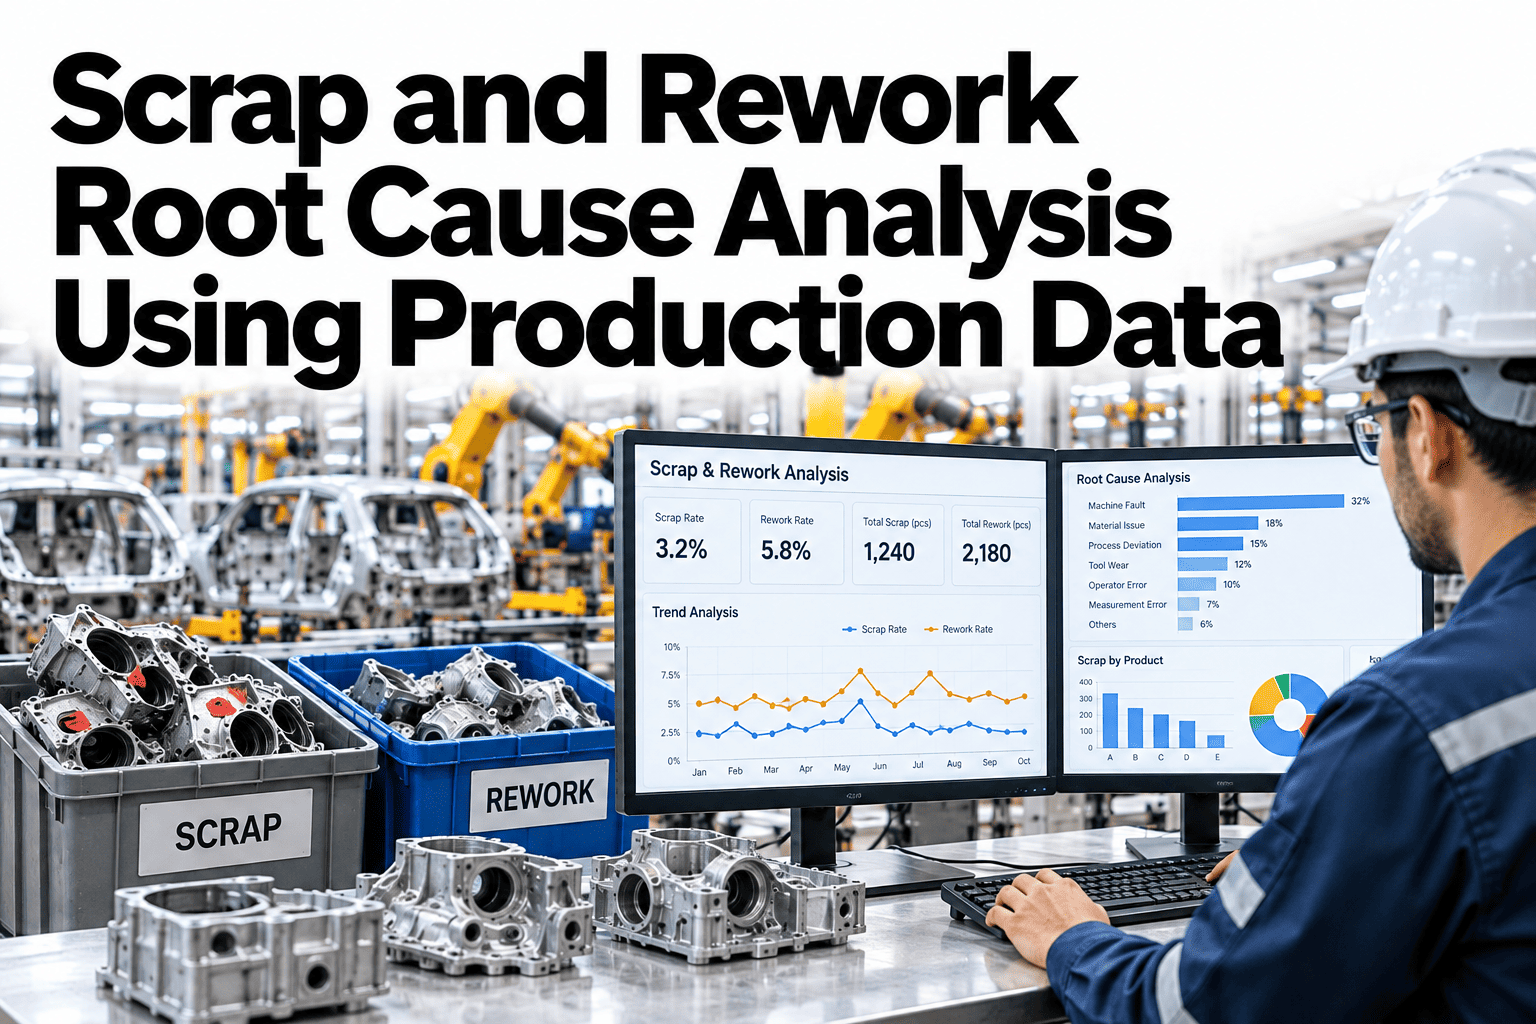
Scrap and rework are usually tracked as totals, which is exactly why they keep coming back. A weekly figure tells you how much was lost but not why, so each meeting ends with a guess and a fresh round of blame. Production data changes that, because every scrapped or reworked unit has a machine, a shift, a material lot and a moment attached to it. Teams who want to use that trail can ask iFactory AI how scrap and rework events are linked to their causes.
Trace Every Scrap and Rework Event Back to Its Root Cause
iFactory AI links scrap and rework records to machine, material and process data, so root cause analysis starts from evidence instead of opinions.
Scrap and Rework Are Different Problems
They are often reported together, but they cost and behave differently. Separating them sharpens every decision.
Where the Losses Usually Come From
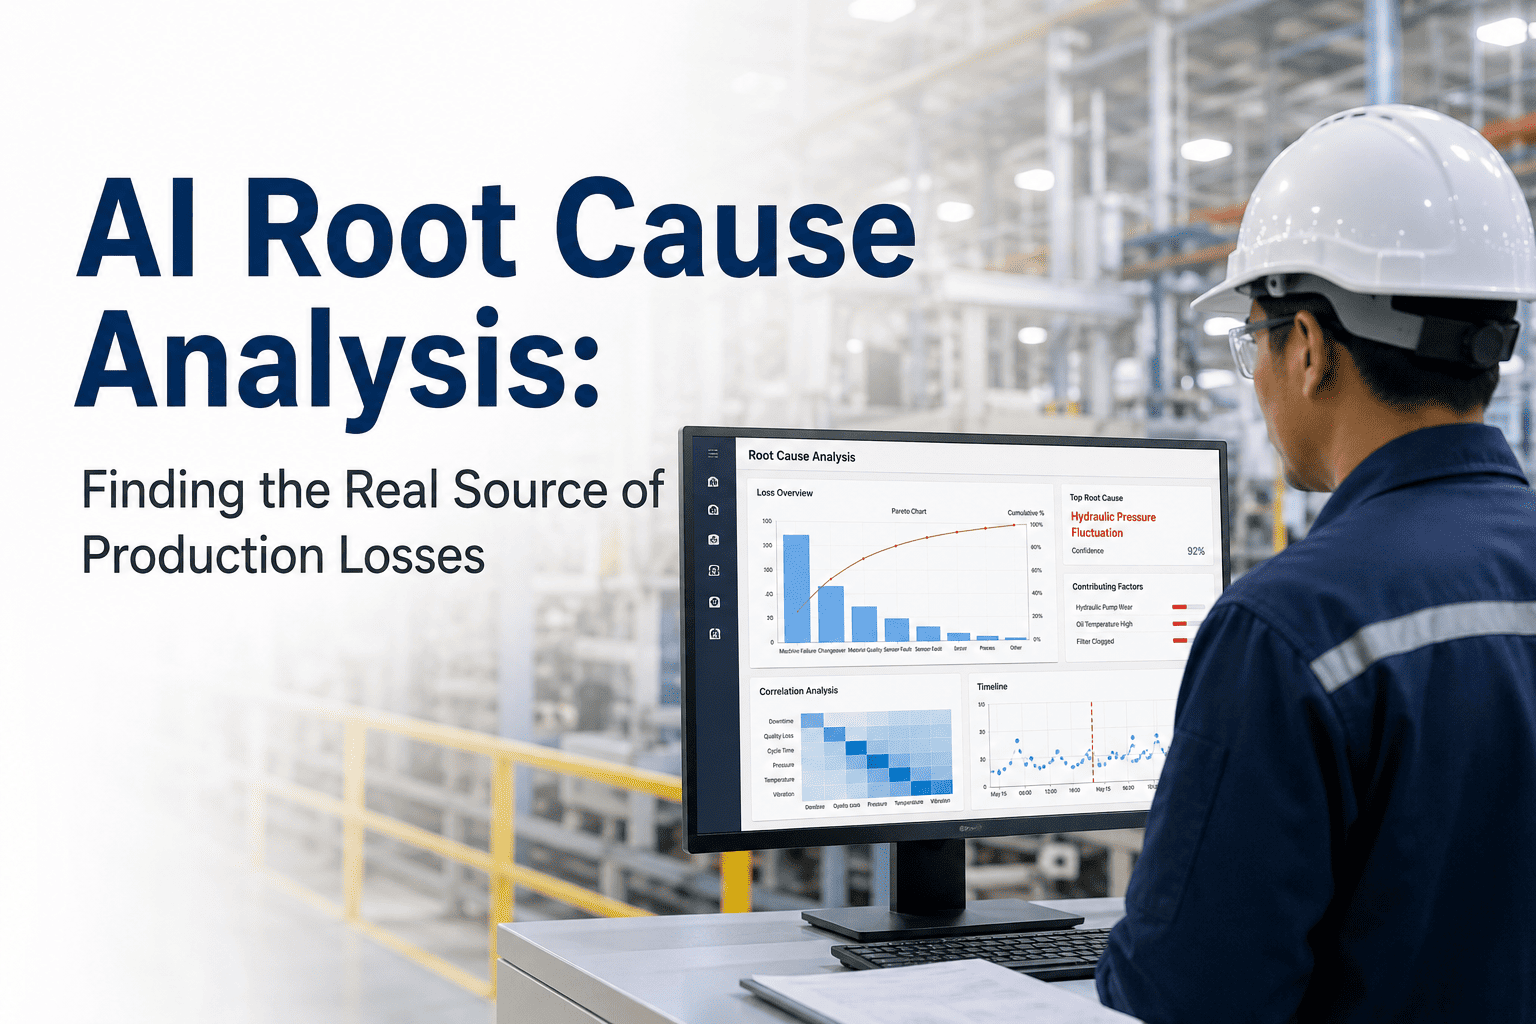
Losses are not spread evenly. The chart shows an illustrative Pareto, where a few causes explain most of the volume.
Six Families of Root Causes
Most causes fall into six families. Sorting events into them tells you which team owns the fix.
Machine
Wear, drift, calibration and breakdown, owned by maintenance.
Material
Lot variation and supplier quality, owned by purchasing and quality.
Method
Work instructions and process settings, owned by engineering.
People
Training and handling, owned by supervisors.
Measurement
Gauges, tests and inspection criteria, owned by quality.
Environment
Temperature, humidity and cleanliness, owned by facilities.
See Which Cause Is Costing You the Most Scrap
Book a 30-minute session and iFactory AI will review your scrap and rework records to rank the root causes behind them.
Five Whys With Data Behind Each Answer
The five whys method works best when each answer is checked against records. Here is how data keeps it honest.
Why was the unit scrapped? Check the defect record.
Why did the defect occur? Check machine and setting data.
Why did the setting change? Check changeover and shift logs.
Why was it not caught? Check inspection and alarm history.
Why can it happen again? Check the standard and training.
Which Data Answers Which Question
Root cause work stalls when the right data is missing. This table shows what each source can tell you.
| Data Source | Question It Answers | Example |
|---|---|---|
| Scrap and rework log | What was lost and how much | Defect type, quantity, reason code |
| Machine and process data | What the machine was doing | Speeds, temperatures, alarms |
| Material records | Which input was used | Lot number, supplier, batch |
| Shift and operator records | Who and when | Crew, handover notes, changeovers |
| Inspection and test data | Where it was found | Station, gauge, result |
Where the Cost of Poor Quality Lands
Scrap and rework cost more than their direct value. The bar shows an illustrative split of where the cost typically sits.
Root Cause Investigation Checklist
Use this list on every recurring scrap or rework problem. Each box should be answerable from data.
A Composite Scenario: The Scrap That Followed a Material Lot
This is a composite example, not a named plant. It shows how linked data ends a long argument.
Knowing When You Have Found the Real Cause
Stopping too early is as costly as never stopping. These tests show when a cause is real.
It explains the pattern
The suspected cause matches where and when failures cluster.
Removing it removes the defect
A controlled change makes the failures stop.
Reintroducing it brings the defect back
A repeat trial confirms the link, where safe to do so.
It is preventable by a standard
A change to the method or check stops it permanently.
What iFactory AI Adds to Root Cause Analysis
iFactory AI is smart manufacturing and industrial software for production plants. Explore root cause analytics in a live product tour on realistic line data.
A 30-Day Plan to Start
A month is enough to find and fix a first root cause. This is a realistic path.
Review of Scrap and Rework Root Cause Analysis
A practical review of what makes root cause work stick, written as editorial guidance rather than a named expert quote.
Standardise the reason codes
Analysis fails when the same loss is coded five different ways.
Separate symptoms from causes
A defect name is a symptom, so keep asking until a process cause appears.
Prove the fix
A cause is confirmed when removing it makes the loss disappear.
Frequently Asked Questions
What is the difference between scrap and rework?
Scrap is material lost completely, while rework is material saved at the cost of repeated effort. Both hurt, but rework hides inside labour time. See both tracked separately on a live dashboard in a short demo. Treating them separately gives clearer priorities.
How do I find the real root cause?
Split losses by machine, shift and material lot, then test the likeliest cause with a controlled change. A cause is real when removing it removes the problem. This avoids fixing symptoms that return.
What data do we need to start?
A scrap and rework log with clean reason codes, plus machine, shift and lot records for the same period. Ask support which of your records can be linked quickly at the start. Most plants already hold most of it.
Can this work without automatic data capture?
Yes. Manual logs with consistent reason codes and lot numbers are enough to begin. Automation then reduces effort and improves accuracy. The method matters more than the tool at the start.
How soon can we expect results?
Many plants find and fix their first root cause within a month on one line. Book time to scope a first scrap reduction pilot and pick the product. One solved problem proves the approach.
Stop Guessing Why Your Scrap and Rework Keep Coming Back
iFactory AI ties every loss to its machine, material and shift so root causes are found and fixed for good. Book a walkthrough to see it on your own production data.