Every hour your production line sits idle, the financial meter runs without pause — equipment downtime costs industrial manufacturers an average of $260,000 per hour. But the deeper problem is not the downtime itself. It is the misdiagnosis that follows. Traditional root cause analysis demands 3 to 5 days of manual data correlation across SCADA exports, historian logs, and maintenance records — and still delivers the wrong conclusion 40% of the time. The consequence is a cycle of recurring failures, compounding production losses, and a maintenance team permanently fighting fires it cannot fully see. AI-powered root cause analysis breaks this cycle by correlating thousands of variables across downtime, quality, and process data in minutes — surfacing the true source of every production loss before it can repeat.
iFactory AI Analytics Platform
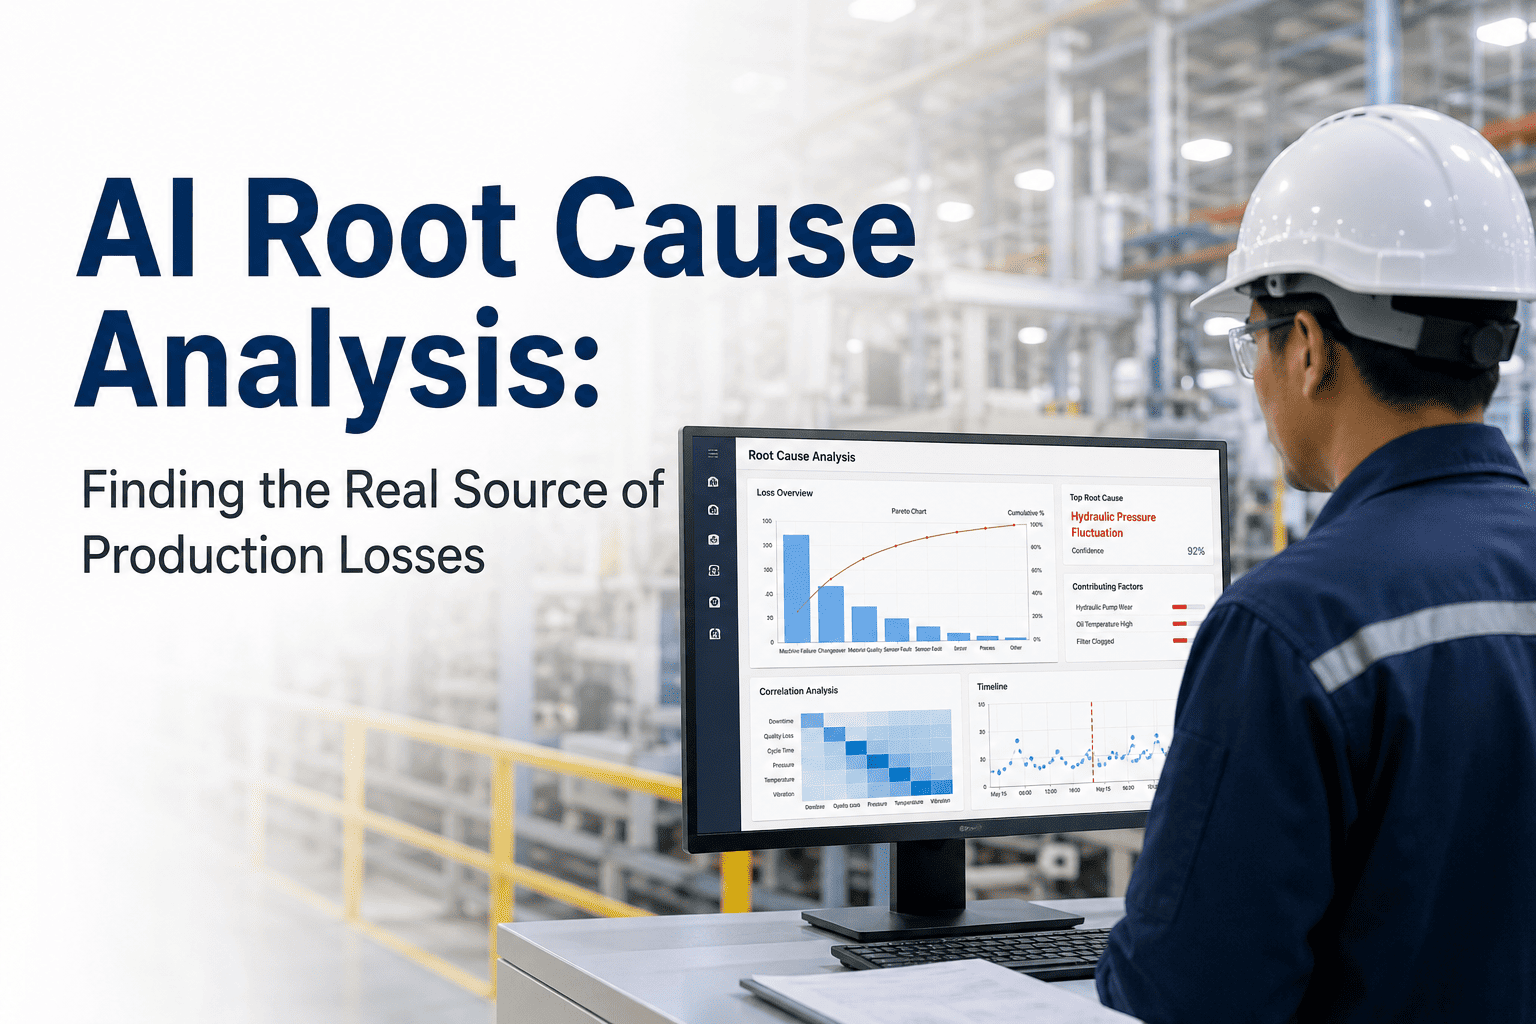
AI Root Cause Analysis: Finding the Real Source of Production Losses
Stop chasing symptoms. AI-powered RCA automatically correlates downtime, quality, and process data to pinpoint true failure origins — and prevent them from recurring.
90%
Reduction in RCA cycle time
3×
More failure patterns identified
$260K
Avg. hourly downtime cost avoided
40%
Legacy RCA error rate eliminated
The Hidden Cost of Getting RCA Wrong
When a production line fails, the visible cost is downtime. The invisible cost is misdiagnosis. A manufacturer that attributes a bearing failure to poor lubrication — when the true cause is shaft misalignment — will re-lubricate, restart, and fail again within weeks. This cycle of recurring failures, each accompanied by unplanned downtime, emergency parts procurement, and overtime labour, is the silent budget drain that traditional RCA perpetuates. AI root cause analysis breaks the cycle by examining the complete causal chain — not just the final failure event.
Manual Correlation Takes Days
Engineers manually cross-reference SCADA exports, historian data, and maintenance logs across multiple systems — a process that routinely takes 3–5 days and still misses cross-system correlations invisible to human analysts.
Fix AI correlates all sources simultaneously in minutes — with confidence scoring on every causal factor.
Symptom Treatment, Not Cause Removal
Without complete process context, maintenance teams address the most obvious symptom — not the upstream cause. The same asset fails again within 30–90 days, costing more the second time in parts, downtime, and credibility.
Fix AI constructs a full causal chain — corrective actions target the verified source, not the visible symptom.
Knowledge Locked in Individuals
RCA accuracy depends entirely on the experience of whoever runs the analysis. When senior engineers retire or transfer, institutional knowledge leaves with them — and failure rates climb immediately.
Fix AI institutionalises failure knowledge — every event trains models that get more accurate over time, regardless of staff changes.
No Pareto Prioritisation
Traditional RCA treats all failures equally. Without automated Pareto analysis correlating failure frequency to production loss value, maintenance effort concentrates on the loudest problems — not the costliest ones.
Fix Automated Pareto ranking surfaces the 20% of failure modes driving 80% of losses — in real financial terms.
See how iFactory AI identifies root causes in real time — Book a free demo with our engineers.
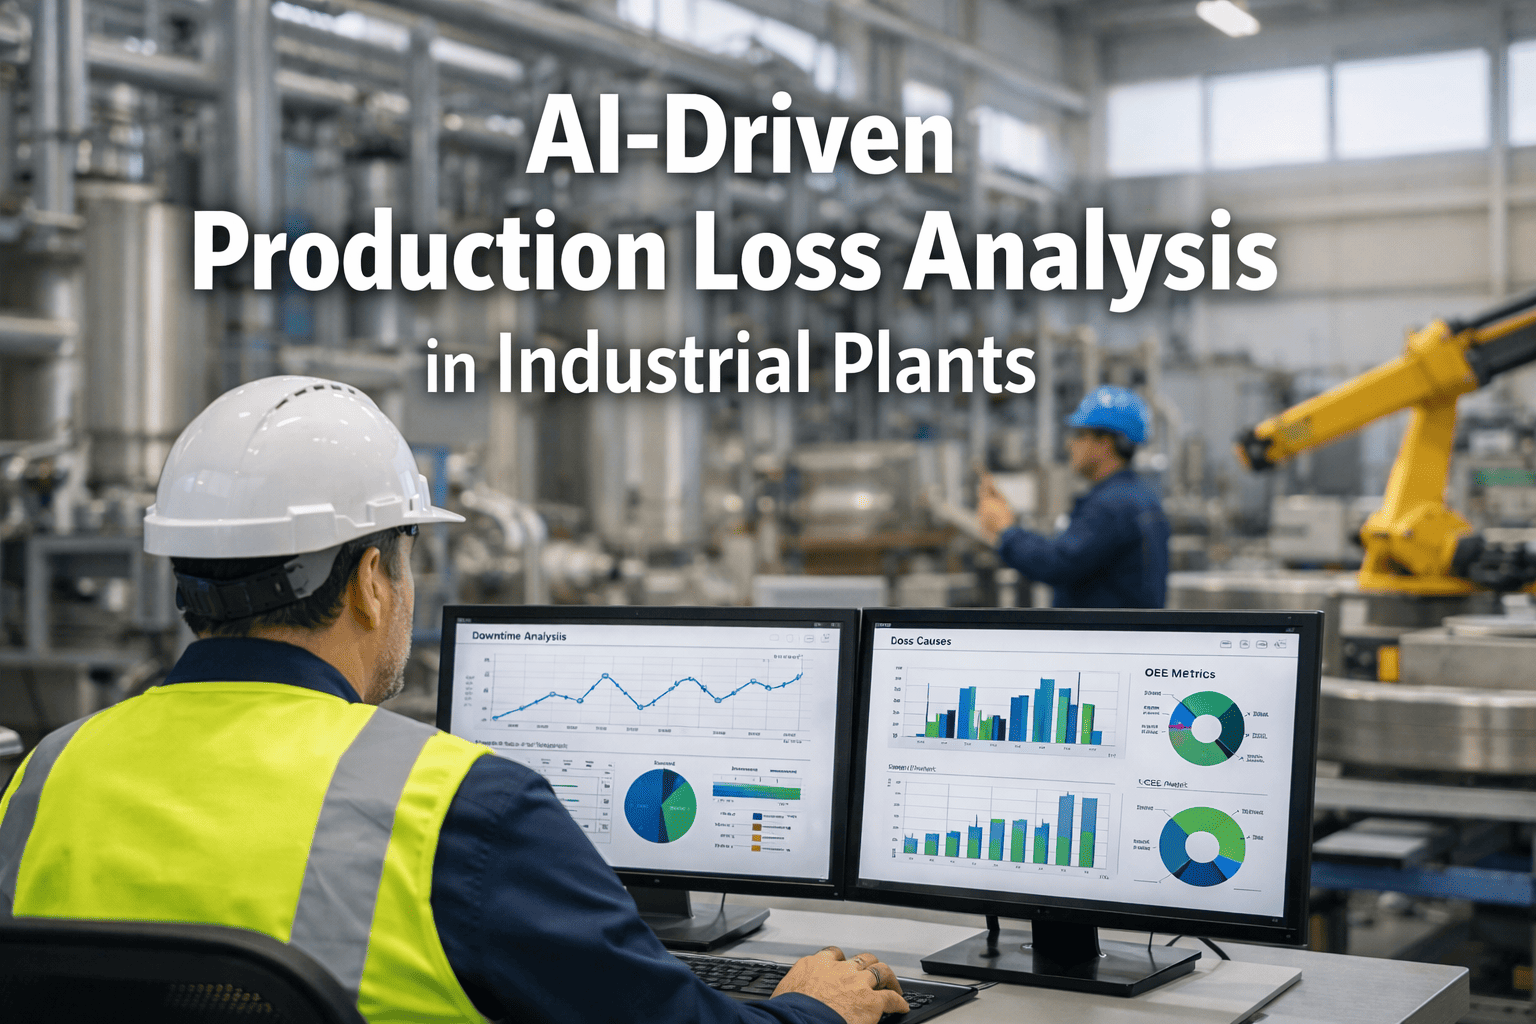
How AI Root Cause Analysis Works
iFactory's AI Analytics Platform ingests streaming data from every connected asset — vibration sensors, thermal monitors, current transducers, SCADA systems, MES records, and CMMS work order histories — and applies multi-layer correlation algorithms to identify causal chains that no human analyst could detect manually. The platform does not simply flag anomalies. It constructs a ranked causal map, weighting each contributing factor by its statistical relationship to the failure event.
Output
Unified real-time data stream from all connected assets and systems
Multi-Source Data Ingestion
What Gets Ingested
Real-time sensor streams: vibration, temperature, current, and pressure at sub-second resolution
SCADA and historian time-series data correlated to production event timestamps
MES production records linked to quality defect occurrences and batch records
CMMS work order history providing maintenance context, parts data, and technician notes
Business Outcome
Every relevant data source unified in one correlation layer — eliminating the manual export and collation process that delays traditional RCA by days. No data left uncorrelated.
Output
Ranked causal map with confidence scores for every contributing factor
AI Correlation Engine
How the AI Thinks
Temporal correlation maps failures to precursor events occurring hours or days before the visible incident
Cross-asset analysis identifies upstream equipment contributing to downstream failures across production lines
Process parameter drift detection surfaces gradual deviations before they reach catastrophic threshold
Statistical weighting ranks causal factors by confidence and financial impact — not just frequency
Business Outcome
Root cause identified with 90%+ accuracy in minutes. Maintenance teams receive an evidence-backed causal report — not a guess — enabling same-shift corrective action instead of next-week investigation.
Output
Failure modes ranked by production loss value with financial impact quantified per type
Automated Pareto Analysis
What Gets Prioritised
Failure modes ranked by production loss value — not just occurrence frequency — for maximum ROI focus
Top 20% of causes driving 80% of losses isolated and flagged for immediate engineering attention
Trend analysis identifies recurring failure patterns across weekly, monthly, and seasonal time periods
Financial impact quantified per failure type in real currency — making the business case self-evident
Business Outcome
Maintenance effort concentrates on the failures costing the most — not the ones making the most noise. Every engineering hour delivers maximum return on production improvement investment.
Output
Auto-generated work orders with recurrence prevention thresholds active
Actionable RCA Reports and Automated Work Orders
What Gets Automated
Root cause confirmed with confidence score, supporting evidence chain, and contributing factor weights
Recommended corrective actions linked to specific asset parameters and operational thresholds
Work orders auto-generated and routed to CMMS with correct parts list, procedures, and scheduling priority
Recurrence prevention rules deployed as live monitoring thresholds — the same failure cannot repeat undetected
Business Outcome
The investigation-to-action cycle collapses from days to minutes. Every failure event strengthens the AI model — making each subsequent analysis faster, more accurate, and more valuable than the last.
Legacy RCA vs. AI-Powered RCA: The Performance Gap
The comparison below captures the operational reality faced by manufacturers still relying on manual root cause analysis workflows — and the measurable improvement delivered by AI-powered correlation analysis across every critical dimension.
Analysis Time
Legacy Manual RCA
3–5 days of manual data gathering, exporting, and cross-referencing across disconnected systems
AI-Powered RCA
Minutes — automated correlation across all data sources simultaneously with ranked output
Causal Accuracy
Legacy Manual RCA
~60% — dependent on individual analyst experience and time available for investigation
AI-Powered RCA
90%+ — statistical confidence scoring across complete causal chain, not just visible symptoms
Failure Recurrence
Legacy Manual RCA
High — symptom treatment leaves the root cause active; same asset fails again within 30–90 days
AI-Powered RCA
Low — corrective action targets the verified root cause; monitoring thresholds prevent recurrence
Knowledge Retention
Legacy Manual RCA
Lost when senior engineers retire or transfer — failure rates climb immediately after departures
AI-Powered RCA
Institutionalised — AI models learn from every event and improve continuously regardless of staff changes
Financial Visibility
Legacy Manual RCA
Estimated retrospectively — rarely tied to specific failure modes or usable for budget decisions
AI-Powered RCA
Real-time — every failure event quantified in production loss and cost terms with Pareto ranking
Work Order Generation
Legacy Manual RCA
Manual entry after analysis is complete — introducing delays, errors, and missing parts specifications
AI-Powered RCA
Auto-generated with correct parts list, procedures, technician assignment, and scheduling priority
Request a performance audit of your current RCA process — Book a Strategy Session.
The Business Impact: Three Dimensions of Value
Workflow Acceleration
RCA cycle time drops from days to minutes. Maintenance teams receive ranked, evidence-backed causal reports immediately after a failure event — enabling corrective action before the next shift rather than the next week. The investigation-to-action gap that costs millions in recurring failures closes permanently.
Key Results
90% reduction in investigation time — Same-shift corrective action capability — Eliminated inter-departmental data request cycles — Auto-routed work orders to correct technicians
Overhead Reduction
Senior engineering time spent on manual data gathering and correlation is redirected to high-value improvement projects. The AI handles investigation; your engineers implement solutions and drive continuous improvement. Institutional knowledge is captured permanently — it never retires or transfers.
Key Results
Elimination of manual data export and collation — Reduced reliance on individual analyst expertise — Lower emergency maintenance spend per event — Knowledge captured in AI models permanently
Output and OEE Growth
Eliminating recurring failures directly increases Overall Equipment Effectiveness. Each percentage point of OEE improvement translates to substantial additional production output — without adding headcount, capital equipment, or shift extensions. The same assets simply stop failing for the same reasons.
Key Results
OEE improvements of 8–15% in Year 1 — Recurring failure rates reduced by 60–70% — Quality defect rates correlated and corrected upstream — Production throughput increased on existing asset base
Frequently Asked Questions
How quickly does AI RCA produce results after a failure event?
iFactory's correlation engine begins analysis the moment a failure event is logged. For assets with established baseline data, a ranked root cause report with confidence scoring is typically available within 5–15 minutes of event detection — compared to 3–5 days for manual analysis workflows. The first avoided recurring failure typically occurs within 6–10 weeks of deployment.
What data sources does the AI RCA platform require to function effectively?
The platform ingests data from any combination of OPC-UA, MQTT, REST APIs, SCADA historians, MES systems, and CMMS exports. It does not require a complete sensor infrastructure to deliver value — it maximises the data you already have while identifying specific gaps where additional instrumentation would improve analysis accuracy and causal confidence.
How does AI RCA handle failure modes it has never encountered before?
The AI applies anomaly detection and process parameter deviation analysis even for novel failure patterns. While confidence scoring is lower for first-occurrence events, the platform flags unusual parameter combinations for human review and uses the event to train its models — improving accuracy for every future occurrence of the same pattern automatically.
Can AI RCA integrate with our existing CMMS without disrupting current maintenance workflows?
Yes. The platform integrates with major CMMS platforms via standard APIs and operates alongside existing workflows without disruption. Maintenance teams continue using their current systems for work execution while AI-generated RCA reports and auto-created work orders feed in automatically — no rip-and-replace of existing systems required.
What ROI timeline should we present to leadership for AI RCA investment approval?
Most deployments produce the first avoided recurring failure within 6–10 weeks. For high-criticality assets with $100K+ per incident cost, a single prevented recurrence typically covers the entire platform investment for the year. Full ROI — including OEE improvement and overhead reduction — is consistently demonstrated within 6–12 months across manufacturing environments.
Stop Recurring Failures. Start Preventing Them.
AI Root Cause Analysis That Finds the Problem — Not Just the Symptom
iFactory's AI Analytics Platform correlates downtime, quality, and process data in minutes to deliver ranked, evidence-backed root cause reports — and auto-generates the corrective actions to prevent recurrence. Every failure becomes an asset, not a cost.
60%
Reduction in recurring failures
10-30×
Return on investment
12-18mo
Full ROI payback period


.jpeg)
