Every quarter, manufacturers absorb the same invisible tax: overproduced inventory that erodes margin, underproduced orders that forfeit revenue, and planning cycles built on spreadsheet intuition that haven't changed since 1997. Demand forecasting errors drain 10–30% of annual revenue through excess stock, emergency procurement, and customer churn. If your S&OP team still runs ARIMA models or gut-driven consensus forecasts, you are not just leaving money on the table — you are handing competitors a structural advantage they compound every single quarter.
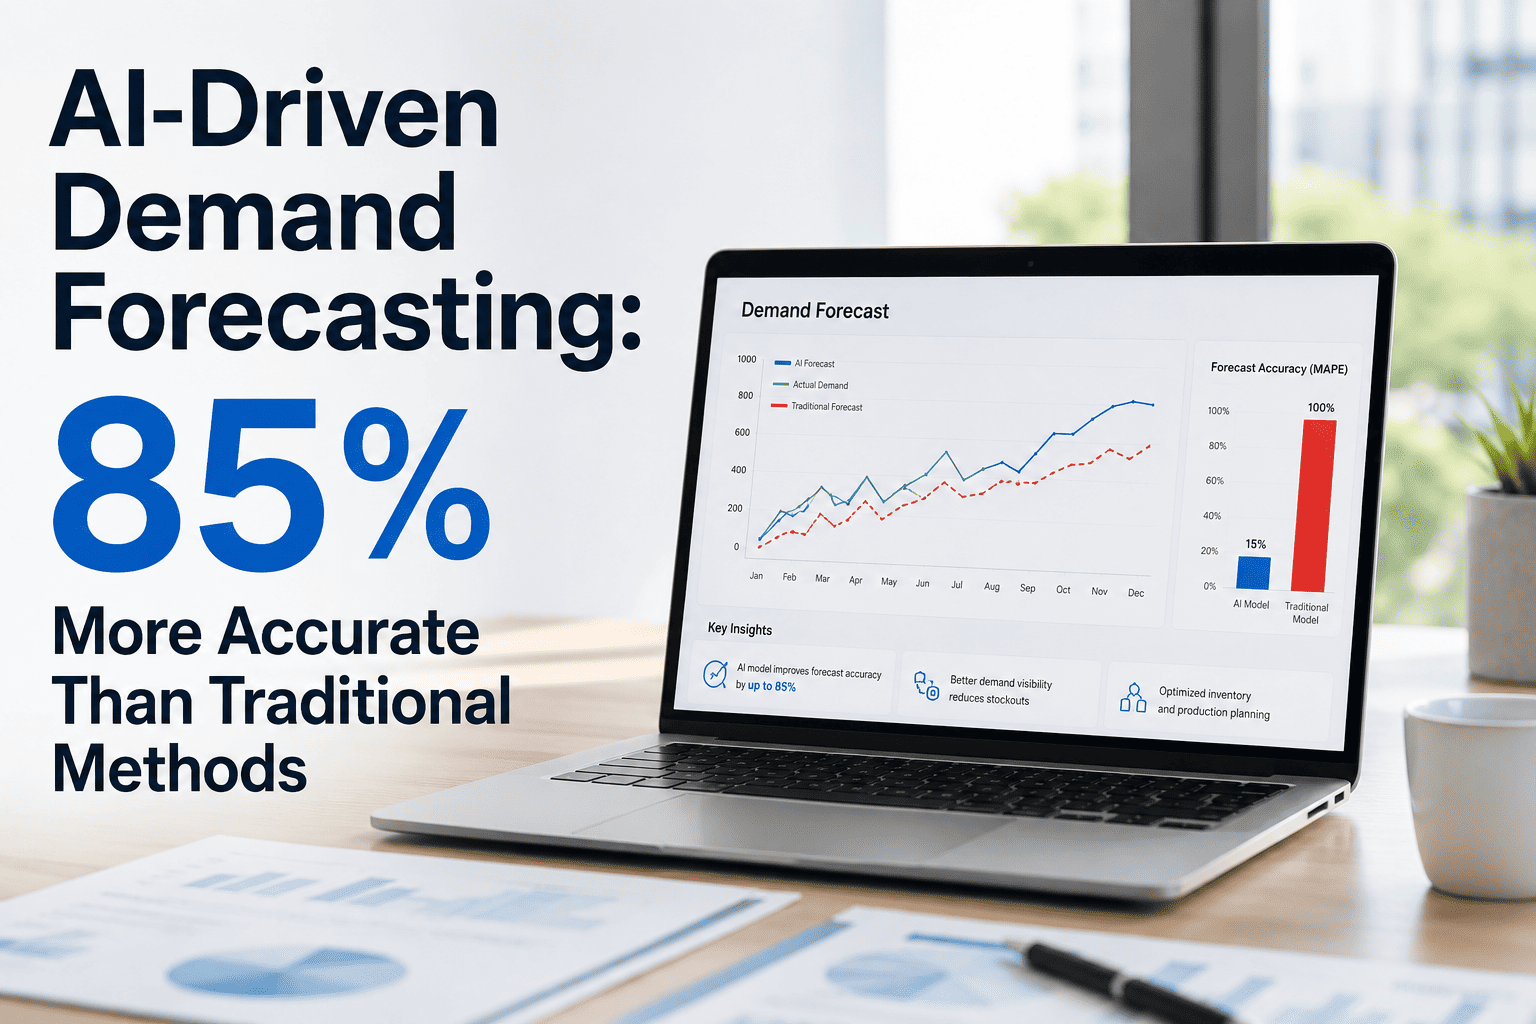
AI Demand Forecasting: 85% More Accurate Than Traditional Methods
Why Traditional Demand Forecasting Is a Competitive Liability
Legacy forecasting methods were designed for stable, low-complexity supply chains. They assume demand follows predictable seasonal patterns and that human judgment can correct the gap. Neither assumption holds in 2025 manufacturing environments. AI demand forecasting uses ensemble ML — LSTM networks, gradient boosting, and transformer architectures — to ingest hundreds of signals simultaneously: POS data, supplier lead times, weather, economic indicators, and real-time production telemetry. The result is not a marginal improvement. It is a structural step-change in planning accuracy.
The Model Architecture Behind 85% Accuracy Gains
AI demand forecasting on the iFactory Analytics Platform is a layered ensemble that selects and weights models based on SKU volatility, data density, and forecast horizon.
Legacy Friction vs. Optimised Excellence
The gap between traditional demand planning and AI-driven forecasting is not a matter of degree — it is a difference in kind. The table below maps the operational divide between the two approaches.
| Dimension | Legacy Friction (Old Way) | Optimised Excellence (AI Way) |
|---|---|---|
| Forecast Cycle | Monthly consensus meetings with 2–3 week lag | Continuous rolling forecasts updated daily or weekly |
| Data Inputs | Historical sales, manual adjustments only | 100+ signals: POS, weather, ERP, SCADA, economics |
| Model Type | ARIMA, moving average, spreadsheet formulas | LSTM, gradient boosting, transformers, ensembles |
| Accuracy (MAPE) | 25–40% mean absolute percentage error | 5–15% MAPE across the full SKU portfolio |
| New SKU Handling | Manual analoguing, high error rate | Cold-start ML using product attribute matching |
| ERP / MES Integration | Manual CSV exports, spreadsheet bridges | Native API integration: SAP, Oracle, Epicor, custom |
| Planner Time Spent | 60–70% on data reconciliation tasks | 10% on data, 90% on exception review and strategy |
| Inventory Outcome | 10–30% excess stock or stockouts per quarter | 20–35% inventory reduction with fill rate improvement |
Business Impact: Three Dimensions of Value Delivery
AI demand forecasting generates compounding value across workflow efficiency, cost reduction, and revenue growth simultaneously — not as isolated metrics but as interconnected operational improvements.
- Eliminates 15–20 hours of weekly planner reconciliation work
- Auto-generates replenishment signals into ERP purchase orders
- Exception-based planning surfaces only deviations requiring attention
- S&OP meetings shift from data review to strategic decision-making
- Forecast override tracking builds organisational learning loops
- 20–35% reduction in average inventory carrying costs
- Emergency procurement spend drops 40–60% in Year 1
- Obsolescence write-offs reduced via demand-signal-driven alerts
- Warehouse space optimised — fewer buffer stock positions required
- Supplier contracts leverage predictable, AI-backed volume signals
- Service level improvement of 8–15 percentage points on fill rates
- Stockout-driven revenue leakage eliminated for top-velocity SKUs
- New product launch forecasts reduce cannibalisation and ramp waste
- Customer satisfaction rises with consistent order fulfilment
- AI insights inform pricing, promotion timing, and assortment decisions
Data Inputs That Power Manufacturing Demand AI
The performance gap between AI and legacy forecasting is driven by data breadth. iFactory's demand forecasting ingests structured and unstructured signals across four categories to give models the full market picture.
- ERP sales order history by SKU, channel, and geography
- MES production actuals and capacity constraints
- CMMS maintenance schedules affecting production availability
- Inventory positions, safety stock levels, and reorder points
- POS data from retail and distribution partners
- Competitor pricing and promotional intelligence
- Search trend indices as leading demand indicators
- Customer order backlog and pipeline data from CRM
- Weather and climate patterns for weather-sensitive categories
- Commodity price indices and supplier lead time data
- Macroeconomic indicators: PMI, consumer confidence, GDP
- Regulatory or trade policy changes affecting supply availability
- Promotional calendars and trade event schedules
- Holiday and seasonal pattern libraries by market
- New product introduction timelines and cannibalisation models
- Customer contract milestones and volume commitments
ERP and MES Integration: No Rip-and-Replace Required
iFactory's platform is built on a connector-first architecture that surfaces AI forecasts inside the systems your planners already use — rather than requiring them to abandon existing workflows.