Every hour your production floor runs blind — no real-time OEE visibility, no predictive alerts, no unified dashboard — you are not just losing efficiency. You are surrendering margin to competitors who already know exactly where their losses are, down to the shift, the asset, and the minute. In 2026, the gap between manufacturers who have deployed modern OEE software and those still relying on spreadsheets or siloed MES reports is no longer a technical gap — it is a profitability gap measured in millions.
iFactory Implementation Intelligence
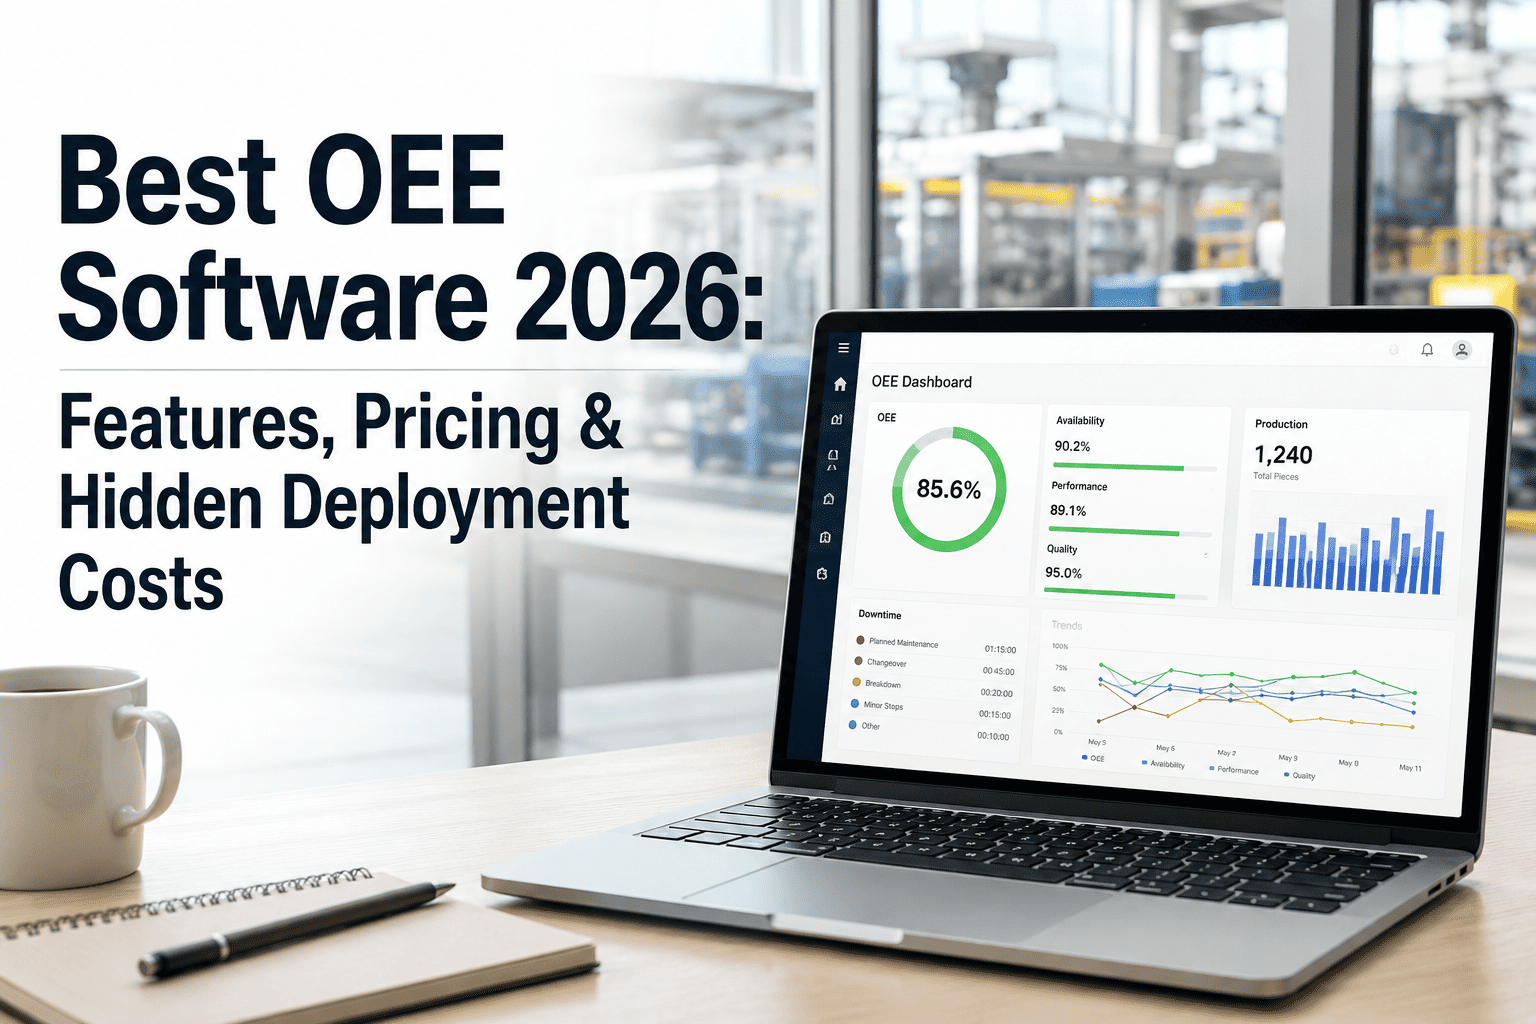
Best OEE Software 2026: Features, Pricing & Hidden Deployment Costs
A definitive comparison of the leading OEE platforms — what they cost, what they hide, and which one delivers measurable ROI fastest for discrete and process manufacturers.
23%
Average OEE improvement after deployment
$380K
Median first-year savings per facility
6–10wk
Time to first actionable insight
89%
Of adopters report reduced unplanned downtime
What OEE Software Actually Does — and Why Most Platforms Underdeliver
Overall Equipment Effectiveness software captures Availability, Performance, and Quality data from production assets in real time, calculates OEE scores at the machine, line, and facility level, and surfaces the losses eroding throughput. Done well, it shifts maintenance from reactive to predictive, gives operations managers shift-level visibility, and gives executives a financial lens on asset utilisation. Done poorly — which describes most enterprise deployments before 2023 — it produces dashboards nobody trusts, alerts nobody acts on, and integration projects that take 18 months to connect to a SCADA system that was installed in 2009.
The 2026 OEE software landscape has bifurcated. On one side: legacy MES-adjacent platforms with comprehensive feature sets, six-figure implementation fees, and 12–18 month deployment timelines. On the other: AI-native platforms designed for phased deployment, real-time anomaly detection, and ROI visibility within the first quarter. The question is not which platform has the longest feature list. The question is which platform gets actionable data flowing fastest — and keeps delivering value as you scale.
The Hidden Cost Architecture of OEE Software
Vendors quote license fees. Procurement evaluates license fees. But the total cost of ownership for OEE software is rarely the license. Below are the six cost categories that routinely double or triple the expected spend — and the questions to ask before signing.
Integration Labour
Connecting OPC-UA, MQTT, SCADA, ERP, and CMMS feeds. Legacy platforms average 400–800 hours of integration work billed at $150–250/hr.
Sensor Infrastructure Gaps
Most facilities need 30–60% more instrumentation than initially estimated. Platforms that do not flag gaps early leave this discovery to month six.
Training and Change Management
Operator adoption rarely happens without structured onboarding. Budget 80–120 hours per site for initial training plus ongoing refreshes.
Customisation Scope Creep
Out-of-the-box dashboards rarely match your KPI definitions. Custom report builds average $20–50K per engagement on legacy platforms.
Annual Maintenance Fees
Typically 18–22% of license per year on enterprise platforms. On a $300K license, that is $54–66K annually before any upgrades or additional modules.
Delayed ROI Window
Every month between deployment start and first actionable insight is pure cost. Platforms averaging 9–12 months to value cost $200–600K in unrealised savings.
Legacy OEE Platforms vs. AI-Native OEE: The 2026 Comparison
The table below captures the operational and financial delta between traditional OEE deployments and modern AI-native platforms like iFactory. This is not a features comparison — it is a business outcomes comparison.
| Evaluation Dimension |
Legacy Platforms Traditional MES / Bolt-On OEE |
AI-Native OEE iFactory Digital Twin Platform |
| Time to First Insight |
9–18 months post-contract |
4–6 weeks from sensor deployment |
| OEE Data Latency |
Batch reports — shift or daily aggregations |
Real-time dashboards with sub-minute refresh |
| Anomaly Detection |
Threshold-based alarms — manual tuning required |
ML anomaly detection — self-tuning on operating patterns |
| Predictive Capability |
Reactive — reports failures after they occur |
14–21 day failure prediction with RUL estimates |
| Sensor Infrastructure |
Requires existing historian / DCS integration |
Works with existing infrastructure + fills gaps with $50–100 sensors |
| Implementation Model |
Big-bang deployment — all or nothing |
Phased — 10 assets to 200+ with ROI gating each phase |
| Total Year-1 Cost |
$400K–$2.4M including integration and services |
$150K–$680K — phased investment tracked against savings |
| Work Order Automation |
Manual CMMS entry from OEE alerts |
AI auto-generates work orders with parts and scheduling |
| Energy Monitoring |
Separate module — additional license cost |
Integrated energy layer correlating consumption with OEE |
| Multi-Site Benchmarking |
Manual data export and comparison |
Cross-facility OEE benchmarking on identical assets |
What to Look For: 7 Non-Negotiable OEE Software Capabilities in 2026
Not all OEE platforms are built for the operational realities of modern manufacturing. These seven capabilities separate platforms that produce sustained ROI from platforms that produce dashboards your team stops checking after three months.
01
Real-Time OEE Dashboards with Sub-Minute Latency
Shift-end OEE reports are archaeology. By the time a supervisor reads yesterday's numbers, the root cause of a 12% performance loss has already been overwritten by the next shift. Modern OEE platforms stream Availability, Performance, and Quality metrics continuously — allowing real-time intervention on developing losses before they compound.
02
AI-Powered Anomaly Detection with Self-Tuning Baselines
Fixed-threshold alarms generate alarm fatigue. AI models that learn each asset's unique operating signature — load profiles, thermal behaviour, vibration patterns — generate alerts only when deviation is statistically meaningful. The result: fewer alerts, higher confidence, faster response.
03
Loss Categorisation Aligned to Your Production Taxonomy
OEE is only useful if losses are categorised in terms your team recognises — by line, shift, SKU, downtime reason code, and asset. Generic "unplanned downtime" categories hide the decisions needed to act. Look for platforms that map to your existing reason code structure without six months of customisation.
04
Native CMMS and ERP Integration via Standard Protocols
OEE data that does not flow into maintenance workflows or financial systems creates islands. Platforms with native OPC-UA, MQTT, and REST API integration eliminate custom middleware projects and connect OEE scores to work orders, spare parts consumption, and production cost accounting automatically.
05
Predictive Failure Alerts with Remaining Useful Life Estimates
Condition monitoring tells you an asset is degrading. Predictive analytics tells you it will fail in 14 days. Remaining Useful Life estimates — updated continuously as operating data accumulates — allow maintenance planning to shift from calendar-based to condition-based, eliminating both premature replacements and unexpected failures.
06
Energy Correlation to OEE and Production Output
Energy waste and production inefficiency are the same problem expressed in different units. Platforms that correlate energy consumption with OEE scores, production output, and asset condition surface compressor leaks, motor inefficiencies, and idle energy waste — typically adding 8–15% of incremental savings on top of maintenance optimisation.
07
Phased Deployment Model with ROI Gating
Platforms that require full-facility deployment before delivering value impose execution risk that most organisations cannot absorb. Phased deployment — starting with 10–20 critical assets, proving ROI, then scaling — reduces risk, accelerates payback, and builds internal champions who drive adoption across the enterprise.
Operational Impact at Scale
Three Business Outcomes That Define OEE Software ROI
Throughput Recovery
Real-time OEE visibility consistently recovers 8–23% of hidden capacity from existing assets — without capital investment in new equipment. Identifying and eliminating micro-stoppages, speed losses, and quality defect clusters releases production capacity already paid for.
- Micro-stoppage identification and root cause tagging
- Speed loss quantification by shift and operator
- Quality defect clustering by material batch and line
Maintenance Cost Reduction
Transitioning from time-based to condition-based maintenance eliminates unnecessary preventive work while preventing unplanned failures. The financial impact is typically 25–45% reduction in annual maintenance spend — with the biggest gains coming from eliminating catastrophic failures on critical assets.
- Predictive alerts replacing calendar-based PMs
- AI work order generation reducing planning overhead
- Spare parts optimisation from RUL forecasting
Strategic Capital Intelligence
OEE data maturity enables evidence-based CAPEX decisions — replacing gut-feel equipment replacement cycles with data-backed refurbish-vs-replace analysis, cross-site performance benchmarking, and new asset commissioning via virtual twin testing that cuts ramp-up time 30–40%.
- TCO modelling from live asset performance data
- Cross-facility benchmarking on identical equipment
- Virtual commissioning before physical installation
OEE Software Pricing in 2026: What Vendors Disclose and What They Do Not
OEE software pricing varies enormously based on deployment model, asset count, integration scope, and whether AI-predictive features are included or sold as separate modules. The table below represents observed market ranges in 2026 — not vendor-published list prices, which are uniformly lower than total cost of ownership.
Entry-Level OEE Tools
$8K – $40K / year
Spreadsheet-replacement tools. Good for single-site OEE tracking with manual data entry. No real-time capability, no predictive features, limited integration.
Best for: Small facilities with <20 assets and no IT integration requirements
Most Common
Mid-Market MES-Integrated OEE
$80K – $300K / year
OEE as a module within broader MES platforms. Real-time capability exists but predictive features are separate. Integration costs frequently exceed license cost.
Best for: Mid-size manufacturers with existing MES investment and 12+ month deployment tolerance
Highest ROI
AI-Native OEE + Digital Twin
$50K – $200K / year
Unified OEE, predictive maintenance, energy monitoring, and digital twin on a single platform. Phased deployment from 10 assets. AI included, not add-on.
Best for: Manufacturers prioritising fast ROI, predictive capability, and scalable deployment
Enterprise Suite Platforms
$300K – $2M+ / year
Comprehensive platforms targeting Fortune 500 manufacturers. Deep capability but heavyweight implementation, long timelines, and significant customisation dependency.
Best for: Large multinationals with dedicated OT/IT integration teams and 18+ month deployment windows
Get a Custom OEE Platform Recommendation for Your Facility
Our engineers will assess your current sensor infrastructure, production asset inventory, and integration requirements — then map the fastest path to measurable OEE improvement. No commitment required.
Request a Performance Audit
How to Evaluate OEE Software: A Decision Framework for Operations Leaders
Vendor demos are designed to show strengths and obscure limitations. Use this evaluation framework to cut through the theatre and assess whether a platform can deliver real-world results in your operational environment.
Step 1
Define Your Baseline and Success Metrics First
Before evaluating any platform, document your current OEE baseline by line or asset, your top three loss categories, and the financial value of a 5% OEE improvement. Vendors who cannot show how their platform moves those specific numbers are not the right partner.
Step 2
Ask for a Pilot on Your Worst Asset
Require a 4–6 week pilot on your highest-downtime or highest-maintenance-cost asset. Any platform unwilling to demonstrate value on a single critical asset before a full contract is signalling that value delivery requires full-scale deployment — a significant red flag.
Step 3
Total Cost of Ownership Over 36 Months
Request a fully loaded 36-month cost model: license, integration services, sensor infrastructure, training, customisation, and annual maintenance fees. Compare this against your conservative ROI estimate. If the payback period exceeds 18 months, the platform is too expensive for the value delivered.
Step 4
Validate Integration Claims Against Your Systems
Ask for a live demonstration of integration with your specific SCADA or historian version — not a generic OPC-UA demo. Request reference customers using the same ERP or CMMS you run. Integration surprises are the most common cause of OEE project delays and cost overruns.
Step 5
Evaluate AI Capabilities — Not AI Marketing
Ask for the specific models used for anomaly detection and failure prediction, the training data requirements, and the typical accuracy achieved on comparable assets. "AI-powered" on a website means nothing. A vendor who can explain LSTM models and gradient boosting on your asset type is credible.
Step 6
Assess Operator Adoption Design
The best OEE platform is worthless if your maintenance engineers and operators do not use it. Evaluate mobile accessibility, alert delivery channels, natural language query capability, and the dashboard configuration process. Platforms that require IT intervention to change a KPI definition will not be used.
Start Small. Prove Fast. Scale Deliberately.
Your First 12 Assets. Your First Avoided Failure. Your First ROI Report — Within 10 Weeks.
iFactory's AI-native OEE platform deploys in phases, not projects. Sensors on critical assets in week one. Anomaly alerts validated by your team in week six. Predictive failure prevention with documented savings by month three. Every phase funds the next through demonstrated results — no leap of faith required.
4–6wk
To first measurable value
$3.5M
Annual savings potential
10–30x
Return on investment