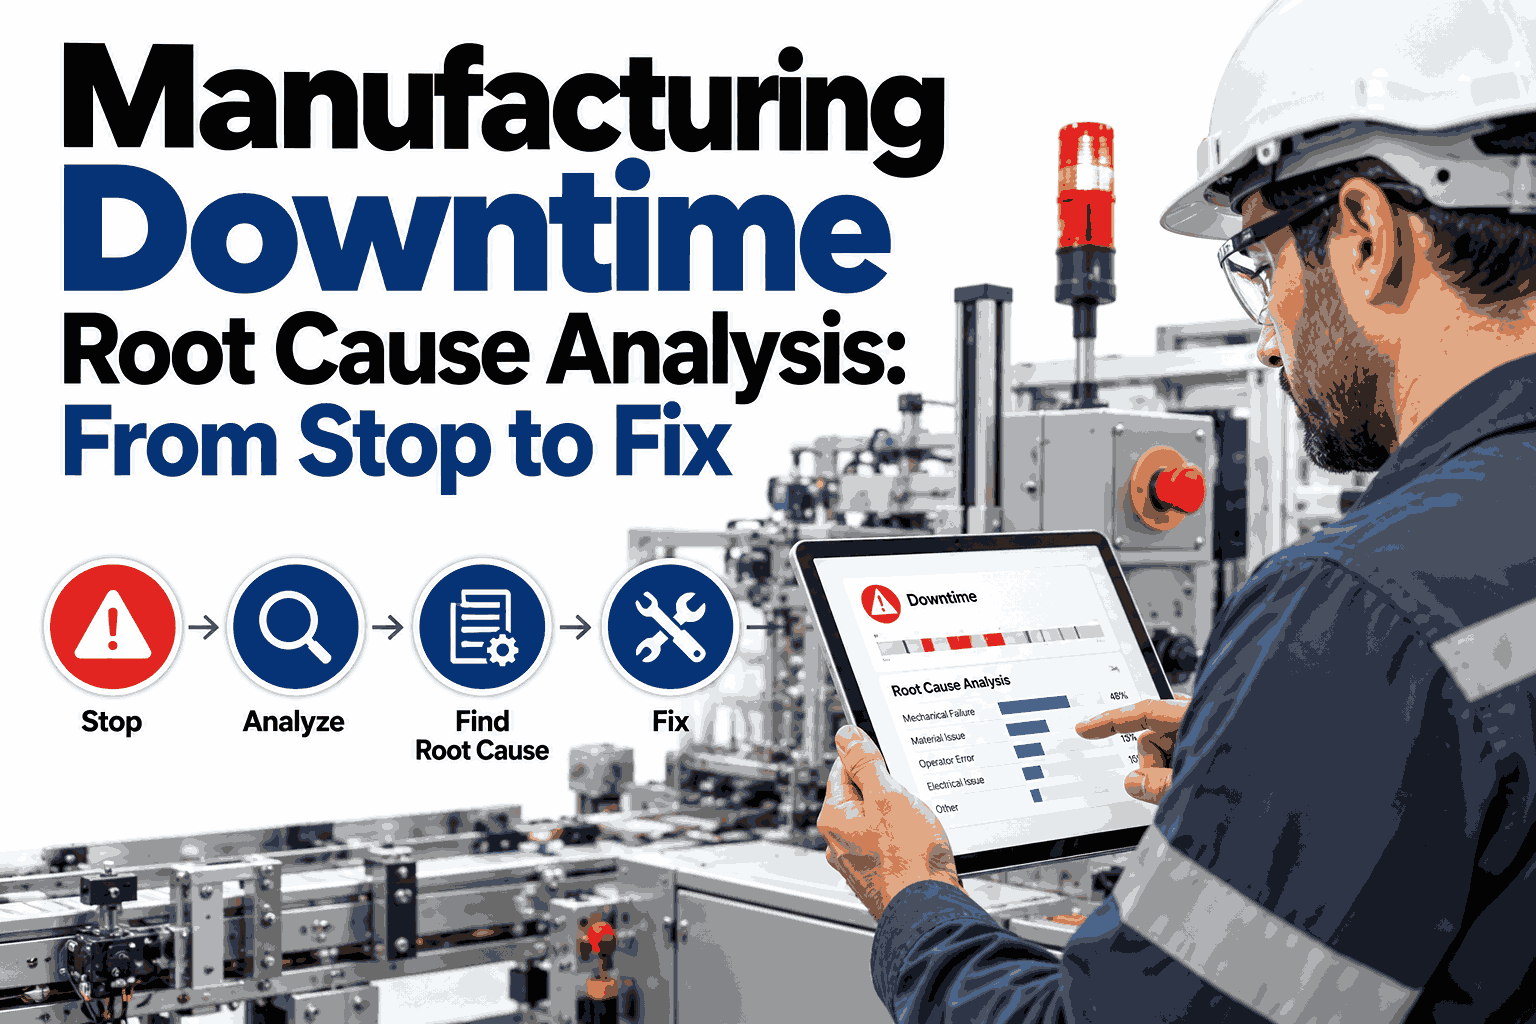
When a line stops, the pressure to restart is so strong that the real question, why it stopped, is usually postponed until the next stop answers it again. Teams then get very good at fast repairs and very poor at prevention, so the same jam, trip or sensor fault returns every week under a slightly different note in the log. Root cause analysis breaks that cycle by treating each meaningful stop as evidence rather than an interruption, and by following it from the first alarm to a fix that stays fixed. To see how this looks with your own stop data, walk through a live stop investigation with our team.
From Stop to Fix: Find the Cause Once Instead of Repairing the Symptom Weekly
iFactory AI captures every stop with its context, points to the patterns behind repeat failures and keeps each root cause investigation moving until the fix is verified.
Fixing the Symptom Is the Most Expensive Habit in Maintenance
A stop that is repaired but not explained costs you twice. The first cost is the lost production during the stop itself, and the second is the repeat that follows because nothing upstream was changed. Over a year, the second cost is often larger, yet it never appears as a single line in any report because it is spread across dozens of small events.
Fast repair is still a skill worth respecting, because short restarts protect output and customer deliveries. The aim of root cause analysis is not to slow that response down. It is to make sure that the knowledge gained during the repair is captured and acted on before the shift ends and the memory fades.
The good news is that most plants do not have hundreds of different problems. A small number of causes usually produce most of the lost time, which means a disciplined investigation of a few stops can remove a large share of total downtime.
Start With a Pareto: A Few Causes Usually Own Most of the Lost Time
Before investigating anything, rank your stops by lost minutes, not by count. A fault that happens twice a month but takes four hours may cost more than a jam that happens daily and clears in one minute. The chart below shows a typical shape for a packaging line, drawn as an illustration.
In this example, four causes account for four fifths of the loss. Investigating those four thoroughly will do more good than a long list of small fixes. If your own ranking looks similar, you already know where the first investigations belong.
The ranking is only as honest as the data behind it. Manual logs tend to record long stops well and short ones poorly, so an automatic capture of every stop, even the brief ones, changes the chart and often moves the micro-stops up the list.
Pick the Method to Match the Problem, Not the Other Way Round
There is no single best technique. A simple stop with an obvious chain of events needs a quick questioning method, while a complex or dangerous failure needs a structured one. Matching the method to the situation saves time and avoids the common mistake of turning every small stop into a week-long project.
| Method | Best used for | Main strength | Watch out for |
|---|---|---|---|
| 5 Whys | Single-chain stops and quick shift-level reviews | Fast, needs no special training | Can stop too early at an operator error |
| Fishbone diagram | Brainstorming causes across several categories | Shows the full cause landscape on one page | Lists causes without proving them |
| Is and Is Not analysis | Intermittent faults with unclear patterns | Narrows the search by comparing where it happens and does not | Needs good records of both cases |
| Fault tree analysis | Complex failures with multiple contributing events | Maps combinations of causes with logic | Takes time to build and review |
| 8D report | Customer-visible or recurring failures | Adds containment, ownership and verification | Heavy for small stops |
Turn Your Next Big Stop Into a Closed Investigation
Bring a recent costly stop and see how captured context, pattern matching and tracked actions would carry it from alarm to verified fix.
Five Whys in Practice: When the Fourth Answer Is the Useful One
The following example shows how questioning moves from a visible stop to a systemic gap. The first answers describe equipment, while the later answers describe how the plant manages that equipment, which is where lasting fixes live.
Had the team stopped at the overload, the fix would have been a motor reset. Had they stopped at the leak, they would have replaced a seal. Only the final answer prevents the same gap from silently removing tasks on other machines.
Good Investigations Run on Evidence, Not on Opinions
Every experienced technician has a theory about why a line stops, and many of those theories are right. The trouble is that a theory repeated often enough starts to sound like a fact. Evidence turns a confident guess into a conclusion that others can check, challenge and trust.
The strongest investigations combine all four sources on a single timeline. When a motor current rise appears forty minutes before a trip, and the work history shows a missed inspection a week earlier, the story tells itself without anyone needing to argue.
Six Cause Families That Keep an Investigation From Missing the Obvious
A fishbone diagram groups possible causes into families so the team does not fix only the part it already understands. The six families below suit most manufacturing stops and give a quick checklist for any brainstorm.
Notice that measurement is a family of its own. Many repeat stops are made worse by poor data, such as a reason code so broad that it hides the pattern, and fixing the data often reveals causes that had been hidden for years.
Not All Corrective Actions Are Equal: Climb the Strength Ladder
Once the cause is known, the temptation is to write the quickest action, usually a reminder or a retraining session. These are the weakest actions because they depend on people remembering. Stronger actions change the equipment or the system so the failure cannot easily happen.
In the conveyor example, a reminder to check lubrication is weak. A preventive task that automatically reopens when a schedule changes is far stronger, and a condition alert on gearbox temperature stronger still. Combining a strong action with a quick interim step gives both safety now and prevention later.
A Fix Is Not Finished Until It Is Verified and Watched
Many investigations end with a signed report and no follow-up. The action is marked complete, the team moves on and nobody checks whether the stop actually stopped. Verification is the step that separates a plant that learns from one that simply documents.
Two additional habits make the loop stronger. First, share every closed case with the crews, because operators who see their input produce a lasting fix are far more willing to report the next problem. Second, search old cases before starting a new one, since a plant often solves the same problem on different machines without realising it.
Five Measures That Show Whether Your RCA Programme Is Working
An investigation programme needs its own scorecard. Without one, effort drifts toward the loudest stop of the week rather than the most valuable. These five measures show both the health of the equipment and the health of the process that looks after it.
Review these measures monthly with production, maintenance and quality in the same room. When the three functions see the same numbers, arguments about whose problem a stop is give way to decisions about who owns the fix.
Keeping the Chain From Alarm to Verified Fix Unbroken
The hardest part of root cause analysis is rarely the technique. It is the follow-through, with evidence scattered across systems and actions that lose their owners. iFactory AI is designed to hold the whole chain together, so each stop carries its context forward until the case is closed.
How each step connects depends on your equipment, control systems and maintenance software, which is why a short working session on one line is the best test. Teams that want to see this on their own downtime history can review a repeat-stop analysis together before deciding on a wider rollout.
What Teams Ask Before Building a Downtime Root Cause Process
See Downtime Root Cause Analysis Working on Your Own Stops
Book a session with iFactory AI to review your biggest stops, trace the patterns behind them and see how every investigation can end in a verified fix.