Every unplanned shutdown tells a story. Most manufacturers never finish reading it. They fix the symptom, reset the line, and move on — until the same failure returns three weeks later with a larger invoice. Root cause analysis exists precisely to break this cycle, yet the method you choose determines whether you achieve a durable corrective action or simply delay the next incident. The gap between a team that guesses and a team that knows costs the average mid-size manufacturer $260,000 per hour of unplanned downtime. The right RCA method — deployed at the right moment — is not a quality formality. It is a revenue protection strategy.
iFactory Quality Management Intelligence
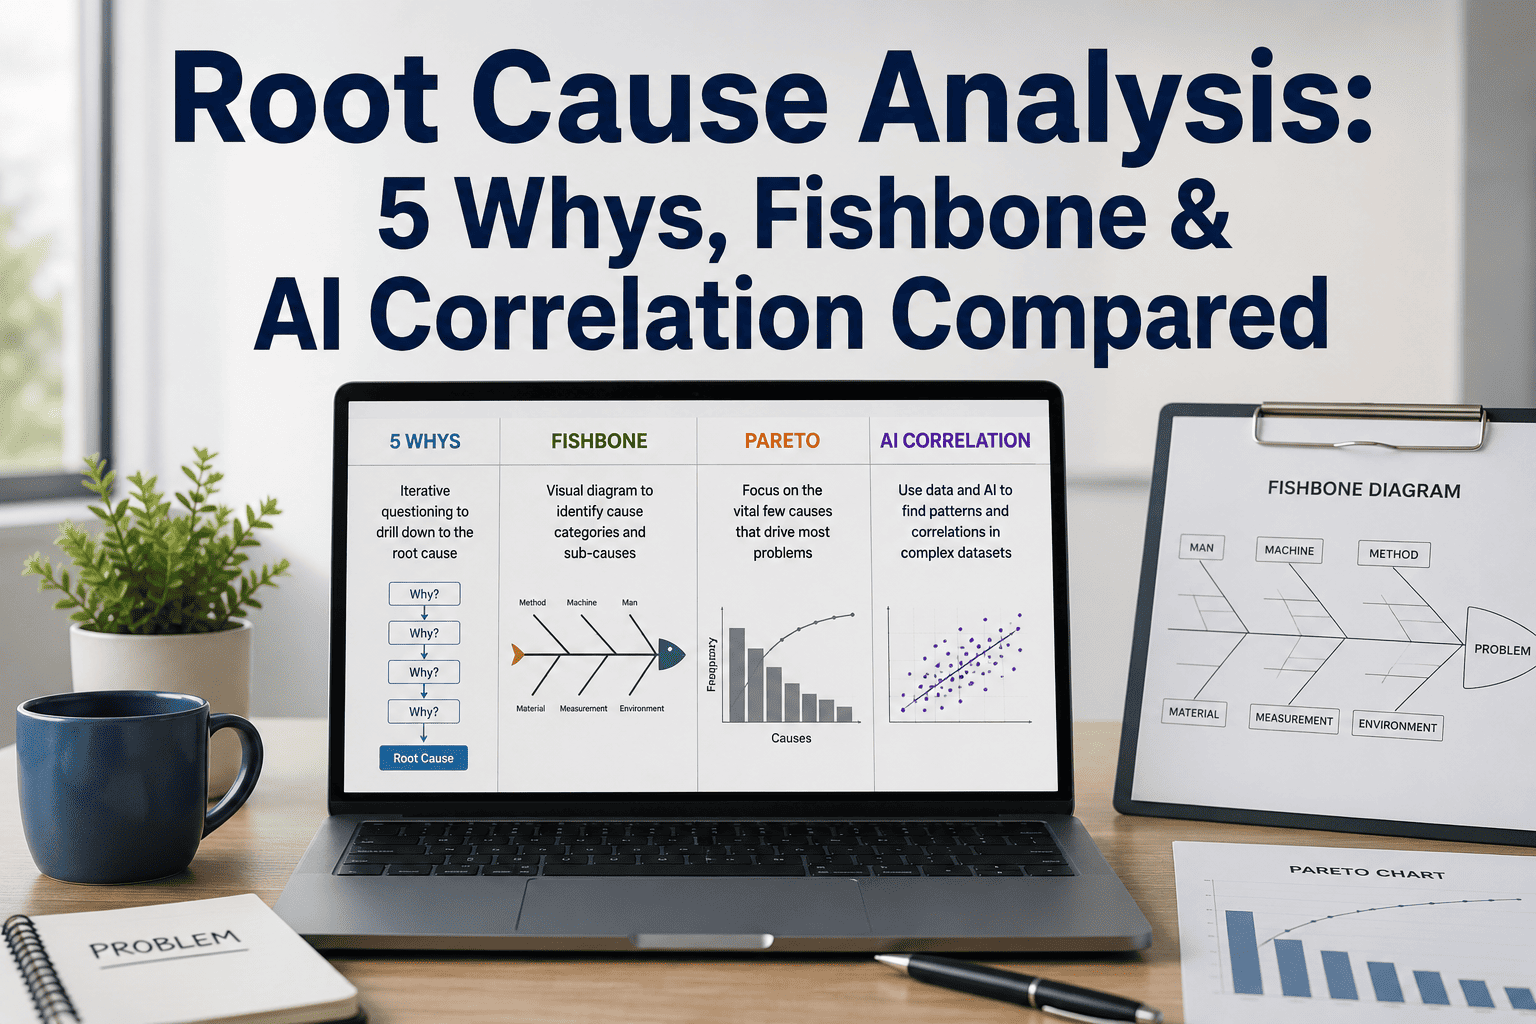
Root Cause Analysis Methods Compared: 5 Whys, Fishbone & AI Correlation
When to use each technique — and how AI-powered RCA closes the gaps that legacy methods leave open
$260K
Average cost per hour of unplanned downtime
68%
Of defects recur within 90 days without true RCA
14-21d
Earlier fault prediction with AI correlation
90%+
Predictive alert accuracy at Phase 3 maturity
Why Root Cause Analysis Determines Whether Corrective Actions Stick
Root cause analysis is the structured process of tracing a problem back to its origin — not its surface expression. A conveyor belt that jams is not the problem. The question is whether it jams because of improper tension, bearing wear, upstream product variation, or a programmable logic controller executing a flawed sequence. Each answer points to a different corrective action. Treat the wrong cause and the jam returns. Treat the right cause and it disappears permanently.
The stakes are highest in regulated manufacturing environments where repeat failures trigger customer chargebacks, audit findings, and, in food or pharmaceutical contexts, regulatory enforcement actions. RCA is not optional in these environments — it is mandated. The variable is whether teams perform it rigorously or perform it on paper.
The recurrence trap: Studies across automotive, food processing, and industrial manufacturing consistently show that 60-70% of defects corrected without structured RCA return within a single quarter. The corrective action addressed symptoms. The root cause survived untouched.
Method 1: The 5 Whys — Speed With Risk
The 5 Whys technique, developed within the Toyota Production System, works by iteratively asking "why" until the interrogation reaches a systemic cause rather than a proximate one. It is fast, requires no specialist tools, and produces a clear causal chain legible to any audience. A machine stops producing acceptable parts. Why? The cutter head dulled prematurely. Why? The lubrication cycle was skipped. Why? The automated lubrication system flagged a false sensor error. Why? The sensor was never recalibrated after the last maintenance window. Why? There is no recalibration step in the post-maintenance checklist. Corrective action: update the checklist and add sensor recalibration as a mandatory step.
Best Used When
Single failure event with a traceable causal chain
Team has direct operational knowledge of the system
Speed of analysis is a priority over exhaustiveness
Problem is relatively contained to one process area
Limitations to Know
Branching causes are missed — follows only one chain
Stops at the first plausible answer, not the deepest one
Quality of output depends entirely on facilitator skill
No structured data requirement — anecdote can mislead
Method 2: Fishbone (Ishikawa) Diagrams — Structure With Breadth
The fishbone diagram, also called the Ishikawa diagram or cause-and-effect diagram, maps potential causes across predefined categories — typically the 6Ms: Man, Machine, Method, Material, Measurement, and Mother Nature (environment). The result is a visual taxonomy of possible contributors to a quality event. This breadth is both the method's strength and its limitation: it ensures no category of cause is overlooked, but it does not rank causes by probability or weight evidence against data.
Best Used When
Multiple potential cause categories need mapping
Cross-functional teams need a shared visual language
Brainstorming phase before data collection begins
Customer-facing documentation of investigation scope
Limitations to Know
Produces hypotheses, not conclusions — data still required
Diagrams become crowded and unwieldy on complex systems
Does not quantify which branch is most likely causal
Relies on team knowledge — blind spots persist
Method 3: Pareto Analysis — Frequency Over Severity
Pareto analysis applies the 80/20 principle to quality data: typically 80% of defects originate from 20% of causes. By ranking failure modes by frequency, teams can direct corrective resources where they yield the greatest statistical impact. Pareto is a prioritisation tool more than a root cause tool — it tells you which problem to investigate first, not why it occurs.
Best Used When
Choosing where to focus quality improvement resources
Multiple defect categories need prioritisation ranking
Presenting the business case for a specific RCA focus
Tracking whether corrective actions shift failure distribution
Limitations to Know
Frequency does not equal severity — rare failures can be catastrophic
Requires accurate defect categorisation data to function
Does not explain why the leading category occurs
Static snapshot — does not detect emerging trends in real time
See AI-powered RCA in your environment. iFactory's Quality Management module connects sensor data, production history, and maintenance records to surface root causes automatically — before they become defects.
Book a Demo
Method 4: AI Correlation Analysis — Pattern Recognition at Scale
Traditional RCA methods share a dependency: human memory, human presence, and human pattern recognition applied after a failure has already occurred. AI correlation analysis changes the paradigm. By continuously monitoring sensor streams, process parameters, production records, and maintenance histories, AI models detect statistical anomalies and causal correlations that no human team could identify manually at production speed.
Where a 5 Whys session interrogates a single failure event, an LSTM-based anomaly detection model interrogates millions of data points across hundreds of assets simultaneously — and does so 24 hours a day. Where a fishbone diagram maps hypothetical causes, AI correlation quantifies which actual sensor signatures statistically preceded which failure modes, ranked by confidence score. The result is not a hypothesis. It is evidence.
Best Used When
Multiple interacting variables make manual analysis impossible
Failures need to be predicted before they occur, not investigated after
Historical data is available to train pattern recognition models
Continuous monitoring across 50+ assets is required
Competitive Advantages
14-21 day advance prediction of failure events
Correlates across asset classes, lines, and facilities simultaneously
Continuously retrains — improves with every operational cycle
Surfaces causes invisible to human observation at production speed
Comparison Matrix: Legacy RCA vs. AI-Powered Quality Management
The choice between methods is not always binary — leading manufacturers layer approaches, using AI correlation for early detection and 5 Whys or fishbone for structured documentation of confirmed causes. But the performance gap between legacy-only and AI-augmented programs is measurable and growing.
| Capability |
Legacy RCA Only |
AI-Augmented RCA |
| Detection timing |
After failure occurs |
14-21 days before failure |
| Data volume analysed |
What team members recall |
Millions of sensor data points |
| Cross-asset correlation |
Manual, inconsistent |
Automated across 200+ assets |
| Recurrence rate |
60-70% within 90 days |
Reduced to single digits |
| Investigation time |
Days to weeks per event |
Continuous, automated |
| Cause confidence score |
Subjective team consensus |
Statistical confidence ranking |
| Documentation output |
Manual report creation |
Auto-generated with data audit trail |
| ROI measurability |
Estimated, anecdotal |
Calculated, real-time dashboards |
When to Use Which Method: A Decision Framework
No single method dominates every scenario. The following framework helps quality and maintenance leaders select the right approach — or the right combination — based on the nature of the problem and available data infrastructure.
Isolated Single Failure
Use 5 Whys for speed. Supplement with fishbone if the causal chain branches at any step. Document everything — repeat events indicate a missed root cause at this stage.
Recurring Quality Defect
Deploy Pareto analysis to confirm frequency ranking, then fishbone to map contributing categories, then AI correlation to identify sensor signatures preceding each defect event.
Complex Multi-Asset Failure
AI correlation analysis is non-negotiable. Human teams cannot process the interaction effects across multiple systems at production speed. Let the model identify candidate causes; use structured methods to document and validate findings.
How iFactory's AI Quality Management Module Supports Every RCA Stage
iFactory's Quality Management platform is built on the premise that structured RCA methods and AI correlation are complementary, not competing. The platform continuously collects sensor and production data, surfaces anomaly signatures before failures occur, and provides quality teams with the evidence base needed to apply 5 Whys or fishbone with factual grounding rather than memory and opinion.
01
Real-Time Anomaly Detection
LSTM models monitor asset health continuously, flagging deviation signatures 14-21 days before failure events materialise — giving quality teams investigation time that reactive RCA never allows.
02
Automated Correlation Ranking
When an anomaly is detected, the platform ranks contributing sensor signatures by statistical correlation strength — providing a prioritised hypothesis list that replaces the blank whiteboard of a traditional fishbone session.
03
Structured RCA Workflow Integration
Quality engineers can attach 5 Whys and fishbone documentation directly to each anomaly event within the platform — creating a complete audit trail from signal detection through corrective action verification.
04
Corrective Action Effectiveness Tracking
The platform monitors whether corrective actions eliminated the causal signature. If the same anomaly pattern re-emerges post-correction, the system flags it automatically — eliminating the 90-day recurrence blind spot.
05
Compliance Documentation Generation
For regulated environments, RCA documentation is auto-generated from platform data — including timestamps, sensor logs, alert histories, and corrective action records — meeting ISO 9001, IATF 16949, and FDA 21 CFR Part 11 requirements.
Want to see AI correlation RCA on your own production data? Our engineers will map your current quality failure patterns against iFactory's detection models in a live demonstration.
Book a Demo
Frequently Asked Questions: Root Cause Analysis in Manufacturing
How many times should we ask "why" in a 5 Whys analysis?
Five is a heuristic, not a rule. The correct number is however many iterations are needed to reach a systemic cause — one that, if corrected, prevents recurrence rather than simply addressing the immediate failure. Some problems resolve at three iterations. Others require seven. Stop when the answer points to a process, policy, or system failure — not a person's individual action.
What data do we need before AI correlation RCA is viable?
At minimum, 8-12 weeks of continuous sensor data from the assets in scope. Vibration, temperature, and current data collected at 1Hz or higher provides sufficient signal density for LSTM anomaly models to establish normal operating baselines and begin detecting deviation signatures. Historical maintenance and failure records accelerate model training. iFactory's platform ingests existing SCADA and historian data alongside newly deployed sensors, maximising the value of infrastructure already in place.
Can AI RCA replace human quality engineers?
No — and it should not be positioned that way. AI correlation analysis dramatically accelerates hypothesis generation and eliminates the data-volume limitations of manual analysis. But corrective action design, stakeholder communication, and organisational change management require human judgment and contextual knowledge that models do not possess. The correct framing is augmentation: AI handles pattern detection at scale; quality engineers handle interpretation, validation, and implementation.
How do we measure whether an RCA corrective action actually worked?
Define a verification criterion before implementing the corrective action — specifically, the metric that should change and the timeframe for evaluation. For AI-monitored assets, the platform tracks whether the anomaly signature that preceded the original failure event reappears after the corrective action is implemented. If the signature returns, the root cause was not fully addressed. If it disappears, the correction is validated with data — not opinion.
Stop Investigating. Start Predicting.
Transform Root Cause Analysis from a Reactive Exercise into a Predictive Intelligence System
iFactory's AI Quality Management module gives your team the sensor data, correlation models, and structured workflow tools to identify causes before failures occur — and verify that corrective actions stick. First measurable results in 4-6 weeks.
4-6wk
To first anomaly detection results
90%+
Predictive alert accuracy
10-30x
Return on investment
$3.5M
Annual savings potential