Every defective unit that leaves your facility carries a price tag that dwarfs the cost of prevention. Industry data shows that poor quality costs manufacturers between 5% and 20% of annual revenue — yet most plants still rely on end-of-line inspection routines designed in the 1990s. In 2026, that gap between legacy quality control and AI-driven quality intelligence is no longer a competitive disadvantage. It is an existential one. This playbook gives operations and quality leaders the complete framework — from statistical process control to machine vision and digital certificates of analysis — to achieve zero-defect manufacturing at scale.
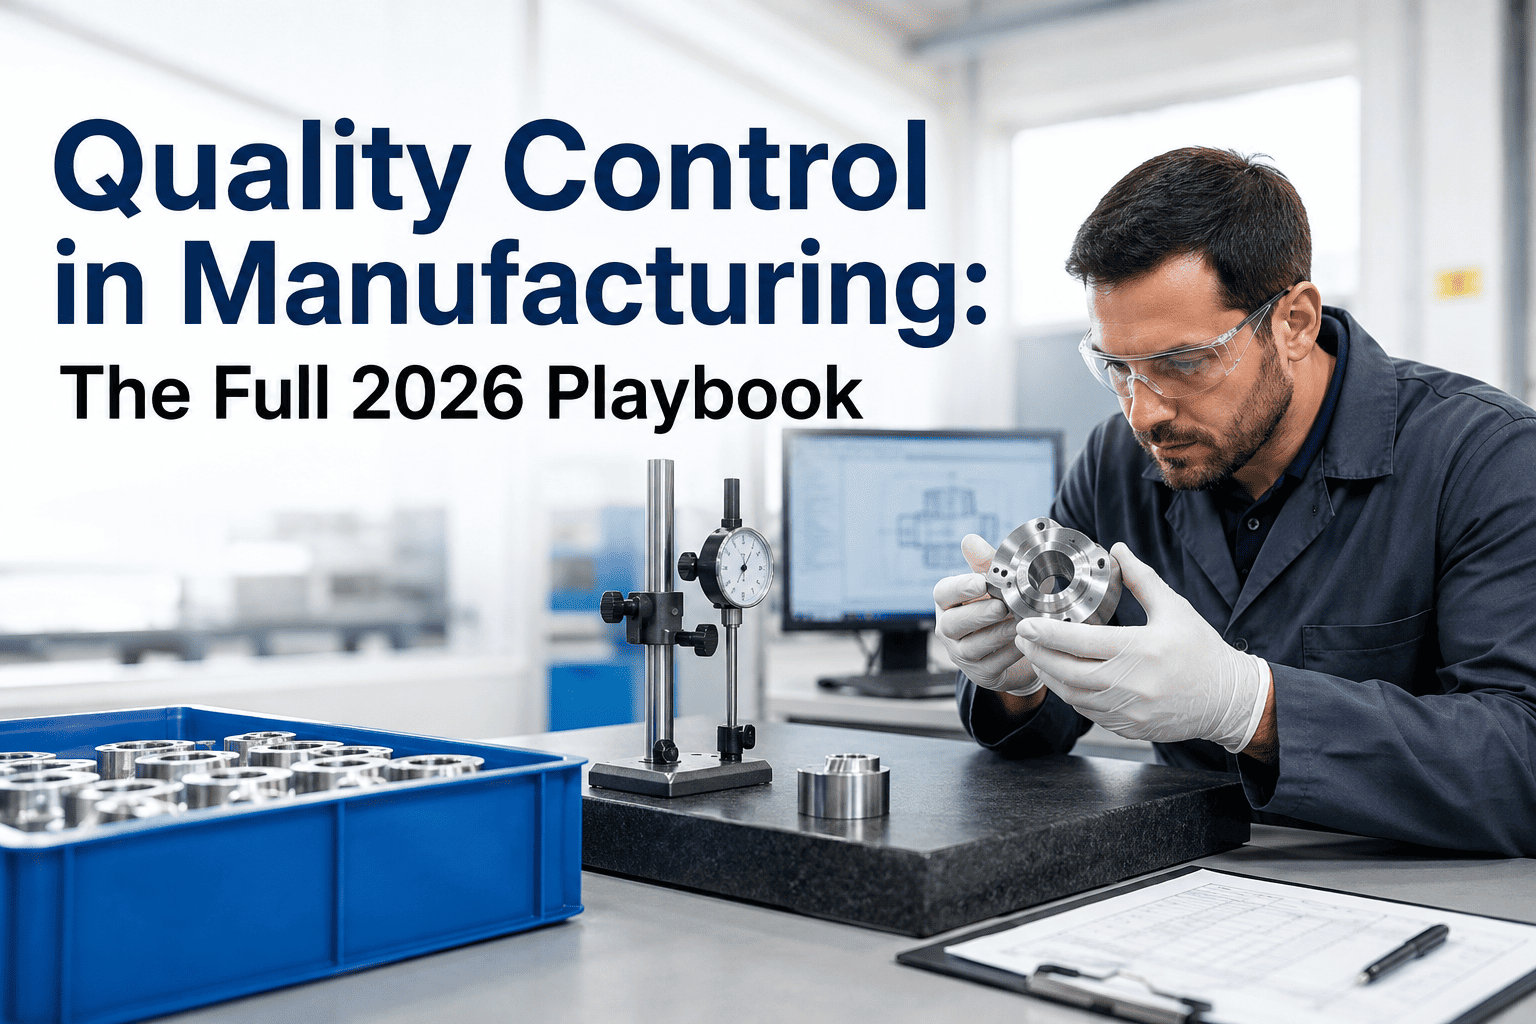
Quality Control in Manufacturing: The Full 2026 Playbook
The Cost of Standing Still
Quality failures do not announce themselves on your P&L as a single line item. They hide across warranty claims, rework labour, scrap material, customer chargebacks, expedited shipping, regulatory fines, and brand erosion. A tier-1 automotive supplier that tolerates a 0.8% defect rate on a $200M revenue line is absorbing up to $40M in quality-related losses annually — often without a clear dashboard to see it. The question is not whether you can afford to modernise quality control. The question is how long you can afford not to.
The Four Pillars of Modern Quality Control
Effective quality management in 2026 rests on four interconnected capabilities. Organisations that implement all four operate in a fundamentally different risk environment than those relying on manual sampling and visual inspection alone.
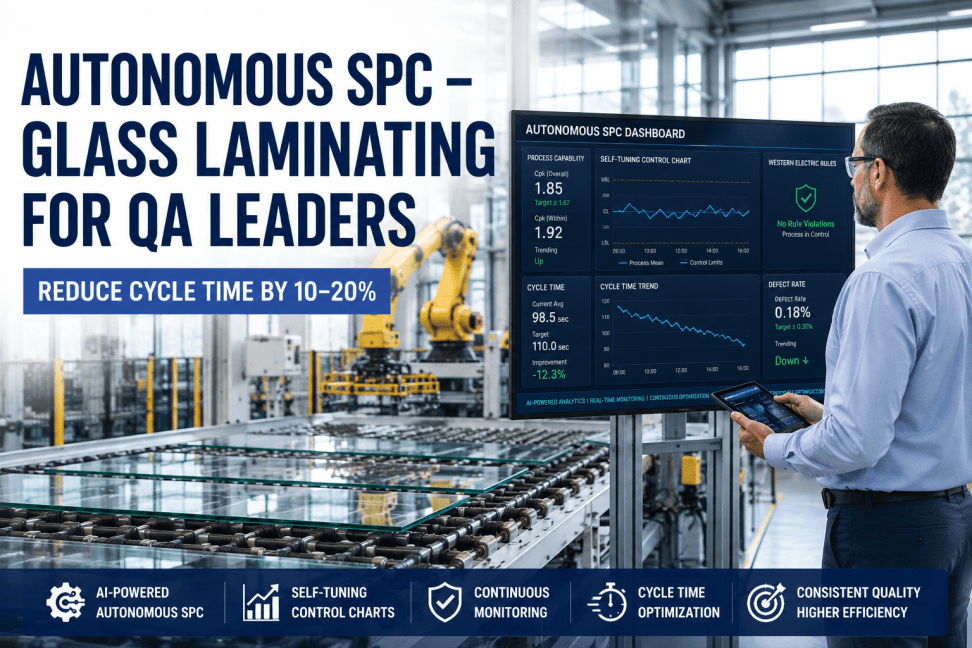
- Control charts updated in real time from SCADA and sensor feeds
- Automatic alerts when Cp or Cpk fall below threshold
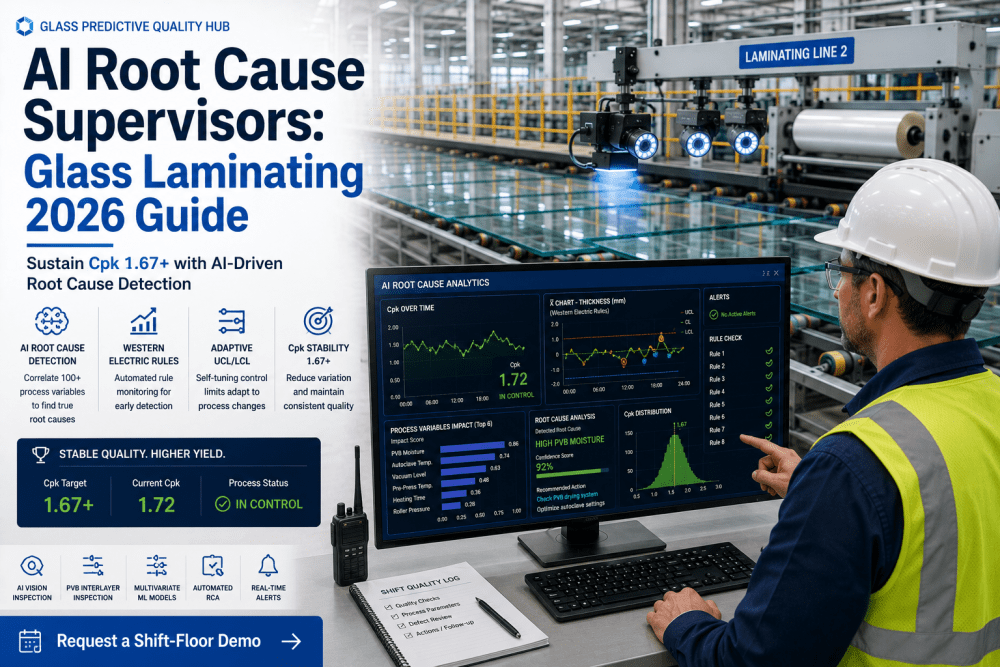
- Root cause correlation across process variables
- Shift-by-shift and line-by-line benchmarking
- 100% inline inspection at production throughput rates
- Sub-millimetre defect detection across surface, dimension, and colour
- Continuous model retraining from new defect examples
- Automated reject and divert without line stoppage
- CMM and inline gauge data integrated into the quality platform
- Automated GR&R and measurement system analysis
- First-article inspection reports generated automatically
- Tolerance stack analysis across multi-component assemblies
- COAs generated from live inspection and test data automatically
- Customer-specific format templates applied at generation
- Digital signature and compliance chain preserved in full
- Searchable lot traceability back to specific process conditions
Legacy Quality vs. Modern Quality Intelligence: The Gap in Detail
The difference between traditional quality control and AI-powered quality management is not incremental. It is architectural. The table below maps the specific operational gaps that separate manufacturers who are winning on quality from those absorbing avoidable losses every shift.
| Dimension | Legacy Friction (Old Way) | Optimized Excellence (New Way) |
|---|---|---|
| Inspection Coverage | Statistical sampling — 1–5% of output inspected | 100% inline inspection at full line speed |
| Defect Detection Point | End-of-line or post-shipment customer complaint | In-process, before defect propagates to next station |
| SPC Data Latency | Manual charting — hours or shifts behind real time | Live control charts from direct sensor and SCADA feeds |
| Root Cause Analysis | Post-mortem investigation — days after the event | Automated correlation across process variables in minutes |
| COA Generation | Manual compilation — 2–4 hours per lot document | Auto-generated from live data — seconds per lot |
| Inspector Consistency | Human variability — 15–25% GR&R error typical | Machine vision and automated gauging at sub-1% variability |
| Audit Trail | Paper records — incomplete, time-consuming to retrieve | Full digital traceability — lot to process condition in seconds |
| Customer Complaint Response | Days to assemble evidence; often incomplete data | Immediate lot-level trace report with full inspection history |
The Business Impact: Where the Numbers Land
Quality modernisation is not a cost centre initiative. It is a margin recovery and revenue protection programme. The following impact grid translates capability improvements into the business outcomes that appear on executive dashboards.
- Scrap rates reduced 40–70% through in-process defect containment
- Rework labour eliminated for defects caught at source
- Incoming inspection headcount redeployed to value-adding roles
- Warranty and return processing costs fall with outgoing quality improvement
- COA labour cost reduced by 80–90% through automation
- Production holds reduced — quality issues resolved in minutes, not shifts
- First-pass yield improvements of 12–30% across monitored lines
- Inline inspection eliminates end-of-line bottlenecks
- SPC alerts prevent process drift before batch rejection occurs
- Automated FAI reports cut new product introduction time significantly
- Customer complaint rates fall — retention and renewal rates improve
- Preferred supplier status unlocked with major OEMs requiring digital QMS
- Audit readiness continuous — no scramble before ISO or customer visits
- Recall risk reduced to near zero with full lot-level traceability
- Premium pricing justified to customers with documented quality performance
Implementation: The Phased Path to Zero-Defect Production
Deploying modern quality control does not require a plant-wide shutdown or a multi-year programme. The most successful implementations follow a phased approach — demonstrating measurable value within the first 60 days and scaling coverage methodically across lines and facilities.