Every hour your production line runs without Statistical Process Control, you are flying blind — and the data confirms it. Plants relying on manual inspection and reactive quality checks average 4.7% defect rates and lose between $1.2M and $4.8M annually in scrap, rework, and warranty claims. Your competitors who have already deployed real-time SPC dashboards have cut those losses by 68%. The question is not whether SPC pays for itself. The question is how much revenue you have already surrendered waiting to find out.
iFactory Quality Management Intelligence
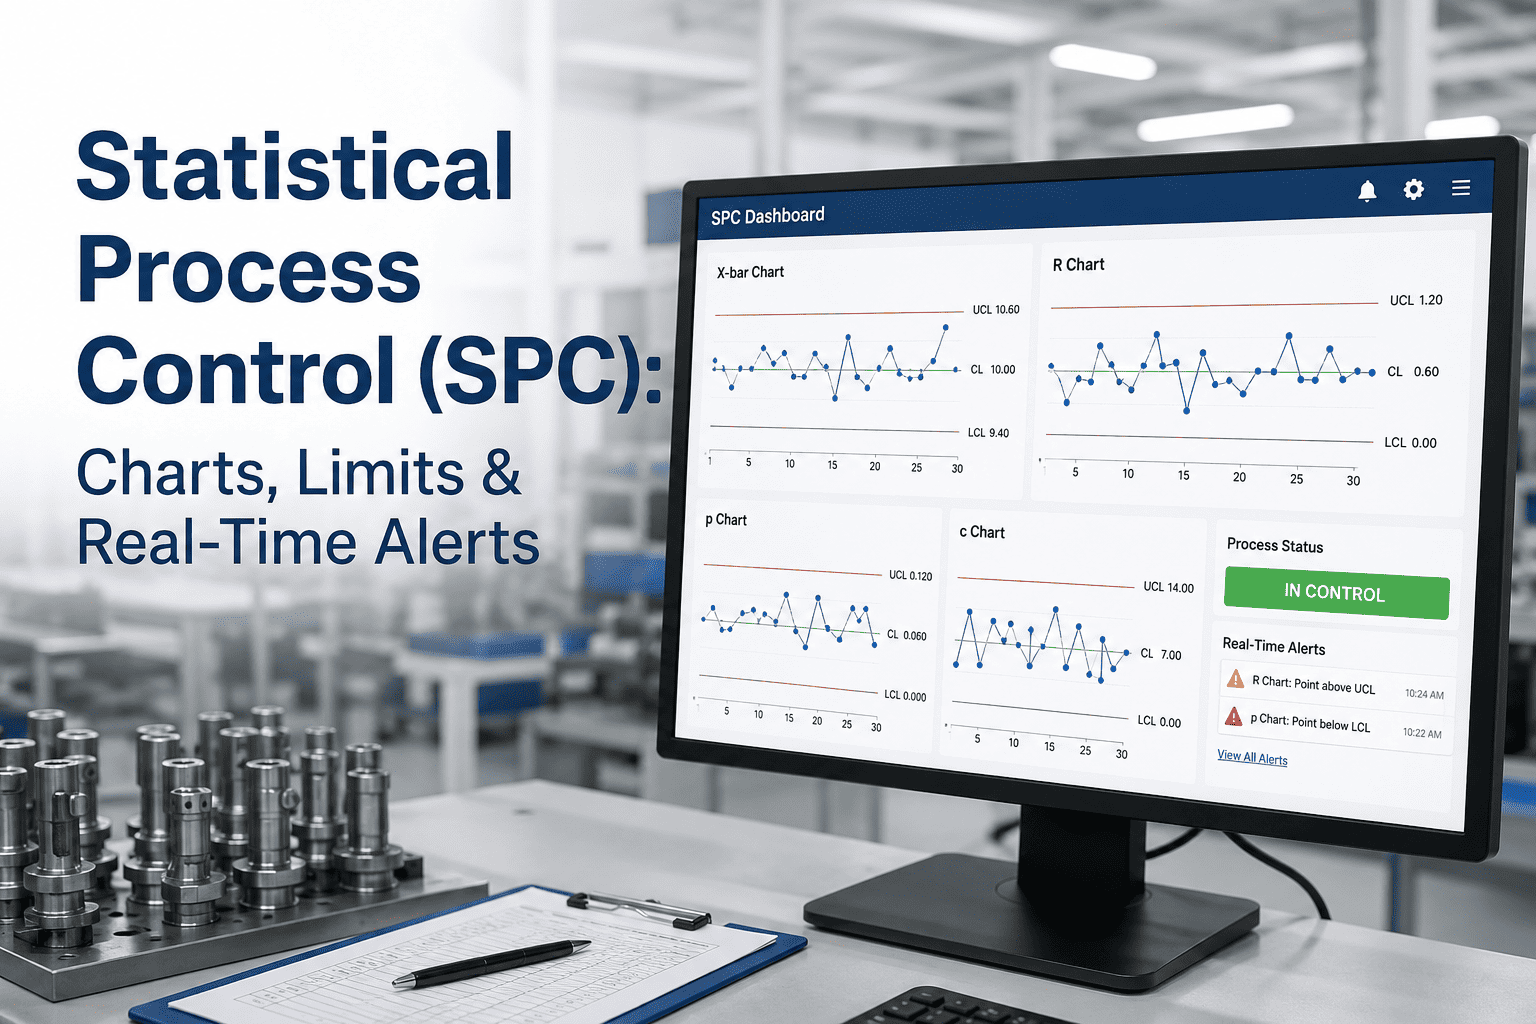
Statistical Process Control: Real-Time Charts, Control Limits & Instant Alerts
How modern manufacturers use X-bar R, p-chart, c-chart, and AI-powered SPC software to eliminate defects before they reach the customer — with measurable Cpk gains from week one.
68%
Average defect rate reduction after SPC deployment
4-6wk
Time to first measurable quality improvement
1.67+
Cpk target achieved by top-quartile SPC users
$4.8M
Annual scrap and rework cost without real-time SPC
What Is Statistical Process Control — and Why Does It Still Define World-Class Manufacturing?
Statistical Process Control is the discipline of using data, control charts, and probability theory to monitor a production process in real time — distinguishing natural variation (common cause) from abnormal signals (special cause) before defective output reaches the next station, the customer, or a recall notice. Developed by Walter Shewhart at Bell Labs and refined by W. Edwards Deming into a cornerstone of lean and Six Sigma methodology, SPC remains the single most validated quality system in industrial history. What has changed is the infrastructure: modern SPC software integrates sensor data, machine telemetry, and inline measurement systems into dashboards that flag out-of-control conditions in seconds rather than shifts.
X-bar R Chart
Monitors the mean and range of continuous variable data across subgroups. The workhorse of dimensional quality control in machining, injection moulding, and assembly operations. Detects both process drift and increased variation before defects occur.
p-Chart & np-Chart
Tracks the proportion or count of nonconforming units in variable-size or fixed-size samples. Essential for attribute inspection in electronics, packaging, and pharmaceutical batch release where pass/fail data is the primary quality signal.
c-Chart & u-Chart
Counts defects per unit or per inspection area — critical for surface defect monitoring in automotive paint, textile weaving, and printed circuit board inspection where multiple defect types can co-exist on a single product.
The Cost of Reactive Quality: Legacy vs. Real-Time SPC
The gap between manual inspection programmes and AI-powered SPC platforms is not incremental — it is structural. The table below quantifies the operational and financial difference between defending quality after the fact and controlling it in real time.
| Quality Dimension |
Legacy Friction (Old Way) |
Optimised Excellence (iFactory SPC) |
| Defect Detection Speed |
End-of-shift or end-of-batch inspection — defects batch up across hours of production |
Real-time signal detection within seconds of data collection — operator alerted before the next part is made |
| Control Limit Calculation |
Manual spreadsheet updates, often quarterly — control limits stale and irrelevant to current process behaviour |
Dynamic UCL/LCL recalculation as new data flows in — limits always reflect the true current process baseline |
| Root Cause Identification |
Reactive investigation after defect batch discovered — root cause evidence degraded or lost |
AI correlates out-of-control signals with upstream machine data, tool life, and material lot in real time |
| Process Capability (Cpk) |
Calculated monthly in isolation — no link between Cpk score and corrective action workflow |
Live Cpk dashboard with automatic CAPA trigger when capability drops below threshold |
| Operator Engagement |
Paper-based checksheets — data entry burden leads to skipped samples and falsified records |
Automated inline measurement feeds charts with zero operator input required for routine monitoring |
| Audit Readiness |
Weeks of manual data assembly for IATF 16949, FDA 21 CFR Part 11, or ISO 9001 audits |
One-click audit report export with full electronic record trail, timestamps, and control chart history |
| Scrap & Rework Cost |
4–7% defect rate typical; scrap cost 2–4% of revenue |
Sub-1% defect rate achievable; scrap cost reduced 60–75% within 12 months |
See how iFactory SPC maps to your current quality programme.
Book a Demo
How iFactory SPC Works: From Raw Sensor Data to Corrective Action in Minutes
Traditional SPC software was built for quality engineers with statistics degrees. iFactory's SPC module is built for the plant floor — intelligent enough to handle the mathematics automatically, and actionable enough that operators and supervisors know exactly what to do when a signal fires.
01
Automated Data Ingestion
- Connects to inline gauges, CMMs, vision systems, and manual entry stations via OPC-UA, MQTT, and REST API
- Ingests existing historian and SCADA data without infrastructure replacement
- Supports variable (continuous) and attribute (pass/fail) data streams simultaneously
- Zero-latency data pipeline — subgroup charts update within 2 seconds of measurement
02
Intelligent Chart Engine
- Auto-selects appropriate chart type based on data characteristics and sample size
- Calculates UCL, LCL, and centreline dynamically using Phase I and Phase II SPC methodology
- Applies all eight Western Electric detection rules simultaneously — not just the basic ±3σ rule
- Highlights run patterns, trends, mixtures, and stratification that single-rule systems miss
03
Escalating Alert Workflow
- Operator alert fires within seconds of out-of-control detection — push notification, dashboard flag, and shop floor andon light integration
- Supervisor escalation if operator response is not acknowledged within defined window
- AI suggests probable root cause based on correlated process variables at time of signal
- CAPA workflow auto-generated and assigned — no manual ticketing required
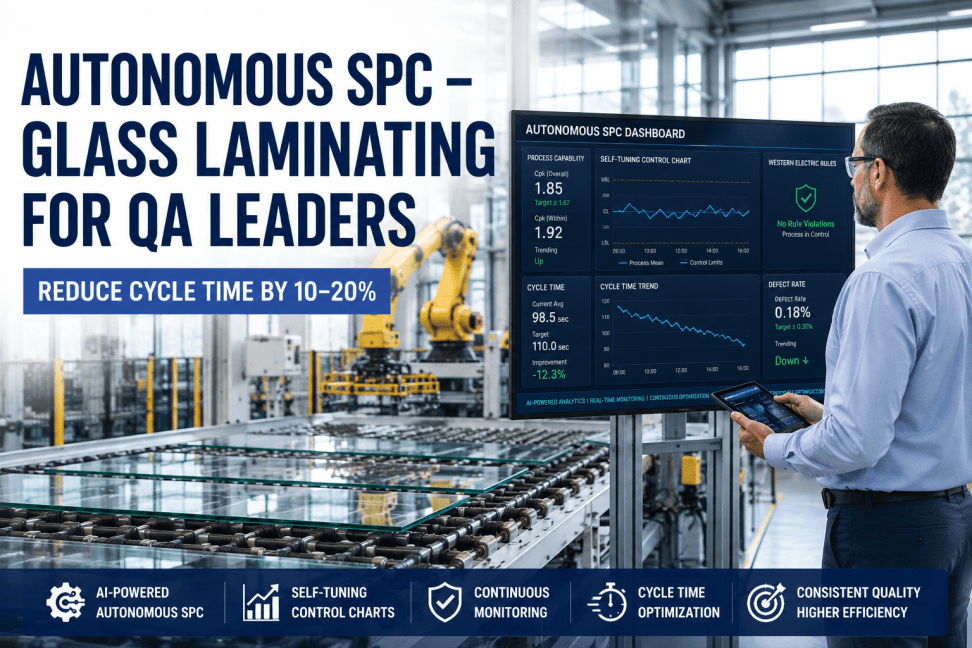
Process Capability: Moving Beyond Cpk as a Reporting Number
Cpk is the most widely cited process capability index in manufacturing — and the most widely misused. In most plants, Cpk is calculated monthly, reported in a quality meeting, and disconnected from any operational response. A Cpk of 0.95 triggers a slide deck, not a corrective action. iFactory SPC converts capability from a lagging report into a live operational signal. When Cpk drops below your defined threshold — whether 1.33 for general production or 1.67 for safety-critical characteristics — the system automatically initiates the response chain: engineering notification, process parameter review, and optional production hold pending investigation.
1.00
Minimum Acceptable
3.4% of parts outside specification at ±3σ. Process barely capable — requires immediate improvement programme.
1.33
Industry Standard
63 ppm defect rate. Required by most automotive OEMs and aerospace primes for production approval.
1.67
World-Class Target
0.57 ppm defect rate. Achieved by top-quartile SPC users. Enables warranty cost reduction and premium positioning.
SPC Across Your Quality Stack: Integration Points That Matter
SPC data is only as powerful as the decisions it enables. iFactory's architecture connects real-time control chart data to every downstream quality and operational system — transforming SPC from an isolated quality function into the data backbone of your entire production intelligence layer.
ERP Integration
SPC out-of-control events automatically flag affected production lots in SAP, Oracle, and Microsoft Dynamics — enabling immediate lot traceability without manual cross-referencing
CMMS Linkage
Process drift signals correlated with maintenance history to distinguish tool wear, fixture degradation, and calibration drift from material or operator variation
MES Feedback
SPC alerts pause production orders and trigger process hold workflows in real time — preventing continued output of potentially nonconforming parts during investigation
Digital Twin Layer
Control chart data feeds the asset digital twin — linking product quality variation to equipment condition and enabling predictive quality models that anticipate defect spikes before they appear on the chart
Supplier Quality Portal
Incoming material lot data ingested and charted automatically — SPC-driven incoming quality decisions replace manual sampling plans for approved suppliers with demonstrated capability history
Frequently Asked Questions: SPC in Modern Manufacturing
How do we choose between X-bar R, X-bar S, and individuals charts?
Chart selection depends on subgroup size and measurement frequency. X-bar R charts are appropriate for subgroups of 2–10 with multiple measurements per interval. X-bar S charts are preferred for subgroups larger than 10 where the standard deviation is a more efficient estimator than the range. Individuals (I-MR) charts apply when only one measurement is available per time period — common in chemical batch processes and slow-cycle machining. iFactory's chart engine selects automatically based on your data stream configuration, eliminating guesswork.
What is the minimum data volume needed to establish valid control limits?
Phase I control limit calculation typically requires 25–30 rational subgroups of stable data — representing approximately 100–150 individual measurements for a standard X-bar R chart. iFactory's Phase I module guides users through data collection, identifies and flags outliers for exclusion review, and calculates provisional limits with explicit confidence intervals so you know how reliable your initial limits are before switching to Phase II monitoring.
How does SPC interact with our existing ISO 9001 and IATF 16949 quality management system?
SPC is a core requirement of IATF 16949 Clause 9.1.1.1 and is explicitly referenced in the AIAG SPC Reference Manual (3rd edition) used by all major automotive OEMs. iFactory's SPC module generates audit-ready evidence packages including control chart history, process capability studies, and alert response records formatted to AIAG requirements. Full electronic records with user authentication and timestamp trails satisfy FDA 21 CFR Part 11 requirements for regulated industries.
Can SPC be applied to both high-volume repetitive manufacturing and low-volume job shops?
Yes, with different chart strategies. High-volume environments suit traditional subgroup charts with fixed rational subgroup sizes and rapid sampling intervals. Low-volume and high-mix environments benefit from short-run SPC techniques — standardised charts that normalise data across part families using deviation from nominal, enabling meaningful control charts even when no individual part number generates sufficient volume for traditional Phase I analysis.
How quickly can we deploy iFactory SPC alongside our existing quality infrastructure?
Most deployments achieve live control charts within 3–5 business days for assets with existing digital measurement outputs. Plants with manual gauging or paper-based inspection systems typically reach full deployment in 2–3 weeks, inclusive of operator training. iFactory integrates via standard APIs and runs alongside existing LIMS, CMMS, and ERP systems without displacing any current workflows during the transition period.
Real-Time SPC. Measurable Quality. From Week One.
Stop Discovering Defects After the Fact. Start Controlling Quality in Real Time.
iFactory's SPC module connects to your measurement systems in days, delivers live X-bar R, p-chart, and c-chart dashboards with AI-powered root cause correlation, and gives your quality team the tools to achieve Cpk 1.67+ within 12 months. Every out-of-control signal triggers an automatic response workflow. Every improvement is tracked in financial terms your leadership team can act on.
68%
Defect rate reduction
1.67+
Cpk target achievable
$4.8M
Annual scrap cost eliminated