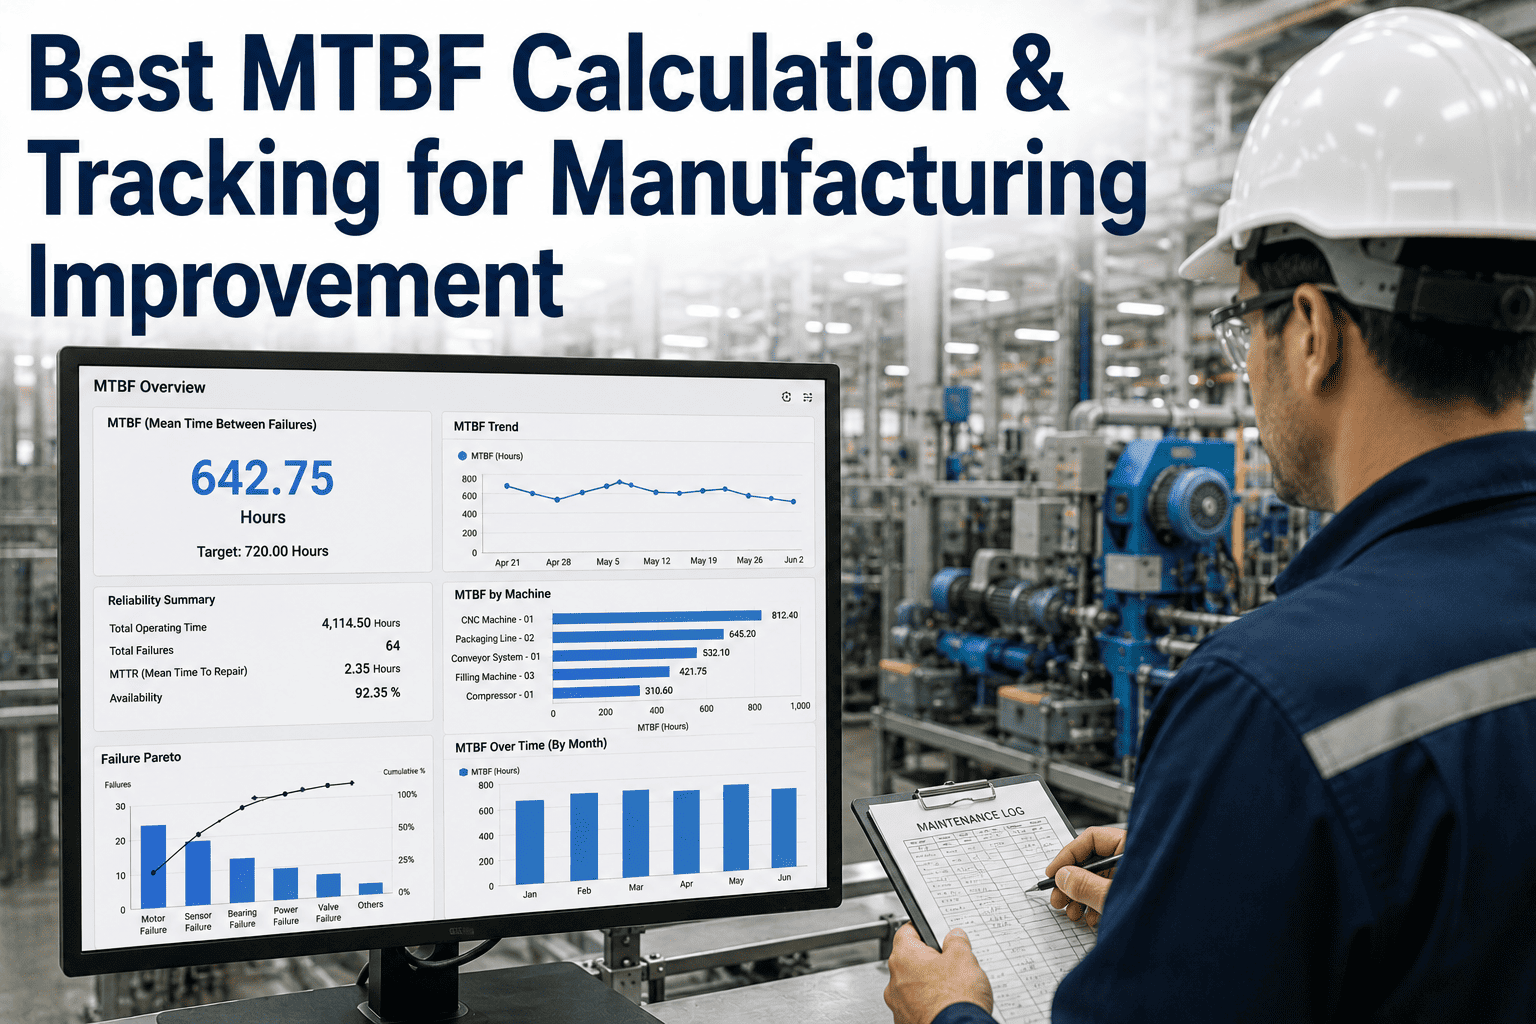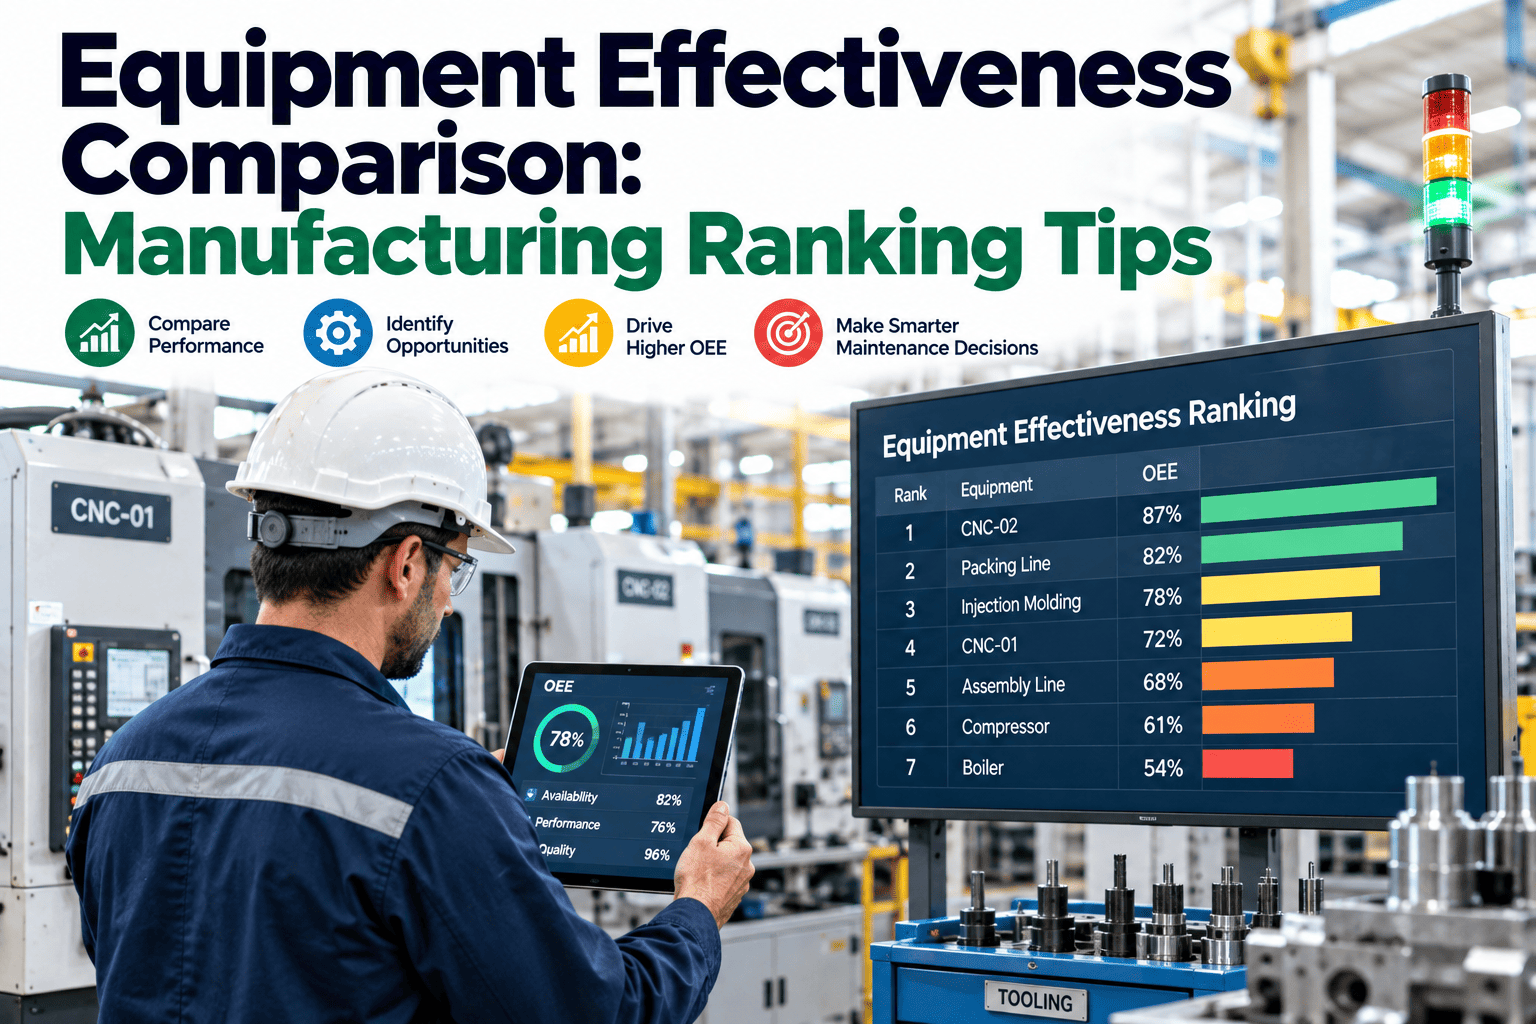
Ranking equipment or production lines by raw OEE feels like an obvious way to find your best and worst performers, until you actually look closely at what's being compared. A line running a single simple product all shift will almost always out-score a line juggling frequent changeovers across a dozen product variants, not because it's better managed but because its ideal cycle time math is simply more forgiving. Comparing raw scores across equipment with different product mixes, different maintenance schedules, and different design speeds tends to reward the easiest job in the plant rather than the best-run one, and acting on that ranking without adjusting for it can send improvement resources to the wrong place entirely. See what a fair, normalized equipment comparison actually looks like across your lines.
Raw OEE Ranking Rewards the Easiest Job, Not the Best-Run One
Comparing equipment fairly means adjusting for product mix, changeover frequency, and design speed differences first. Otherwise the ranking just reflects which line has the simplest job.
typical OEE gap between a simple single-product line and a complex multi-changeover line, unrelated to management quality
variables that commonly need normalization before an equipment comparison becomes genuinely fair
the number of equipment rankings a plant should trust, once normalized for the factors that make raw comparison misleading
A Normalized Effectiveness Ranking
Once product mix and changeover complexity are adjusted for, a ranking actually reflects how well each line is run relative to its own realistic potential.
Line 4 — Assembly Cell
Line 1 — Primary Molding
Line 3 — Multi-Variant Packaging
Line 2 — CNC Machining Cell
Line 5 — Legacy Finishing
Build a Ranking That Actually Points to the Right Fix
iFactory normalizes your equipment data for product mix and changeover complexity to show which lines are genuinely underperforming versus just running a harder job.
What Actually Needs to Be Normalized
Three factors account for most of the unfair variance in raw OEE comparisons across different equipment and lines.
Product Mix Complexity
A line running many low-volume variants absorbs far more changeover time than one running a single high-volume product, which needs to be reflected in the comparison rather than penalized outright.
Planned Maintenance Schedule Differences
Equipment on a more aggressive preventive maintenance schedule loses more planned time than equipment maintained less frequently, which affects availability in a way that isn't a performance failure.
Equipment Age and Design Speed
Older equipment often has a lower design speed than newer replacements, and comparing performance against the equipment's own realistic ideal rate matters more than comparing against a plant-wide average.
Comparison Approach and What It Actually Tells You
The method used to compare equipment determines whether the resulting ranking is useful for allocating improvement resources or just misleading.
Building a Comparison Worth Acting On
A fair equipment ranking is a data normalization exercise before it's anything else.
Document what makes each line different
Product mix, changeover frequency, maintenance schedule, and design speed for each line get documented first, since these are the variables any fair comparison needs to account for.
Normalize against each line's realistic potential
Rather than comparing every line against a single plant-wide target, each line gets compared against its own achievable ceiling given its actual product mix and equipment design.
Rank the normalized gap, not the raw score
The resulting ranking reflects how far each line sits from its own realistic potential, which is what should actually drive where improvement resources go next.
What Changes When the Ranking Is Actually Fair
Figures reflect typical outcomes within the first two quarters after moving from raw OEE ranking to a normalized equipment comparison.
A Plant Manager's View on Fair Equipment Comparison
Our legacy finishing line always came in last on the raw OEE ranking, and it took an uncomfortable amount of time before we realized it was being compared against lines running a fraction of the product variety it handled. Once we normalized for changeover complexity, it turned out to be one of our better-run lines, and the line we actually needed to focus on had been hiding near the middle of the raw ranking the whole time.
The Bottom Line on Equipment Effectiveness Comparison
A raw OEE ranking answers a question nobody actually asked — which line has the easiest job — instead of the one that matters: which line is furthest from its own realistic potential. Normalizing for product mix, maintenance schedule, and design speed before ranking equipment turns a comparison that quietly rewards simplicity into one that actually points improvement resources at the right target.
Frequently Asked Questions
How is a line's "realistic potential" actually determined for normalization?
Realistic potential is typically established from the equipment's own historical best-performance periods under similar product mix conditions, rather than an arbitrary plant-wide target, since that gives each line a genuinely achievable benchmark based on what it has actually proven capable of. Book a review to see how this would be calculated for your specific lines.
Does normalizing the comparison mean some lines get an easier standard to meet?
Normalization doesn't lower the bar — it sets a fair one. A complex multi-product line is still expected to perform as well as it realistically can given its own conditions, it just isn't penalized for a structural difference in job complexity that has nothing to do with how well it's being run.
Can this comparison work across completely different equipment types, not just similar lines?
Yes — normalized comparison is actually most valuable across dissimilar equipment types, since raw OEE comparison across a CNC cell and a packaging line was never meaningful to begin with, whereas a normalized gap-to-potential comparison gives a genuinely apples-to-apples view regardless of what each line actually does.
How often should the normalized ranking be recalculated?
Continuous recalculation is ideal since product mix and equipment condition change regularly, but at minimum the ranking should be revisited whenever a line's product mix shifts meaningfully, since a normalization baseline built on outdated mix assumptions can become just as misleading as no normalization at all.
Does this replace individual line OEE tracking or work alongside it?
Normalized comparison works alongside individual line OEE tracking rather than replacing it — each line still needs its own detailed availability, performance, and quality breakdown, and the normalized ranking simply adds a fair cross-line view for prioritizing where to focus improvement effort next. Talk to a specialist about combining both views for your specific plant.
Stop Ranking Your Easiest Line as Your Best One
Book a 30-minute assessment. iFactory reviews your equipment data and shows exactly what a fair, normalized comparison would reveal.