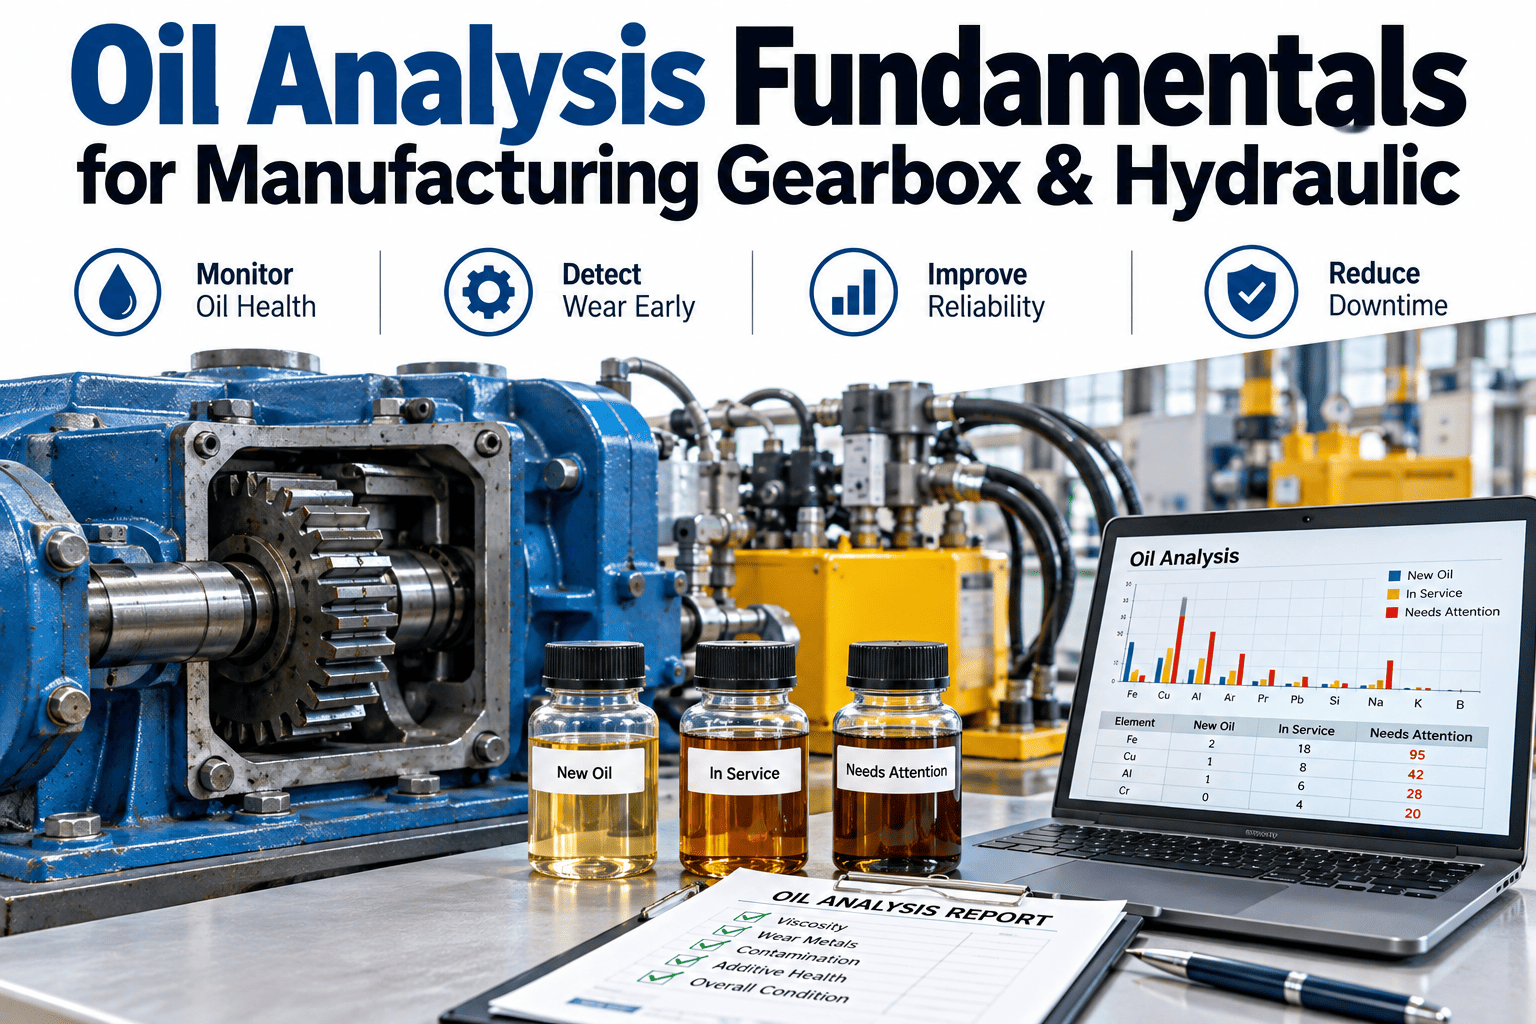
Oil isn't just a lubricant sitting inside a gearbox or hydraulic system — it's a continuous record of everything happening inside that equipment, carrying wear particles, contamination, and chemical breakdown byproducts that a trained analysis program can read like a diagnostic report. Most plants that skip oil analysis aren't ignoring a nice-to-have; they're ignoring one of the earliest and cheapest warning systems available for exactly the kind of internal wear that vibration sensors alone can miss. Teams building or refining an oil analysis program can Book a Demo to see how iFactory tracks oil analysis trends against maintenance action.
Why Oil Analysis Catches What Other Methods Miss
Vibration analysis excels at detecting mechanical faults that create a physical signature — imbalance, misalignment, bearing defects with a distinct frequency pattern. Oil analysis excels at something different: it detects the wear debris and chemical changes that result from those faults, and from failure modes that don't necessarily produce a strong vibration signature at all, like early-stage gear tooth wear, seal degradation, or lubricant breakdown from thermal stress. The two methods are complementary rather than redundant, and a program relying on vibration alone leaves an entire category of developing problems invisible until they progress far enough to show up mechanically.
Getting the Sample Right: Why Technique Matters as Much as the Lab
An oil analysis program is only as good as the sample it's built on, and sampling technique errors are the single most common source of misleading results — more common, in practice, than laboratory analysis errors. A sample drawn from a static, settled reservoir rather than while the system is running and circulating won't reflect what's actually suspended in the oil during operation. A sample drawn from a dirty valve or an inconsistent sampling point introduces contamination that has nothing to do with the equipment's actual condition, and can trigger a false alarm that erodes trust in the whole program.
Sample While Running
Drawing a sample during normal operation, ideally after the system has been running long enough to circulate wear particles evenly, gives a far more representative picture than a static sample.
Consistent Sampling Point
Using the same dedicated sampling valve every time, rather than varying location, keeps results comparable across the trend history for that specific asset.
Clean Technique
Flushing the sampling point before drawing the actual sample and using clean, dedicated sampling equipment prevents contamination from skewing particle counts.
The Core Analysis Parameters and What Each One Reveals
A standard oil analysis panel covers several distinct parameters, each sensitive to a different kind of problem. Viscosity confirms the oil is still within its intended operating range, since a viscosity shift can indicate contamination with another fluid or thermal breakdown. Particle count and wear metal analysis reveal how much material is actually wearing away inside the equipment, and which specific metals are present points toward which component is generating the wear. Water content and other contamination indicators reveal whether outside contaminants are entering the system, often through a compromised seal.
Trend Interpretation: Why One Sample Rarely Tells the Full Story
A single oil analysis result provides a snapshot, but the real diagnostic value comes from trending results over multiple sampling intervals. A wear metal reading that's elevated compared to a generic industry benchmark might still be entirely normal for a specific asset that has always run slightly higher, while a reading within generic normal range that has been steadily climbing sample after sample can represent a more urgent developing problem than the absolute number alone would suggest. Establishing an asset-specific baseline from its own sampling history, rather than relying solely on generic reference ranges, is what turns oil analysis from a pass-fail check into a genuine predictive tool.
| Interpretation Approach | Strength | Limitation |
|---|---|---|
| Generic reference range | Useful starting point with no sampling history yet | Doesn't account for asset-specific normal operating variation |
| Asset-specific trend | Detects meaningful change even within generic normal range | Requires several samples of history before becoming reliable |
| Combined approach | Uses generic ranges early, shifts to trend-based judgment over time | Requires discipline to keep sampling consistently through the transition |
Setting a Sampling Frequency That Matches Asset Criticality
Not every gearbox or hydraulic system needs the same sampling frequency. A bottleneck asset where failure would stop an entire line justifies monthly or even more frequent sampling, while a lower-criticality asset with adequate redundancy might be sampled quarterly without meaningfully increasing risk. Matching sampling frequency to criticality, rather than applying one fixed interval across every asset in a fleet, directs the ongoing cost of a sampling program toward the equipment where early detection actually matters most.
Frequently Asked Questions: Oil Analysis Fundamentals
How soon after a sample is drawn should it reach the lab for accurate results?
Prompt shipping matters more for some parameters than others — water content and certain contamination indicators can shift if a sample sits too long before analysis, so most labs recommend shipping within a few days of drawing the sample rather than letting samples accumulate for a batch shipment weeks later. Establishing a consistent shipping cadence as part of the sampling routine keeps results reliable and comparable across the trend history. Teams building this discipline can Book a Demo to review a sampling and shipping cadence for a specific fleet.
Can oil analysis alone tell us exactly which component inside a gearbox is wearing?
Wear metal analysis can narrow down likely sources significantly, since different components are typically made from different alloys that leave a distinct metallic signature in the oil, but pinpointing the exact component with full certainty often benefits from combining oil analysis with vibration data or a physical inspection, particularly when multiple components share similar metallurgy.
How do we know if an elevated reading is a lab error versus a genuine equipment problem?
A single elevated reading that doesn't fit the asset's established trend history is worth a resample before assuming either a lab error or a genuine problem, since resampling is a faster and cheaper way to resolve the ambiguity than acting on a single data point that might simply reflect a sampling or lab handling inconsistency.
Does switching oil brands or suppliers affect how we should interpret trend history?
Yes — different oil formulations can have different baseline characteristics even when serving the same application, so a supplier or formulation change is worth flagging in the trend record, since a shift in baseline viscosity or additive package composition around that date shouldn't be misread as an equipment condition change when it's actually a lubricant change.
What is a reasonable starting sampling frequency for a plant with no existing oil analysis program?
Starting with quarterly sampling on the highest-criticality gearbox and hydraulic assets gives a new program a manageable starting scope while still building a useful trend history within the first year, and frequency can be adjusted asset by asset once initial results establish which equipment shows enough variation to justify closer monitoring. Contact iFactory Support for help scoping an initial sampling program.