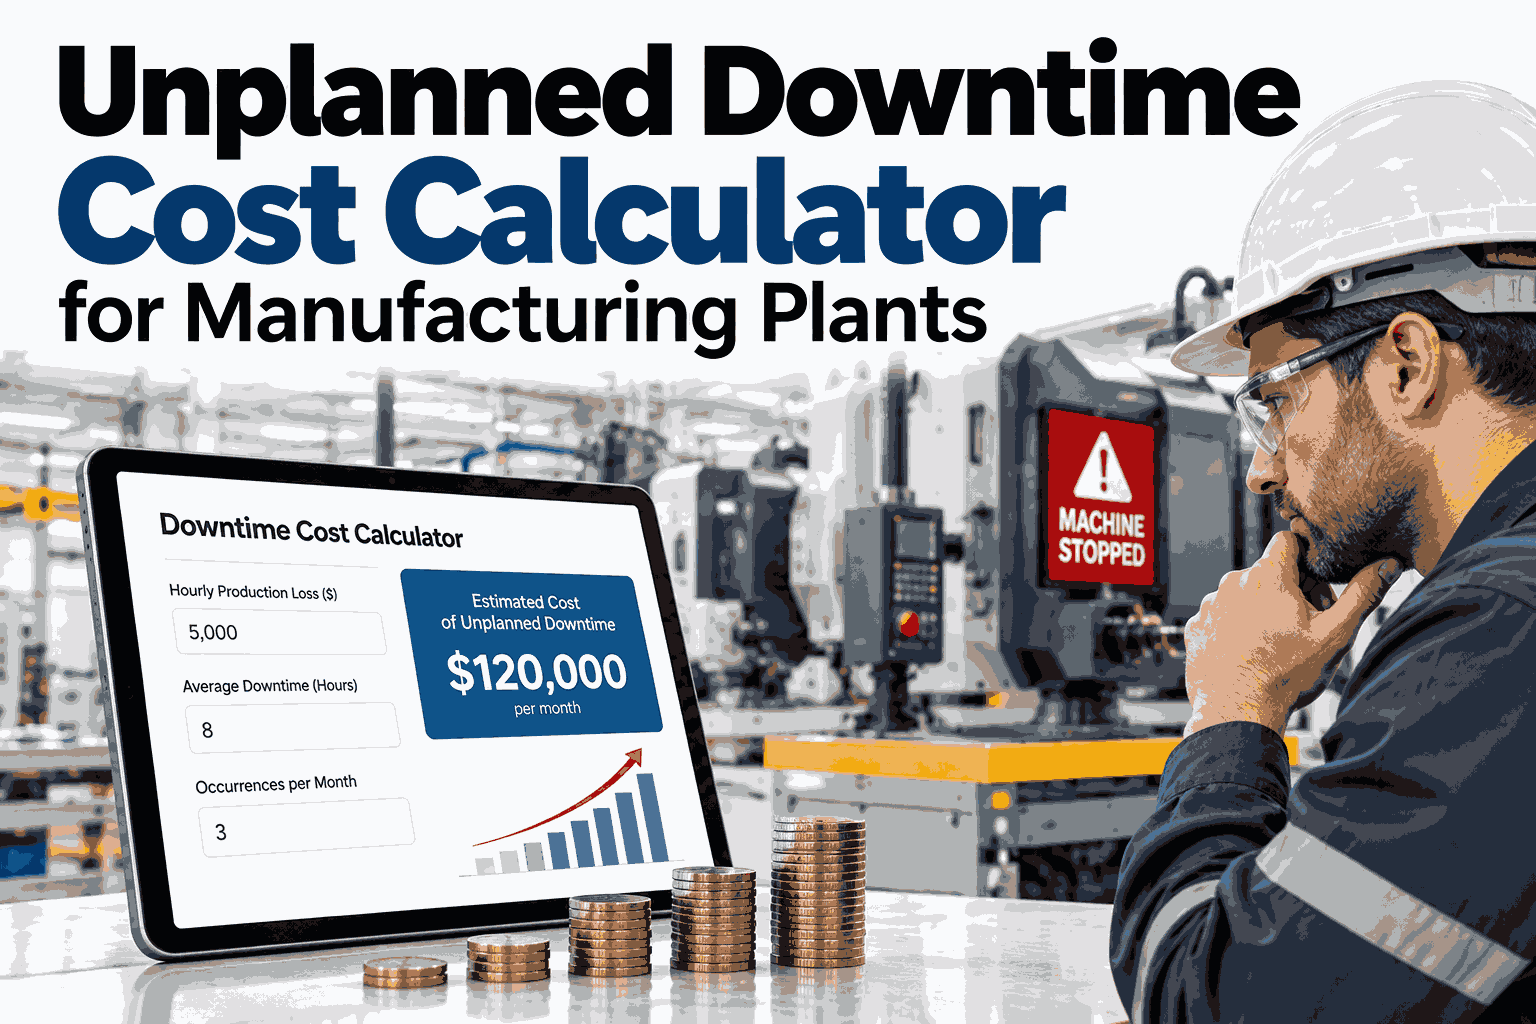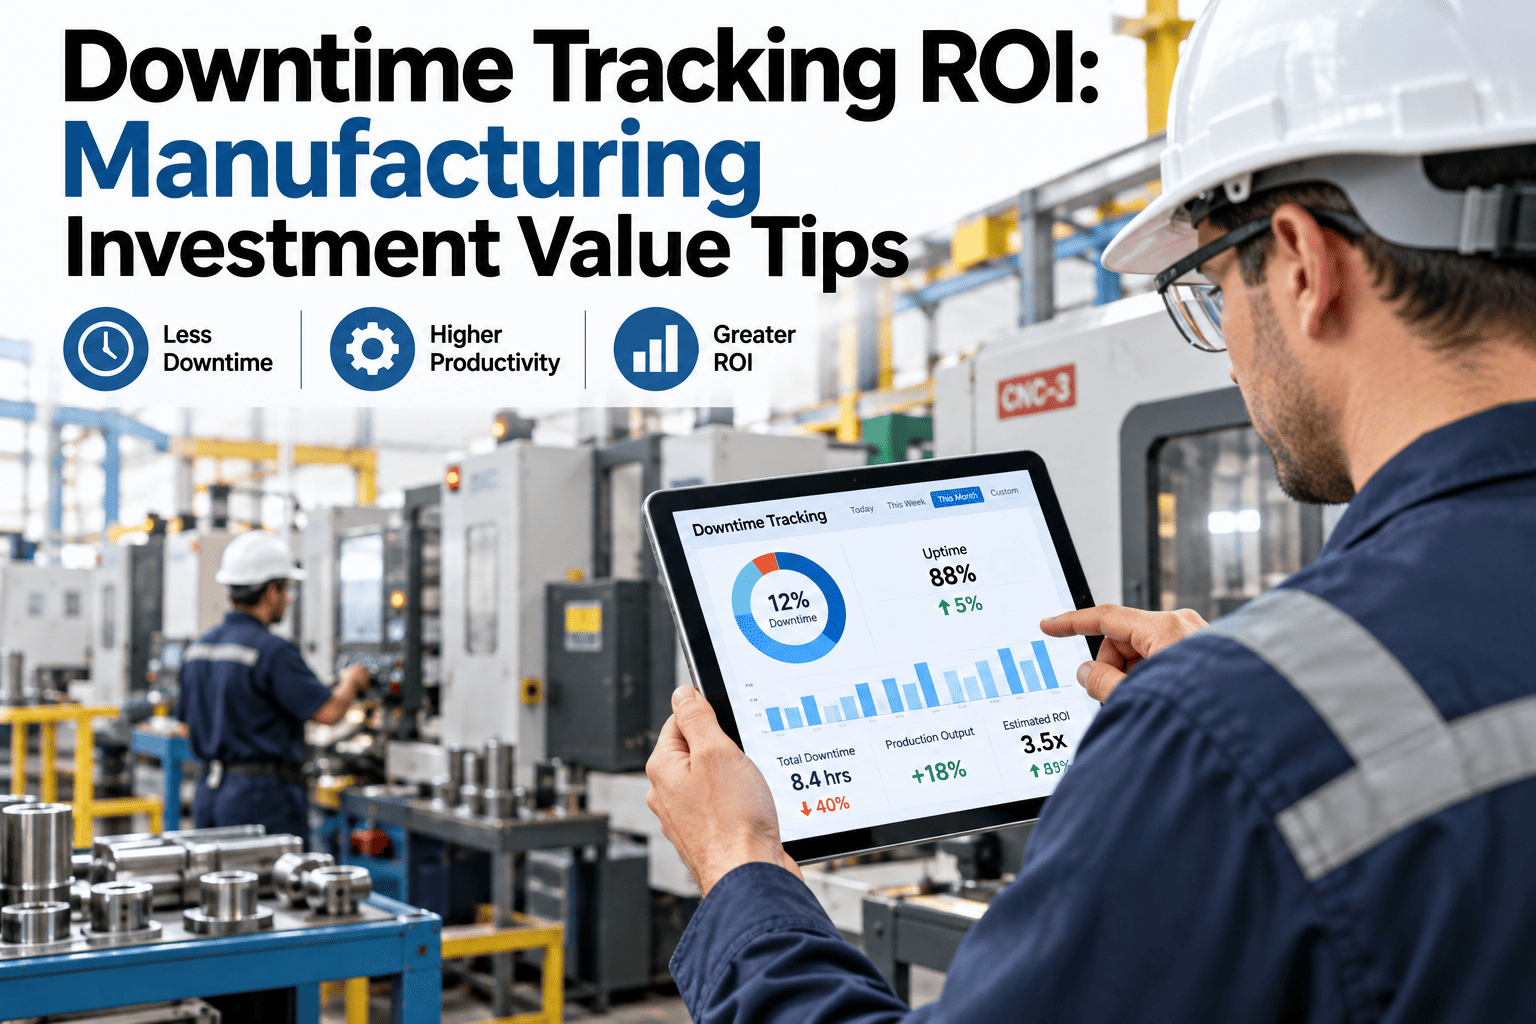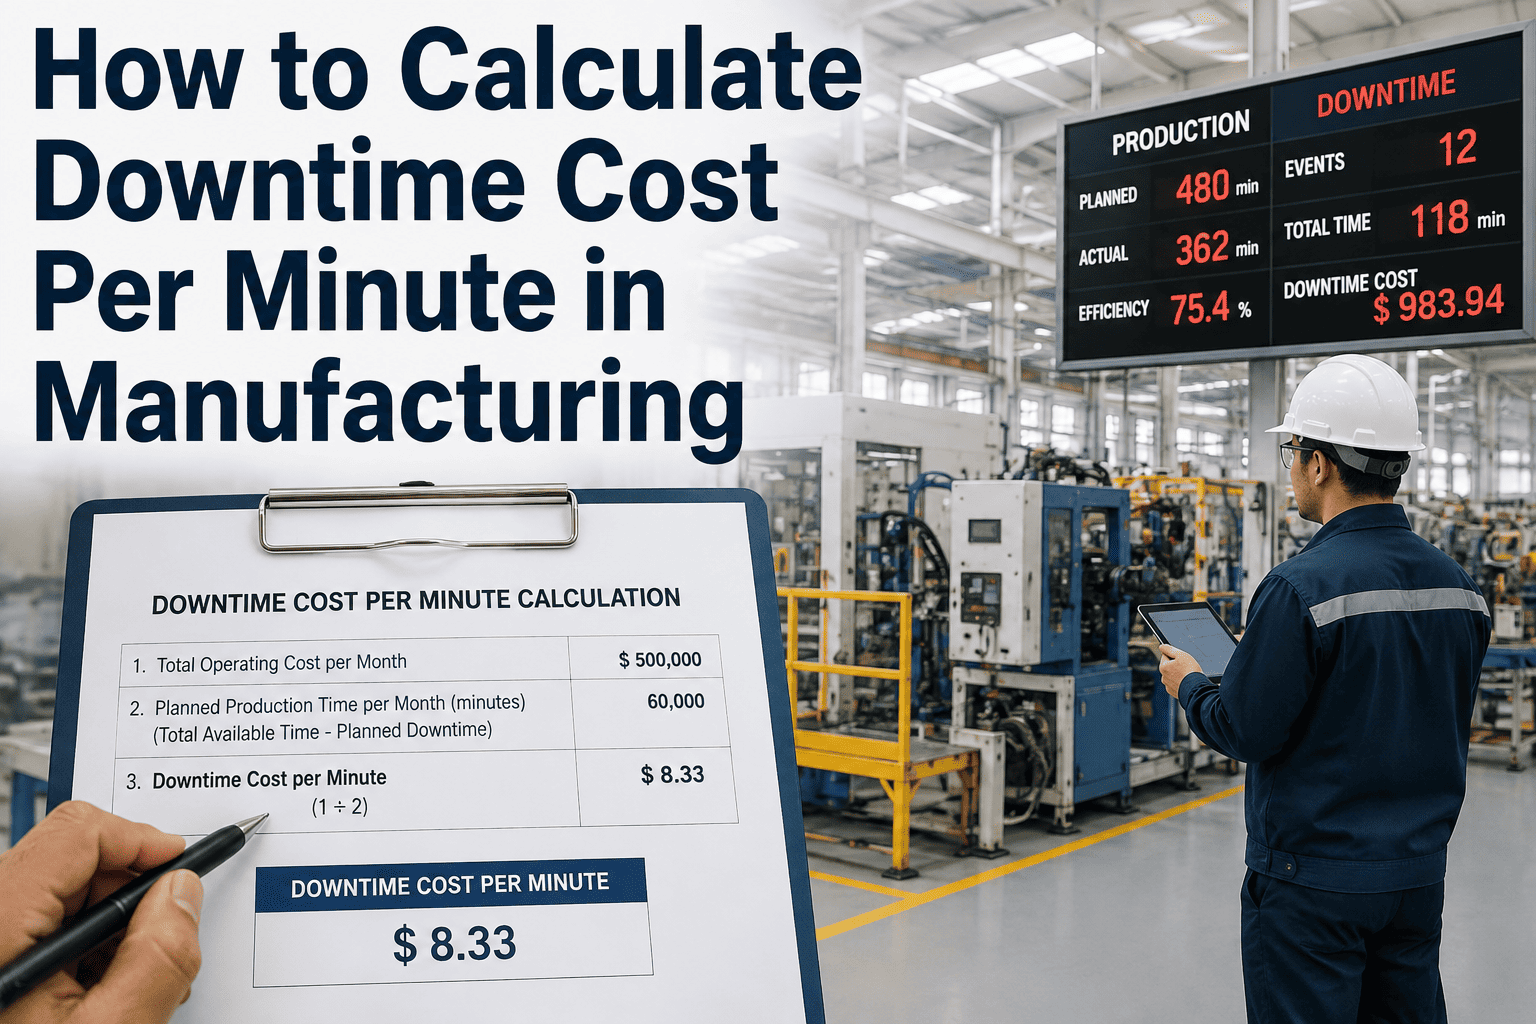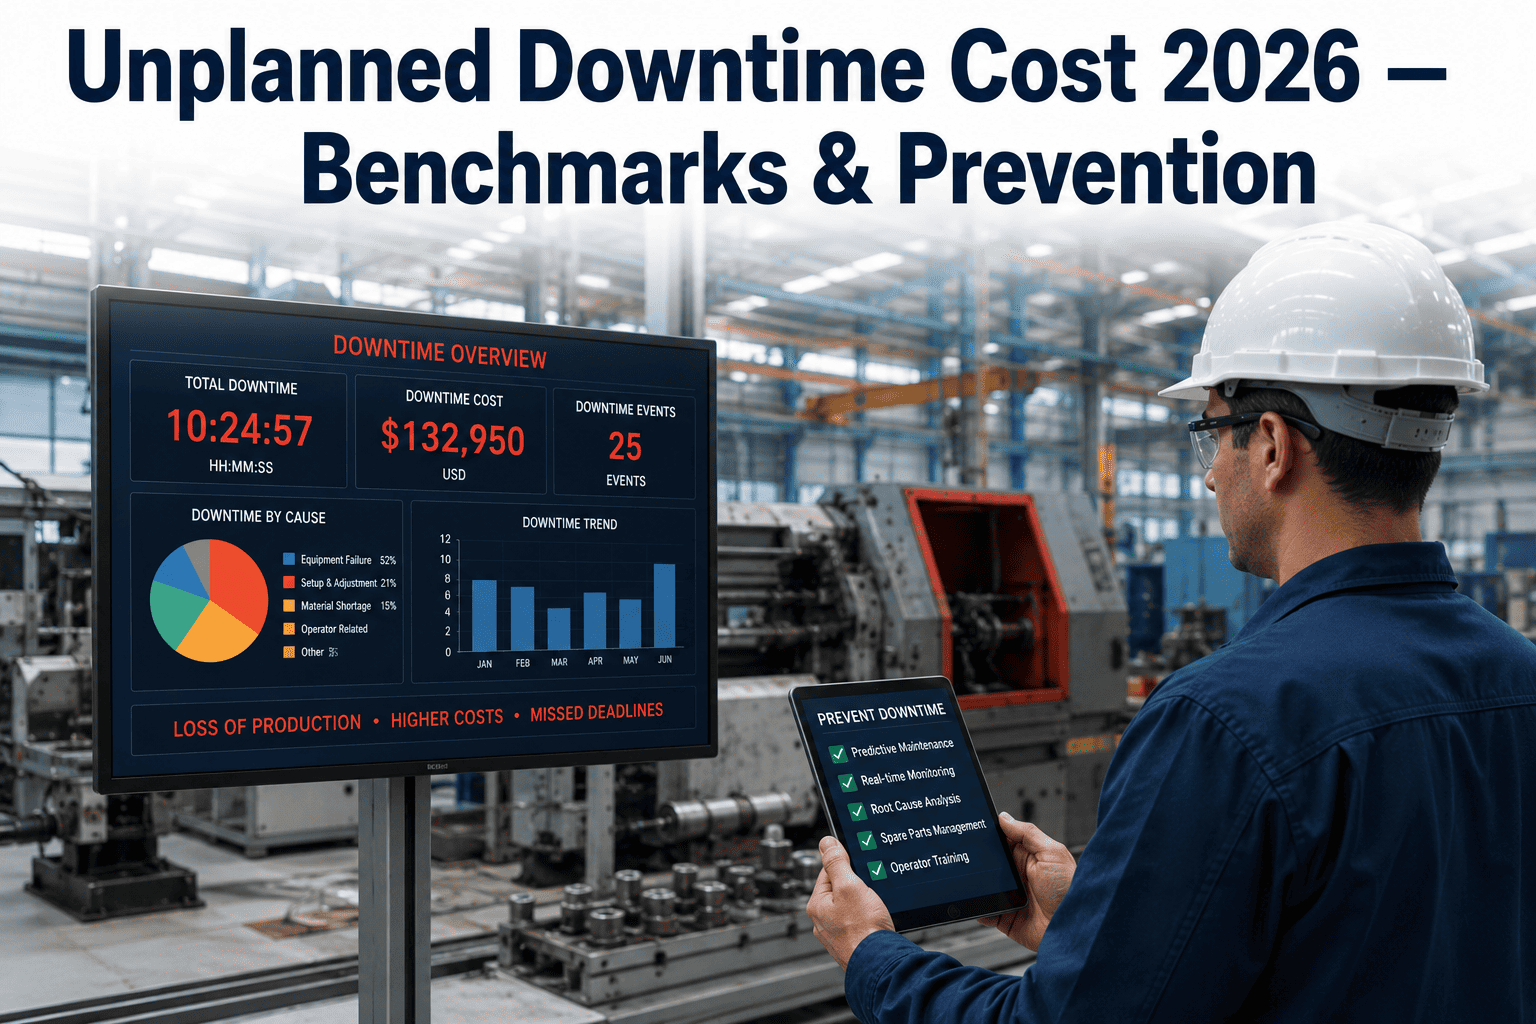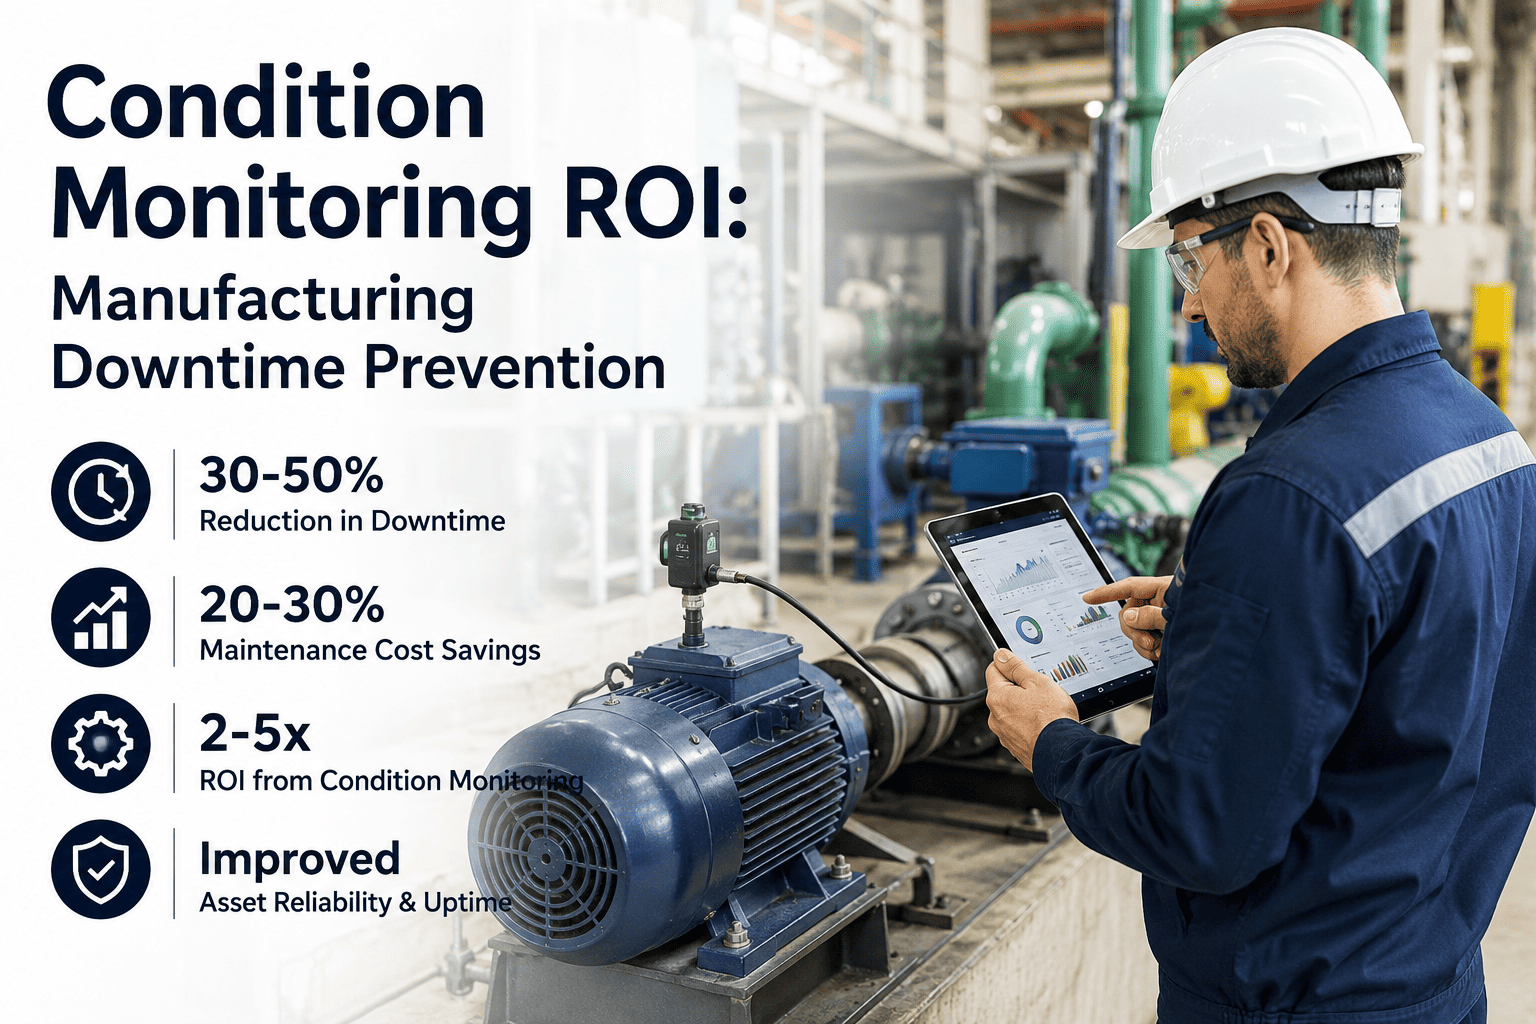
Every condition monitoring proposal eventually lands on a finance director's desk, and the first question is always the same one: what does this actually save us. It is a fair question, and it deserves a real answer built on the specific costs a plant already knows — unplanned downtime hours, emergency repair premiums, and the bearings or motors that fail years before they should. Reliability leaders building that business case can Book a Demo to walk through an ROI model built around their own equipment and downtime history.
The Four Cost Categories That Make Up Condition Monitoring ROI
A credible ROI case doesn't rest on a single number — it combines several distinct savings categories, each verifiable against a plant's own historical data. Avoided downtime is usually the largest and most visible category, but it is rarely the only one worth counting. Extended asset life, reduced emergency labor premiums, and lower secondary damage from catastrophic failures all contribute, and a proposal that only counts downtime avoidance tends to understate the real return by a significant margin.
Building the ROI Calculation Step by Step
The most persuasive ROI models are built from a plant's own numbers rather than generic industry averages, because a finance team evaluating the proposal will trust a calculation they can trace back to their own maintenance and production records far more than a vendor-supplied benchmark. The calculation itself follows a straightforward sequence, even though gathering accurate inputs for each step often takes more effort than the math.
Reactive vs. Monitored: A Side-by-Side Cost Comparison
The clearest way to communicate condition monitoring's value to a finance audience is a direct comparison between the reactive-maintenance cost profile a plant already lives with and the cost profile condition monitoring produces once faults are caught early. The difference is rarely subtle once it is laid out asset by asset, because reactive failures carry hidden costs — overtime, expedited freight, secondary damage — that rarely show up clearly in a standard maintenance budget line item.
| Cost Element | Reactive Failure | Monitored, Planned Repair |
|---|---|---|
| Repair labor | Overtime or emergency contractor rates | Standard shift labor, scheduled in advance |
| Parts sourcing | Expedited shipping, premium pricing | Standard lead time, pre-ordered |
| Downtime duration | Extended — diagnosis happens after failure | Shorter — scope known before repair begins |
| Secondary damage | Common with bearing seizures and cascading wear | Rare — repair happens before failure propagates |
| Production impact | Unplanned, disrupts schedule and shipments | Scheduled within a planned maintenance window |
Payback Period: What a Realistic Timeline Looks Like
Finance teams evaluating any capital or operating investment want a clear payback timeline, and condition monitoring programs generally follow a predictable curve — modest early savings as the program catches its first few faults, followed by accelerating value as historical data accumulates and detection accuracy improves. Setting realistic expectations about this curve upfront, rather than promising immediate dramatic savings, builds far more credibility with a skeptical finance stakeholder than an inflated first-year projection.
Prioritizing Which Assets to Monitor First
Not every asset needs the same level of monitoring investment, and ROI improves significantly when monitoring budget is directed toward the assets where failure consequences are highest rather than spread evenly across the entire plant. A criticality ranking — weighing production impact, repair cost, and failure frequency — gives reliability teams a defensible way to sequence rollout and present a phased investment plan rather than asking for full budget approval all at once.
Frequently Asked Questions: Condition Monitoring ROI
What downtime cost figure should we use if we don't have one calculated already?
A defensible starting estimate combines lost production value per hour, based on standard output rate and margin or revenue per unit, with the fully loaded cost of reactive labor during that downtime window, including overtime premiums where applicable. Most plants can pull this figure from finance or operations within a day or two even without a formal downtime-cost model already in place, and even a conservative estimate is usually sufficient to build a compelling case. Teams without an existing figure can Book a Demo to walk through calculating one together.
How do we estimate the detection rate condition monitoring would realistically achieve on our failure history?
Detection rate varies by failure mode — bearing and gearbox faults tend to show strong early warning signatures, while sudden failures caused by external factors like power surges are far less predictable through condition monitoring alone. A conservative approach reviews each historical failure individually and classifies it as likely detectable, possibly detectable, or unlikely detectable based on the failure mechanism, producing a realistic blended detection rate rather than a single optimistic industry-average figure applied uniformly.
Should the ROI model include savings from extended asset life, or just avoided downtime?
Extended asset life is a legitimate and often substantial savings category, since correcting misalignment or imbalance early can add years to a bearing or motor's service life compared to running it uncorrected until failure, but it should be presented separately from downtime avoidance since finance teams often want to see each category's assumptions independently rather than blended into a single number that is harder to audit.
How does condition monitoring ROI compare to a preventive maintenance program we already have?
Condition monitoring and preventive maintenance are complementary rather than competing investments — preventive maintenance catches issues on a fixed calendar regardless of actual asset condition, while condition monitoring catches issues based on actual degradation, often avoiding unnecessary preventive work on assets that are still healthy while catching problems on assets that are degrading faster than the calendar assumes. Plants that combine both typically see better overall reliability results than either approach alone.
What ongoing costs should be factored into the ROI beyond the initial sensor investment?
A complete ROI model accounts for software subscription or licensing costs, periodic sensor maintenance and calibration, and the labor time required for analysts or technicians to review flagged alerts and act on them, since these ongoing costs are what actually determine whether year-two and year-three returns hold up as strongly as the first-year projection. Contact iFactory Support for a full breakdown of ongoing program costs to include in a multi-year model.