Every unplanned stop has a price, but most plants only see part of it. The repair invoice is easy to find, while lost output, idle crews, scrap on restart and late orders are spread across other reports. Add them together and a four-hour stop often costs many times the repair bill. A simple calculator, used the same way every time, shows what downtime really costs and which lines deserve attention first. Teams that want the numbers built from real stop data can see how iFactory AI costs every stop automatically instead of working from spreadsheets.
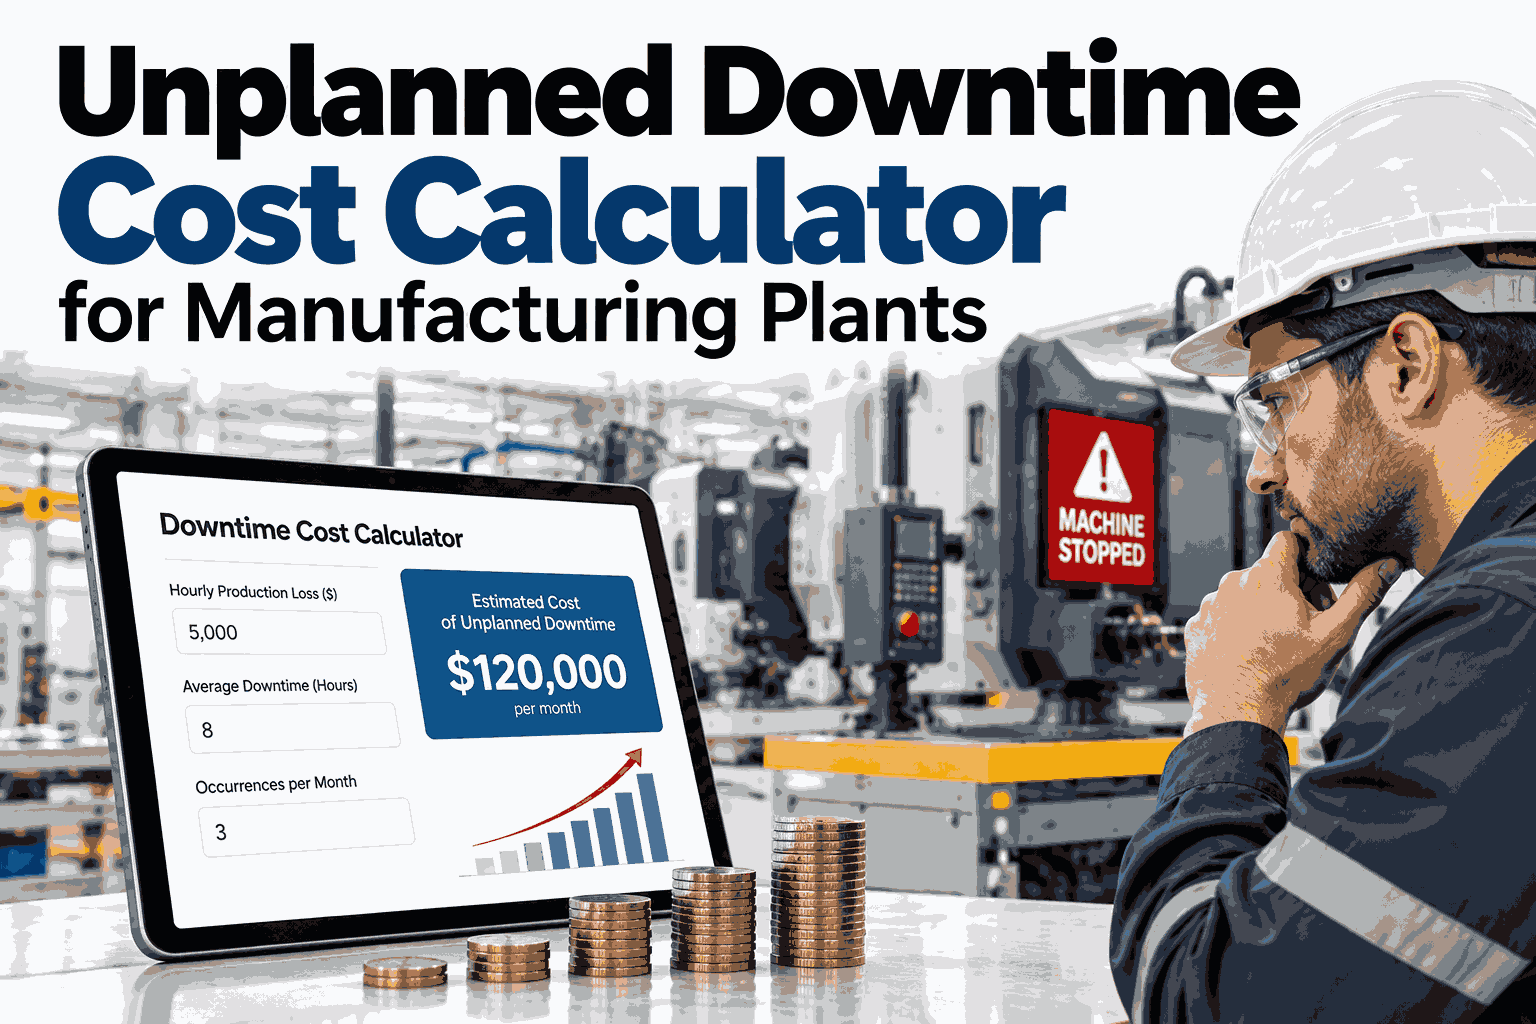
Unplanned Downtime Cost Calculator for Manufacturing Plants
A five-line formula, a worked example and a worksheet to price every stop on your floor.
The Downtime Iceberg
The repair bill sits above the waterline. Most of the cost sits below it, and it rarely appears under the word downtime.
A calculator earns its value by pulling the lower layers into the same number as the repair invoice.
The Five-Line Formula
Price each event on five lines. Add them, then multiply by how often the stop happens in a year.
Lost contribution margin
Stop hours x units per hour x margin per unit.
Idle labor
Stop hours x crew size x loaded hourly rate.
Repair cost
Technician time plus parts plus any outside service call.
Restart scrap and rework
Material and time lost while the line stabilises again.
Schedule and delivery impact
Expedite fees, overtime and penalties from missed dates.
Price Every Stop on Your Floor Automatically
Book a 30-minute session and iFactory AI will show how stop time, output and cost are joined for your own lines.
A Worked Example: One 4-Hour Stop
The inputs below are illustrative: 120 units per hour, $25 margin per unit, a crew of 12 at $30 per hour.
The repair was only 7 percent of the cost. At 30 similar stops a year, this one line loses about $508,000.
What Moves the Number Most
Three inputs decide whether a stop is cheap or painful. Know where your lines sit on each.
A bottleneck line loses far more per hour than a line with spare capacity downstream.
Time to detect, diagnose, fetch parts and restart is often longer than the repair itself.
Many short stops can cost more per year than one long breakdown.
Where the Hours Go in a Single Stop
Shortening a stop means shortening one of these four phases. The split below is an illustrative example.
Detect and diagnose took 90 of 240 minutes. That is time better data can remove without touching the repair itself.
Downtime Cost Worksheet
Copy this table, fill it in for your top three lines and rank them by annual cost.
| Input | Where to Find It | Common Mistake |
|---|---|---|
| Units per hour | Ideal or rated line speed | Using average output, which already includes losses |
| Margin per unit | Finance, contribution not profit | Using full revenue or fully loaded cost |
| Crew and rate | HR or payroll, loaded hourly rate | Ignoring benefits and overtime premiums |
| Stops per year | Machine stop log by cause | Counting only stops over 30 minutes |
| Average stop length | Timestamped stop records | Trusting end-of-shift handwritten notes |
Five Ways to Cut the Bill
Once stops are priced, the order of work becomes obvious. These levers pay back in different ways.
Detect earlier
Alerts on vibration, temperature or cycle drift shorten the first phase of every stop.
Diagnose faster
Cause history on each asset helps technicians arrive with the right part.
Stock critical spares
Keep parts for the assets whose stops cost the most per hour.
Plan from condition
Move work from fixed calendars to real wear signals on critical machines.
Standardise restarts
A written restart recipe cuts the scrap and time lost after every stop.
Where iFactory AI Fits
iFactory AI joins stop data, production counts and cost inputs, so the calculator runs itself on every event.
Automatic stop capture
Stops are timestamped from machine signals and tagged by cause without manual logs.
Cost per event
Margin, labor, repair and scrap are applied to each stop using your own rates.
Ranked cost leaders
Assets and causes are ordered by annual cost, so the biggest prize comes first.
Ask in plain language
Managers can ask what downtime cost Line 2 this month and see the drivers.
Frequently Asked Questions
What is the simplest way to calculate downtime cost?
Multiply stop hours by the contribution margin lost per hour, then add idle labor, repair, scrap and delivery impact. Using the same five lines every time keeps results comparable between lines. Start with your top three lines only. You can see the five-line calculation on live plant data.
Should I use revenue or margin for lost output?
Use contribution margin, which is price minus variable cost. Revenue overstates the loss, and full profit understates it because fixed costs continue during a stop. If the line is not a bottleneck, lost output may be recovered later. To check, request a bottleneck and margin walkthrough with the iFactory AI team, or ask support about cost setup.
How do I count many short stops?
Log every stop above a low threshold, such as two minutes, and total them by cause. Short stops are easy to ignore, yet they often add up to more hours than a few large breakdowns. Automatic capture avoids missing them. A short product tour of minor stop tracking shows how this works.
Can the calculator justify a reliability project?
Yes. Take the annual cost of the top causes, estimate a realistic reduction, and compare the saving with the project cost. Use conservative reductions so the case holds up in review. See how savings cases are built from your own stop history in a guided session.
How often should we update the numbers?
Refresh rates and margins each quarter, and review stop data weekly. Costs shift with product mix and wage changes, so old figures can mislead. Automated tracking keeps them current without extra effort. Schedule a walkthrough of live cost tracking to see the refresh cycle.
Know What Every Stop Costs, Then Cut It
iFactory AI captures each stop, prices it with your own numbers and ranks the biggest losses. Book a walkthrough to see it on your plant.