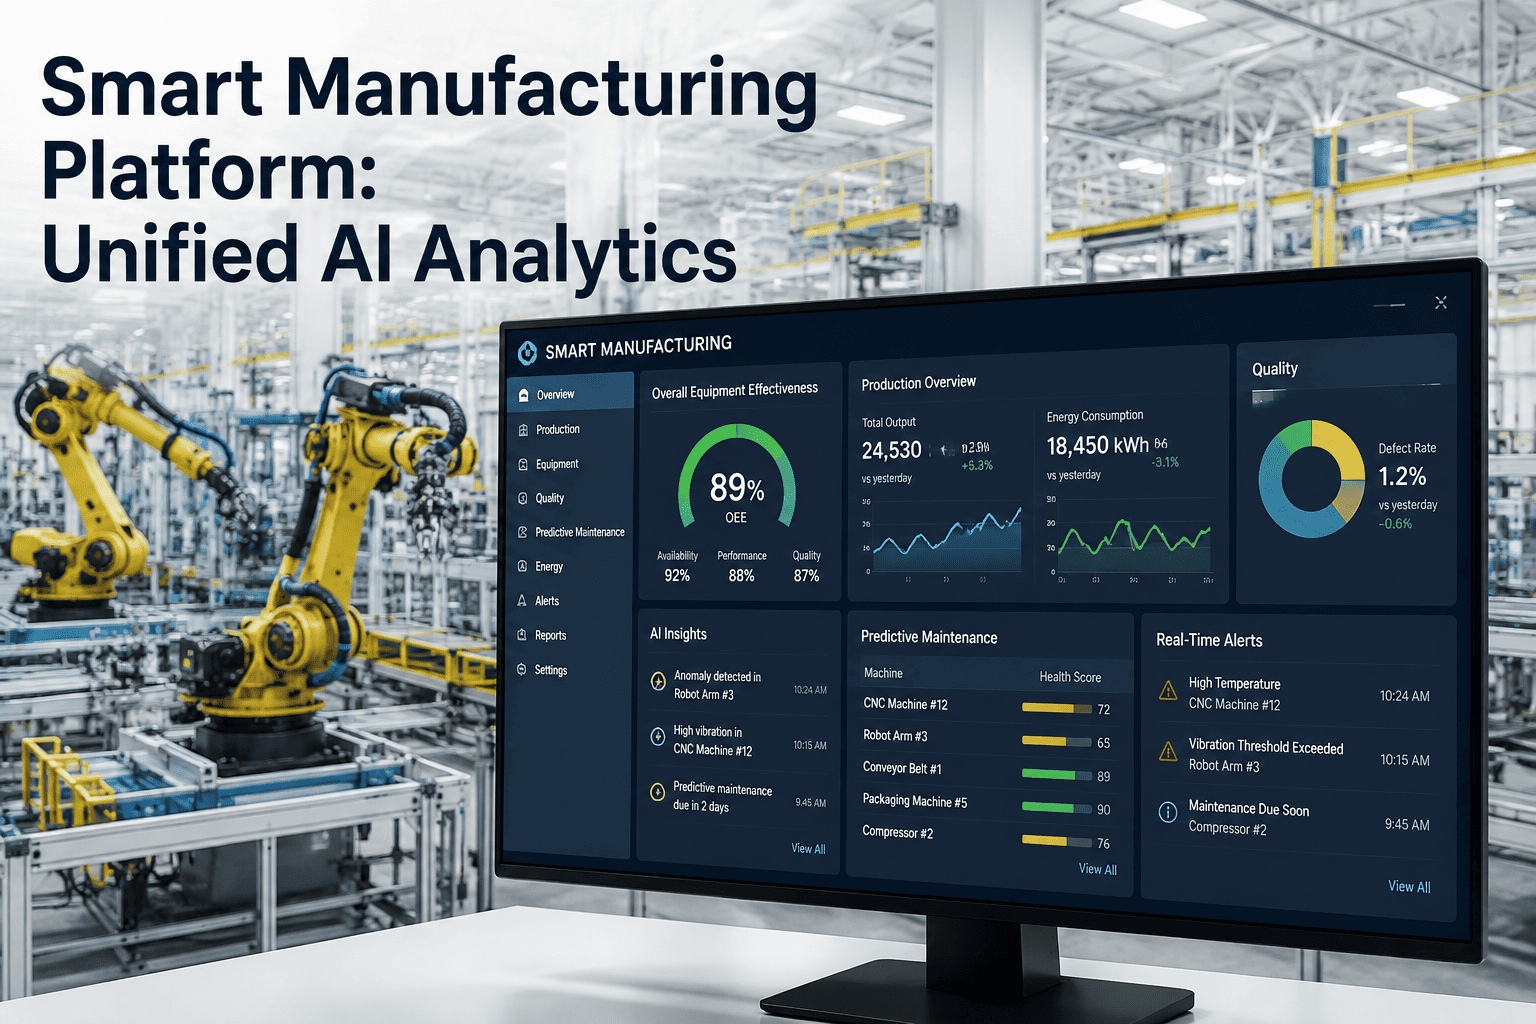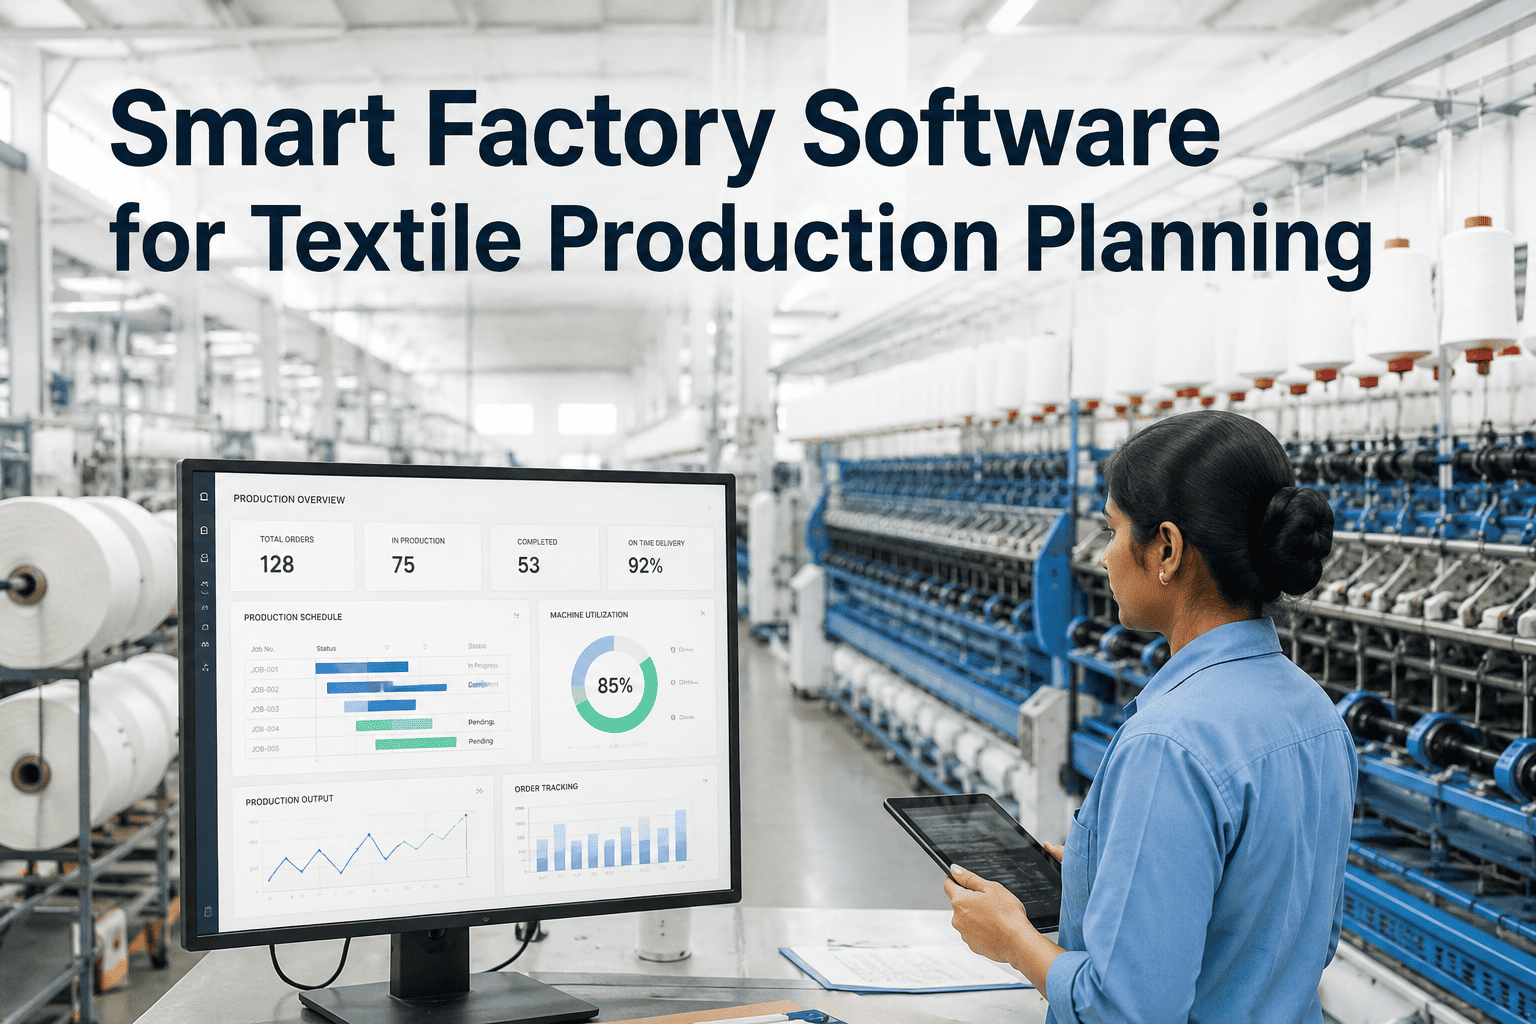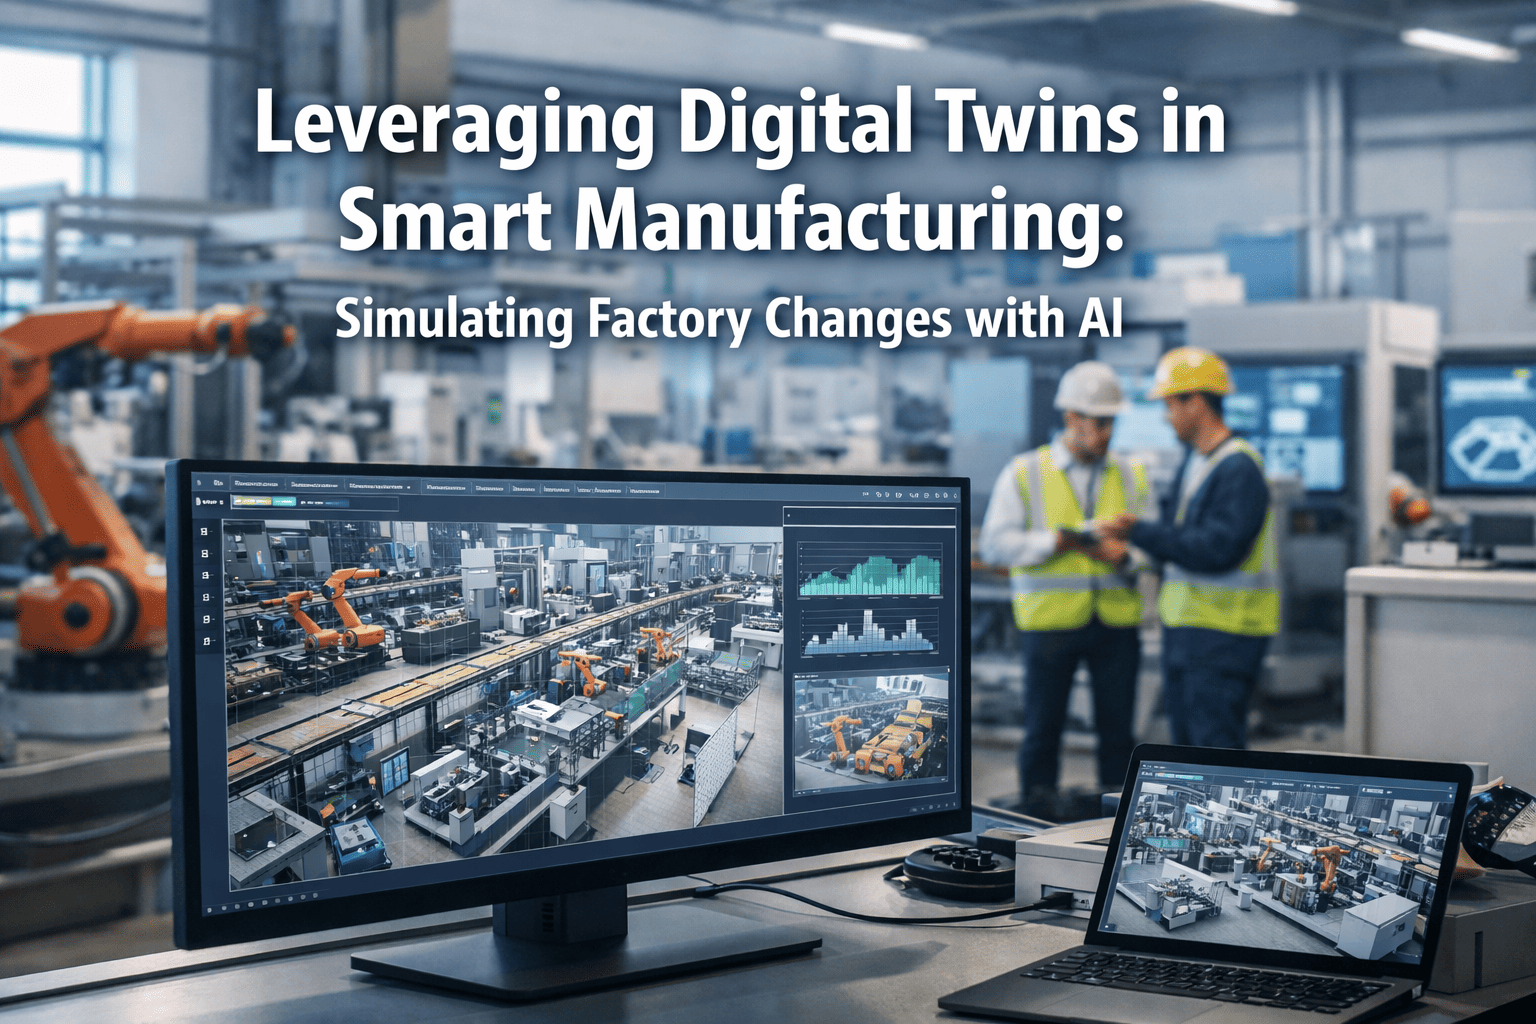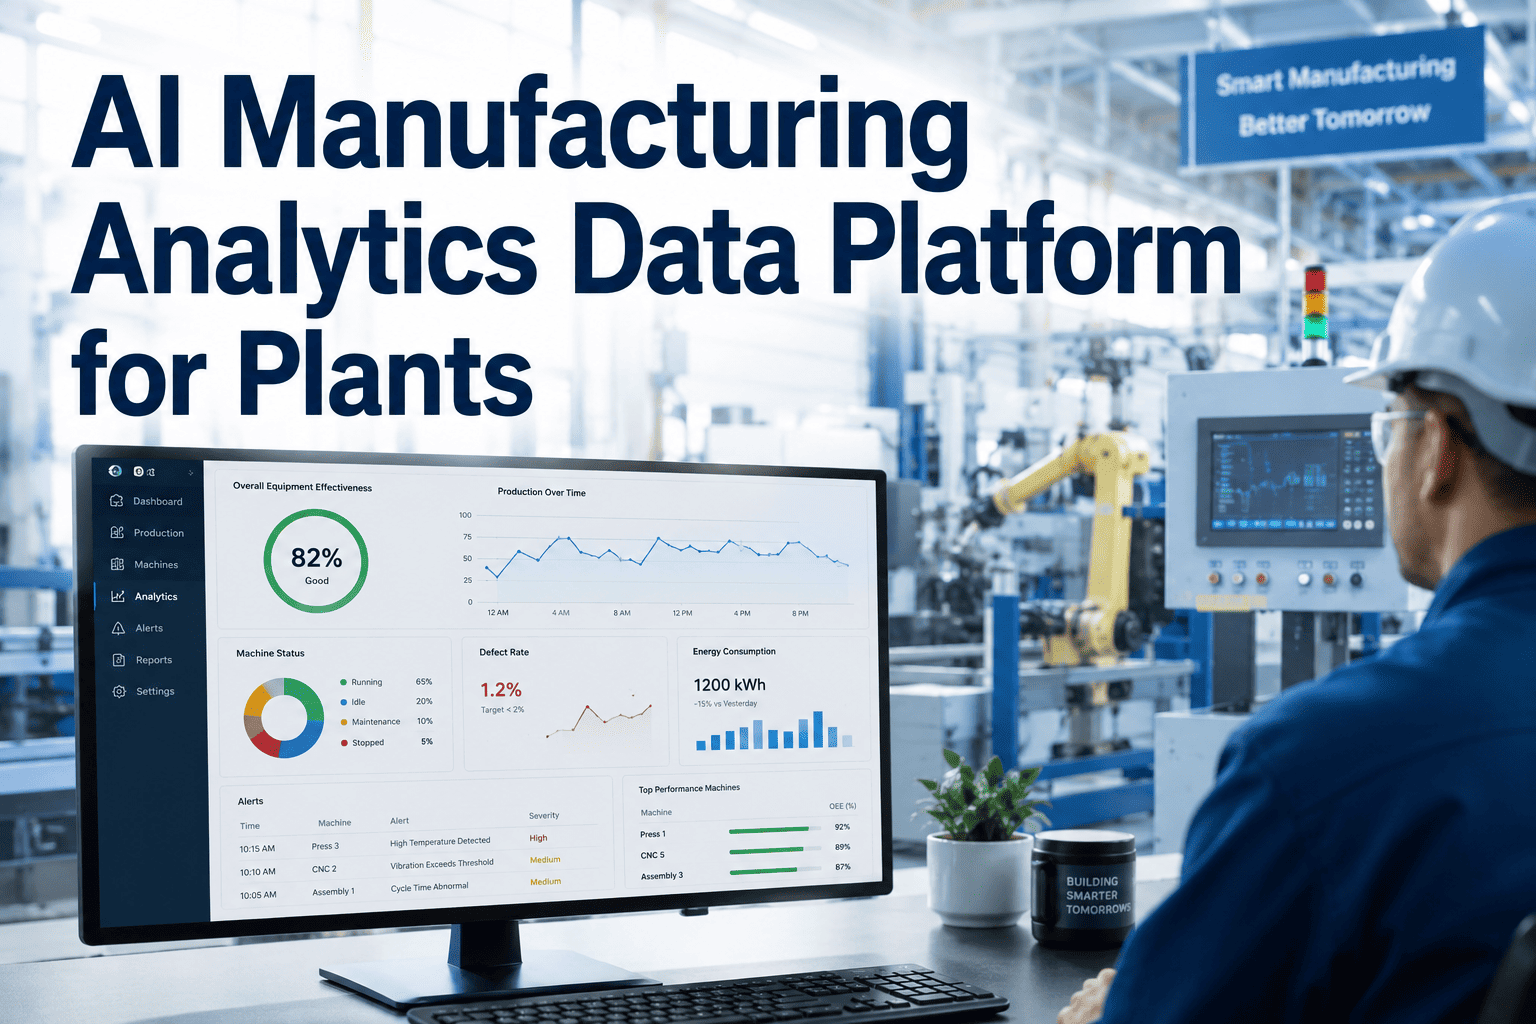
Ask a plant manager how Line 3 performed last Tuesday and watch what happens next. Someone opens the MES export, someone else pulls a CMMS report, a third spreadsheet gets built to reconcile the two, and an hour later there is an answer to a question that should have taken ten seconds. AI manufacturing analytics exists to close that gap, turning scattered plant data into plain-language answers and automated reports, and you can book a demo to see your own data answer that kind of question instantly.
Stop Pulling Reports From Five Systems to Answer One Question
iFactory unifies PLC, SCADA, MES, and CMMS data into one analytics platform, then lets anyone on your team ask plain-language questions and get answers, automated shift summaries, and root-cause explanations without waiting on a data analyst.
Your Data Isn't Missing, It's Just Scattered
Most plants are not short on data, they are short on a single place to ask a question of it. PLC data lives on the floor. SCADA history lives in a historian. MES tracks work orders and schedule attainment. CMMS holds maintenance records and downtime codes. Quality data often lives in yet another system entirely. A question as simple as "why did Line 3's OEE drop last Tuesday" requires pulling from at least three of these systems and manually reconciling timestamps, machine IDs, and shift boundaries that were never designed to line up cleanly.
This is why so many plants still run on a reporting cycle built around end-of-shift and end-of-week summaries rather than real-time answers, not because faster answers wouldn't help, but because the manual effort of assembling them from five disconnected systems makes real-time reporting impractical without a unifying data layer underneath.
The cost of this fragmentation compounds the further up the organization a question travels. A supervisor asking why one machine stopped for twenty minutes can usually get an answer within the shift by walking the floor. A plant manager asking why OEE across three lines trended down over a month needs data pulled and reconciled across weeks of records from every one of those disconnected systems, a task that easily consumes a data analyst's entire day. An executive asking how one plant's performance compares to another across the network is often working from reports built on inconsistent KPI definitions to begin with, since nobody standardized what "downtime" or "first-pass yield" means across sites that grew up on different systems.
See Your Own PLC, SCADA, MES, and CMMS Data Unified
iFactory connects to your existing systems and shows what a single source of truth looks like for your plant.
Three Capabilities Traditional BI Tools Don't Have
Instead of navigating filters and drill-downs, anyone can type or ask "which machine had the most changeover time this month" and get a direct, visual answer, no dashboard training required. This removes the analyst bottleneck that traditionally sits between a question occurring to someone on the floor and that question actually getting answered.
Rather than waiting for a person to notice a metric has drifted, the platform flags unusual patterns in performance and quality as they emerge, before they compound into a bigger problem. This shifts monitoring from something a person has to remember to check into something the system surfaces proactively.
When a KPI drops, the system correlates the deviation across every related data stream, machine parameters, material batch, operator, shift, ambient conditions, and surfaces the most probable cause automatically, cutting a diagnostic process that could take hours down to a few minutes of confirmation.
One Data Layer, Four Very Different Audiences
| Audience | What They Need | Refresh Cadence |
|---|---|---|
| Operators | Real-time shift-level line status | Continuous |
| Supervisors | Daily downtime, quality, and schedule summary | Daily |
| Plant Managers | Weekly trend boards across every line | Weekly |
| Executives | Plant-to-plant benchmark scorecards | Monthly / quarterly |
A dashboard trying to serve all four audiences at once tends to overload every one of them, which is why a single underlying data layer feeding tier-specific views, rather than one generic dashboard, is the pattern that scales across a growing plant network.
The KPI Set Almost Every Plant Should Be Tracking
A dashboard carrying far more than eight to ten KPIs for any single audience tends to bury the metrics that actually drive decisions, which is why the platform's tier-specific views deliberately limit what each role sees to what that role actually acts on.
Analytics That Recommend the Next Action, Not Just the Last Number
Manufacturing analytics is shifting from dashboards that a person has to interpret toward workflows that monitor signals, summarize changes, and recommend next actions directly. Instead of a static OEE chart that a supervisor studies and then decides what to do about, the platform can generate a human-readable shift summary automatically, flag which downtime cause is trending worst, and route a maintenance work order to the right technician without a manual handoff between systems that were never designed to talk to each other.
This same reasoning extends to cross-shift and cross-plant comparison. The platform can identify which shift, line, or plant is genuinely outperforming its peers on a given metric and surface the specific practice behind that performance, turning what used to be tribal knowledge held by one strong supervisor into a documented, replicable pattern available to every other shift and site.
Over time, this workflow layer becomes the connective tissue between analytics and action. An anomaly detected on the analytics side can trigger a maintenance workflow automatically, a quality deviation can route directly into a corrective action task, and a scheduling risk flagged by the data can generate a planning alert before the risk materializes on the floor. The distinction that matters here is between a system that reports what happened and a system that participates in deciding what happens next, and manufacturing analytics is steadily moving toward the latter.
From Scattered Systems to One Source of Truth
Connect Existing Systems
PLCs, SCADA, MES, and CMMS are connected without requiring replacement of any system already in use.
Reconcile the Data Model
Machine IDs, shift boundaries, and timestamps across every source system are unified into one consistent model.
Deploy Tiered Dashboards
Operator, supervisor, plant manager, and executive views go live from the same underlying data layer.
Enable Natural Language and Anomaly Alerts
Plain-language queries and automated anomaly detection are turned on once the data foundation is validated.
Why the Right Architecture Splits Decisions Across Both
A recurring debate in manufacturing analytics is whether processing should happen at the edge, on or near the machine itself, or in the cloud, where data from every site can be pooled together. The honest answer is that both are right, for different kinds of decisions. A machine-level anomaly that needs a response within seconds, a spindle temperature spike, a pressure excursion, has to be detected and acted on at the edge, because round-tripping that data to the cloud and back introduces latency that defeats the purpose of real-time detection. Cross-plant benchmarking, by contrast, only makes sense in the cloud, since comparing this month's OEE across five plants requires pooling data that simply does not exist in any single plant's local systems.
iFactory's architecture reflects this split deliberately: time-sensitive anomaly detection and alerting run close to the data source, while trend analysis, benchmarking, and executive reporting run centrally where the full breadth of plant data can be compared. This hybrid approach avoids the common failure mode of either sending every signal to the cloud and accepting real-time latency, or keeping everything local and losing the ability to compare performance across sites.
A Single Source of Truth Requires Agreement on What the Truth Is
Unifying five systems into one analytics layer surfaces a problem that often existed quietly for years, different departments defining the same KPI differently. One line's "downtime" might exclude planned changeovers while another line's includes them, and a plant's reported OEE can shift meaningfully just from reconciling those definitions to a single standard. This reconciliation work is not glamorous, but it is often where the most durable value of an analytics deployment comes from, because it forces a level of KPI definition discipline that individual departmental spreadsheets never required.
Ongoing governance matters just as much as the initial reconciliation. As new lines, new products, and new reporting requirements get added, someone needs clear ownership of KPI definitions, data access, and model monitoring, or the same fragmentation that made five separate systems necessary in the first place will quietly re-emerge inside the unified platform. Successful deployments treat this governance layer, access control, lineage, data quality, and KPI ownership, as a first-class part of the rollout rather than an afterthought handled once problems appear.
Questions Plant Teams Ask About AI Manufacturing Analytics
Turn Five Systems Into One Answer
iFactory unifies your plant data and lets your whole team ask questions in plain language, no analyst required.