Most plants run five or six separate systems to manage what is really one connected problem: making good product, on time, without wasting capacity. A production monitoring tool tracks output. A quality system tracks defects. A maintenance system tracks work orders. None of them talk to each other, so when a quality issue traces back to a specific machine state, or a maintenance window collides with a production deadline, someone has to manually stitch the story together across four different logins, usually after the problem has already cost real time on the floor. A unified smart manufacturing platform puts production, quality, maintenance, and capacity data in one connected view instead, and a 30-minute walkthrough can show what that looks like against your current systems.
Smart Manufacturing Platform: One Connected View Instead of Five Disconnected Tools
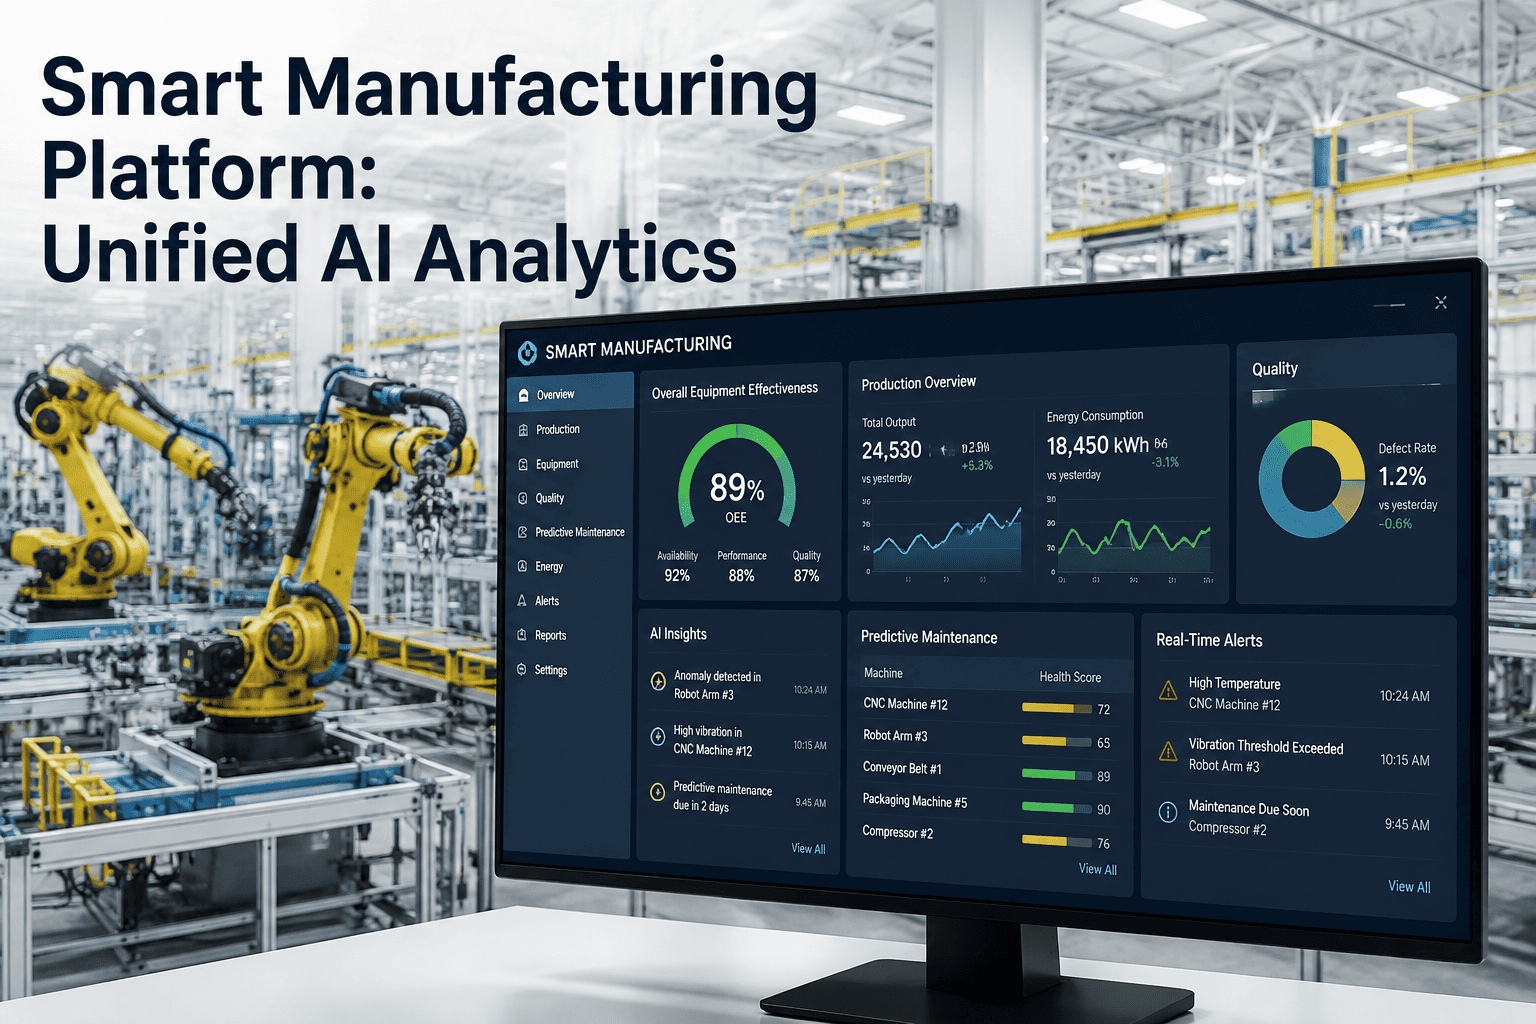
iFactory brings production monitoring, quality management, predictive maintenance, and capacity planning into a single AI-driven platform — so a problem on the floor shows its full context instead of requiring four separate logins to piece together. The platform is designed to sit on top of the systems already running your plant, connecting their data rather than asking you to replace them.
The Problem With Running Manufacturing on Point Solutions
Point solutions solve their own narrow problem well. The trouble is what happens between them — or rather, what does not happen, because none of these systems were built to share context. Three patterns show up in almost every plant running a fragmented toolset.
Context Gets Lost Between Systems
A quality defect logged in one system has no automatic link to the machine parameters, maintenance history, or shift data that might explain it. Someone has to manually cross-reference timestamps across tools to find the connection, if they bother to look at all, and by the time they do, the shift that caused it has already ended.
Every Tool Has Its Own Source of Truth
Production counts in the MES do not always match what quality reports as good units, and maintenance downtime logs rarely match what production considers a stoppage. Reconciling these numbers becomes its own recurring task that consumes hours every reporting cycle without adding any new insight.
Insights Arrive Too Late to Act On
Without a connected view, most analysis happens after the fact in a weekly report, by which point the shift that caused the issue is long over and the same root cause is free to repeat on the next shift, and the one after that, until someone finally traces the pattern manually.
Why This Gets Worse as Plants Add More Tools
The instinct when a gap appears in visibility is usually to buy another point solution to close it. That solves the immediate problem but adds another disconnected data source to the pile, another login for operators and planners to check, and another system that needs its own reconciliation process. Plants running five or more disconnected tools often spend more staff time keeping the systems in sync with each other than they spend acting on the insights those systems were supposed to provide in the first place.
One Platform, Four Connected Modules
iFactory is not four separate products bundled under one login — it is a single data model where production, quality, maintenance, and capacity information all reference the same machines, shifts, and work orders, so a question in one module can pull context from all four automatically.
Production Monitoring
Live output, cycle time, and OEE tracked at the machine level, with automatic downtime capture pulled directly from PLC and sensor signals rather than manual logging, so the numbers reflect what actually happened on the floor rather than what an operator had time to write down.
Quality Management
Defect tracking, statistical process control, and root cause analysis linked directly to the production conditions present when the defect occurred, so patterns surface automatically instead of requiring manual correlation across separate systems.
Predictive Maintenance
Condition monitoring and failure prediction that factors in actual production load and duty cycle, not just calendar time, so maintenance gets scheduled around real equipment stress rather than a fixed interval that may no longer match how the asset is actually being run.
Capacity Planning
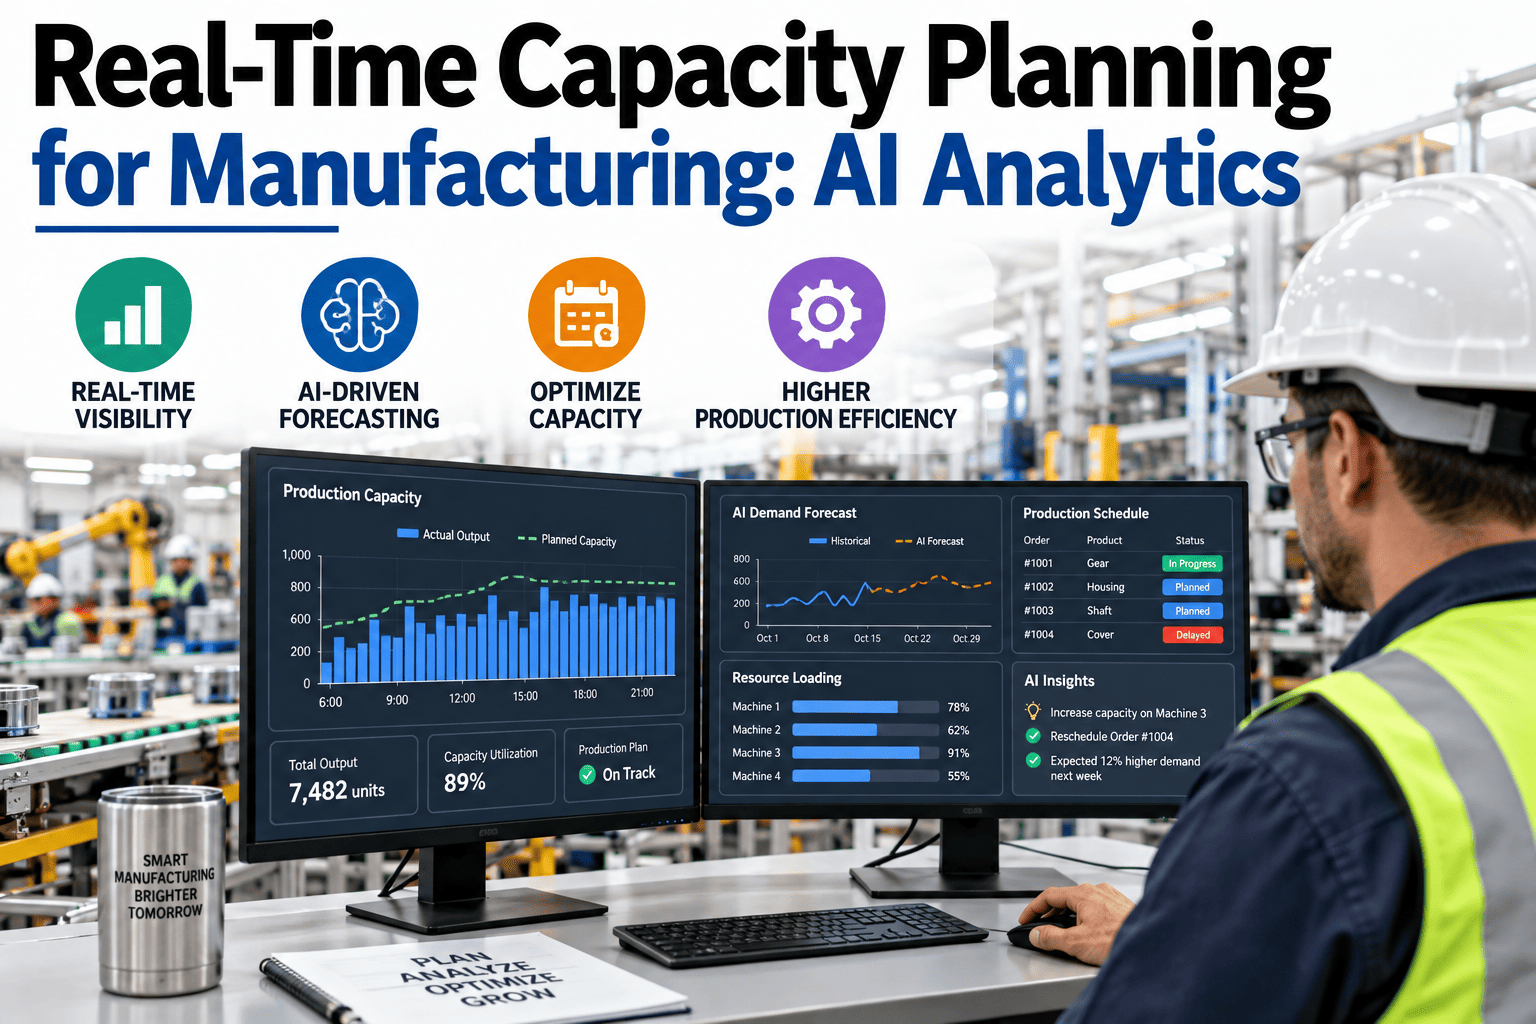
Production scheduling that accounts for maintenance windows, quality-driven rework time, and real equipment performance data instead of assuming nameplate capacity is always available, so the plan reflects what the floor can actually deliver.
Curious how the four modules would connect against your current systems? Book a platform demo and iFactory will map the data model against your existing MES, CMMS, and quality tools.
Point Solutions vs a Unified Platform
The comparison below is not about which individual tool is better — most point solutions are perfectly capable on their own. It is about what changes when the data those tools generate actually connects.
| Capability | Separate Point Solutions | iFactory Unified Platform |
|---|---|---|
| Root cause investigation | Manual cross-referencing across tools | Automatic linkage across modules |
| Source of truth for output | Varies by system, requires reconciliation | Single shared production record |
| Maintenance scheduling input | Calendar-based, isolated from production plan | Factors in real capacity and quality data |
| Time to insight | Often a weekly report cycle | Near real time on the floor |
| Number of logins for a full picture | Three to five separate systems | One connected view |
Stop Reconciling Four Systems to Answer One Question
iFactory connects production, quality, maintenance, and capacity data into a single AI-driven platform — built to work alongside your existing MES, CMMS, and ERP rather than replace them outright.
How the Modules Work Together — A Real Scenario
The value of a connected platform is easiest to see through a single example. Here is what happens when a quality issue appears on a unified system versus a fragmented one.
A Defect Rate Spikes on the Floor
Quality module flags an unusual increase in a specific defect type on one line, well before it would show up in a weekly quality report that nobody would read until the following Monday.
Production Context Loads Automatically
The platform pulls the machine parameters, cycle times, and operator shift active at the moment each defective unit was produced, without anyone requesting it manually or digging through separate logs to reconstruct the timeline.
Maintenance History Cross-Checks the Pattern
If the defect correlates with a specific piece of equipment, the platform surfaces recent maintenance activity or condition alerts on that asset as a probable contributing factor, saving the investigation team a step they would otherwise have to do by hand.
Capacity Plan Adjusts Automatically
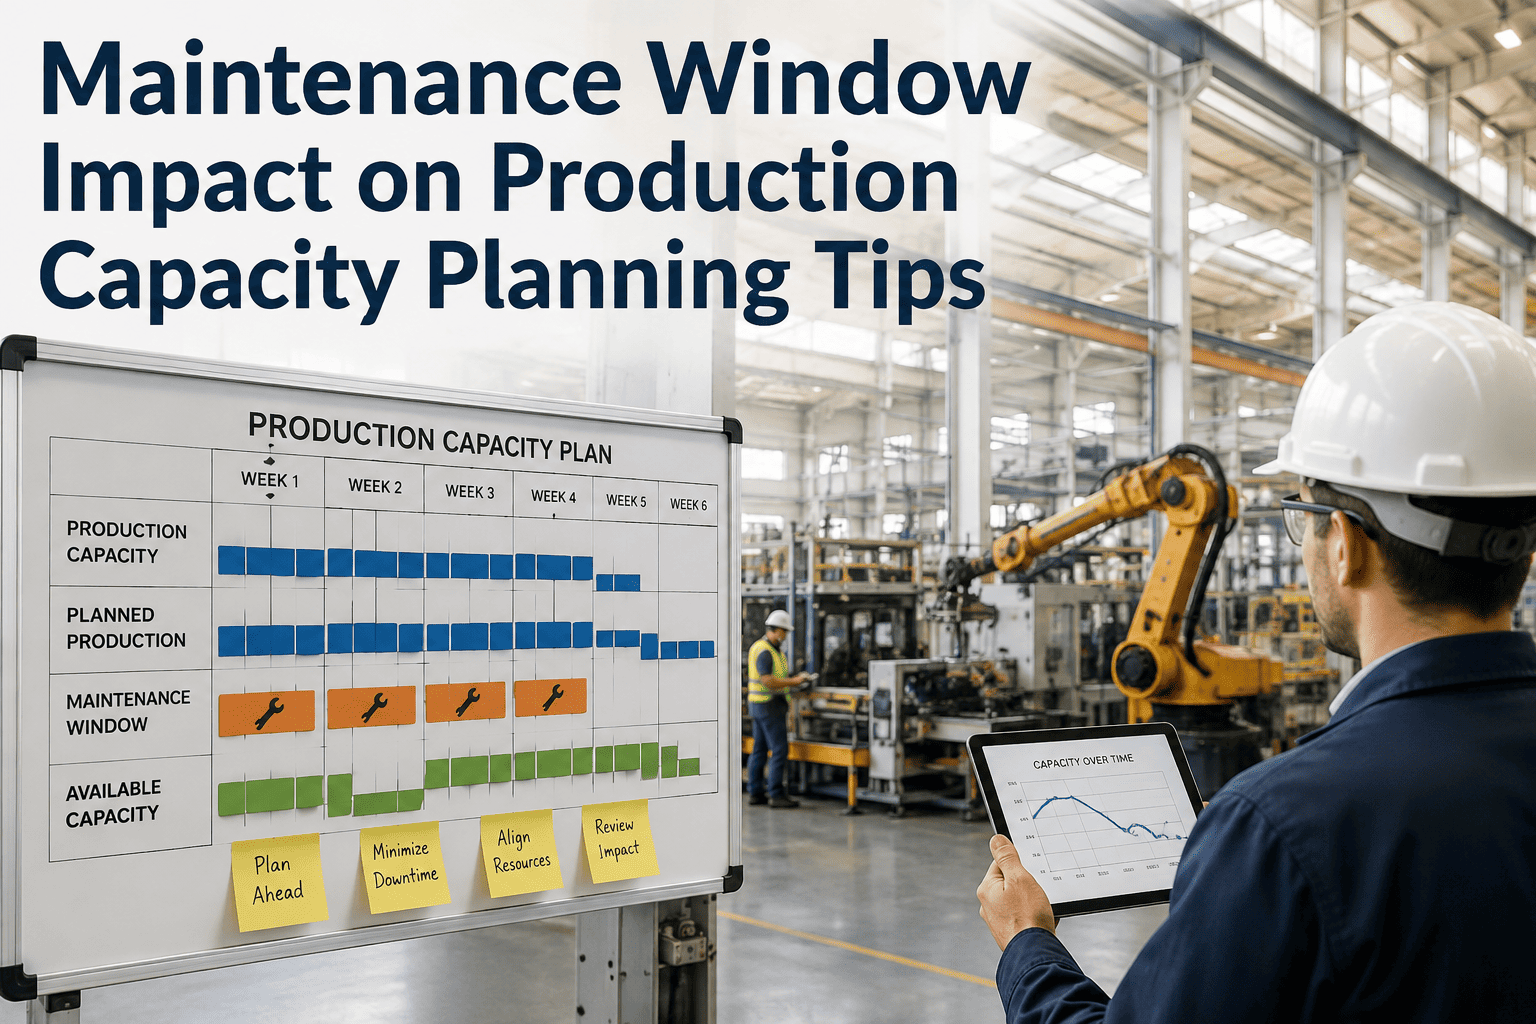
If the fix requires downtime, the capacity module shows the least disruptive window to schedule it, factoring in the current production plan rather than treating it as an isolated maintenance decision made without visibility into what else is happening on the floor.
Built to Work With What You Already Have
A unified platform does not mean ripping out every system already running on the floor. iFactory is designed to sit alongside existing infrastructure and pull data from it, rather than requiring a wholesale replacement before any value shows up. This matters because most plants have made real investments in their current MES, CMMS, and quality tools, and those investments do not need to be abandoned to gain a connected view.
PLC & SCADA
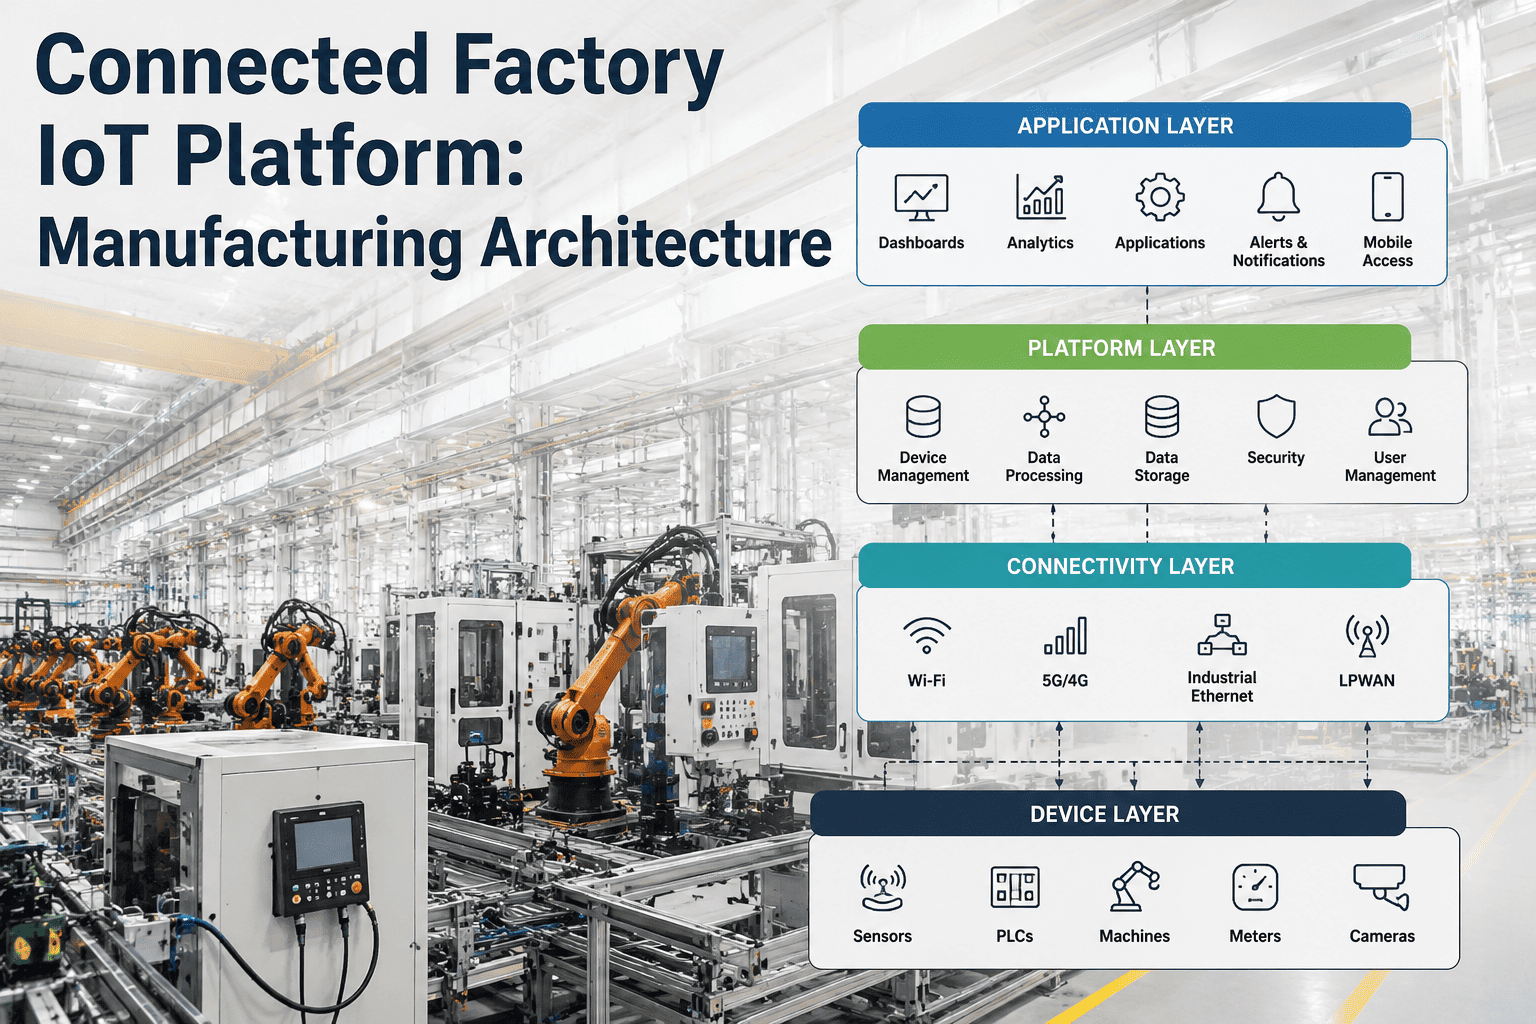
Direct integration with existing control systems pulls machine-level data without requiring new sensors on most equipment already in place.
ERP Systems
Standard API connections to SAP, Oracle, and other major ERP platforms keep work orders and inventory data synchronized without duplicate entry.
CMMS Platforms
Maintenance history and work order data flow in from existing CMMS tools rather than requiring maintenance teams to adopt an entirely new system.
Quality Systems
Existing SPC and quality documentation tools connect in, so historical quality data carries forward into the unified view instead of starting from zero.
Who the Platform Is Built For
iFactory's data model is flexible enough to fit different production environments, but the specific value tends to show up differently depending on the industry running it.
What Changes on the Floor After Unification
Root Cause Investigations Shrink From Days to Hours
With context already linked across modules, investigations that once required pulling data from four systems can start from a single connected view instead of a multi-day scavenger hunt across separate logins.
One Number Everyone Agrees On
Production, quality, and maintenance teams stop debating whose system has the "real" number, because there is only one shared production record everyone references in meetings.
Capacity Plans Reflect Reality
Schedules built with real maintenance and quality data baked in are far less likely to be blindsided by a conflict nobody saw coming until it was already too late to plan around.
None of these changes require a plant-wide rollout to start showing up. Even a single connected line tends to reveal the first cross-functional insight within the first month of going live, which is usually what builds the internal case for expanding to the rest of the facility.
Frequently Asked Questions
Do we need to replace our existing MES, CMMS, or quality systems?
No. iFactory is built to integrate with the systems already running on your floor rather than replace them outright. Most deployments connect to existing infrastructure through standard APIs, keeping the tools your teams already know while adding the connected layer on top, which significantly reduces both the cost and disruption of adoption compared to a full system replacement. Our team can review your current systems to confirm the integration path before any commitment.
How long does a typical deployment take?
Most single-line pilots go live within 60 to 90 days from kickoff, covering system integration, data validation, and initial dashboard configuration. Full multi-line rollouts typically extend over two to three additional quarters, with each line adding incremental value as it connects rather than waiting for a single big-bang launch across the entire facility at once.
Which modules do we need to start with — all four, or can we begin smaller?
Most plants start with one or two modules that address their most pressing pain point, commonly production monitoring paired with either quality or maintenance, and expand from there once the connected data model proves its value on the floor. The architecture is designed for incremental adoption rather than requiring a full four-module commitment on day one, which keeps early risk and cost manageable.
How does the AI analytics layer actually work?
The platform applies pattern recognition and statistical models across the connected data set to surface correlations a human analyst would otherwise have to find manually — for example, linking a defect spike to a specific shift, machine setting, or upstream maintenance event. It is built to explain its reasoning in plain terms rather than function as an unexplainable black box, so the team can verify a suggested root cause before acting on it rather than being asked to simply trust the output.
Is this suitable for a single plant, or does it require a multi-site rollout?
The platform works for a single facility just as well as a multi-site deployment. Many customers start with one plant to prove the model before extending it across a broader network, and the underlying architecture supports both scales without requiring a different approach or a separate implementation for each additional site. To scope what makes sense for your operation, book a 30-minute platform demo.
See Your Floor Through One Connected View
iFactory's smart manufacturing platform connects production, quality, maintenance, and capacity data into a single AI-driven system — built alongside your existing tools, not instead of them. Start with the module that matters most and expand from there.