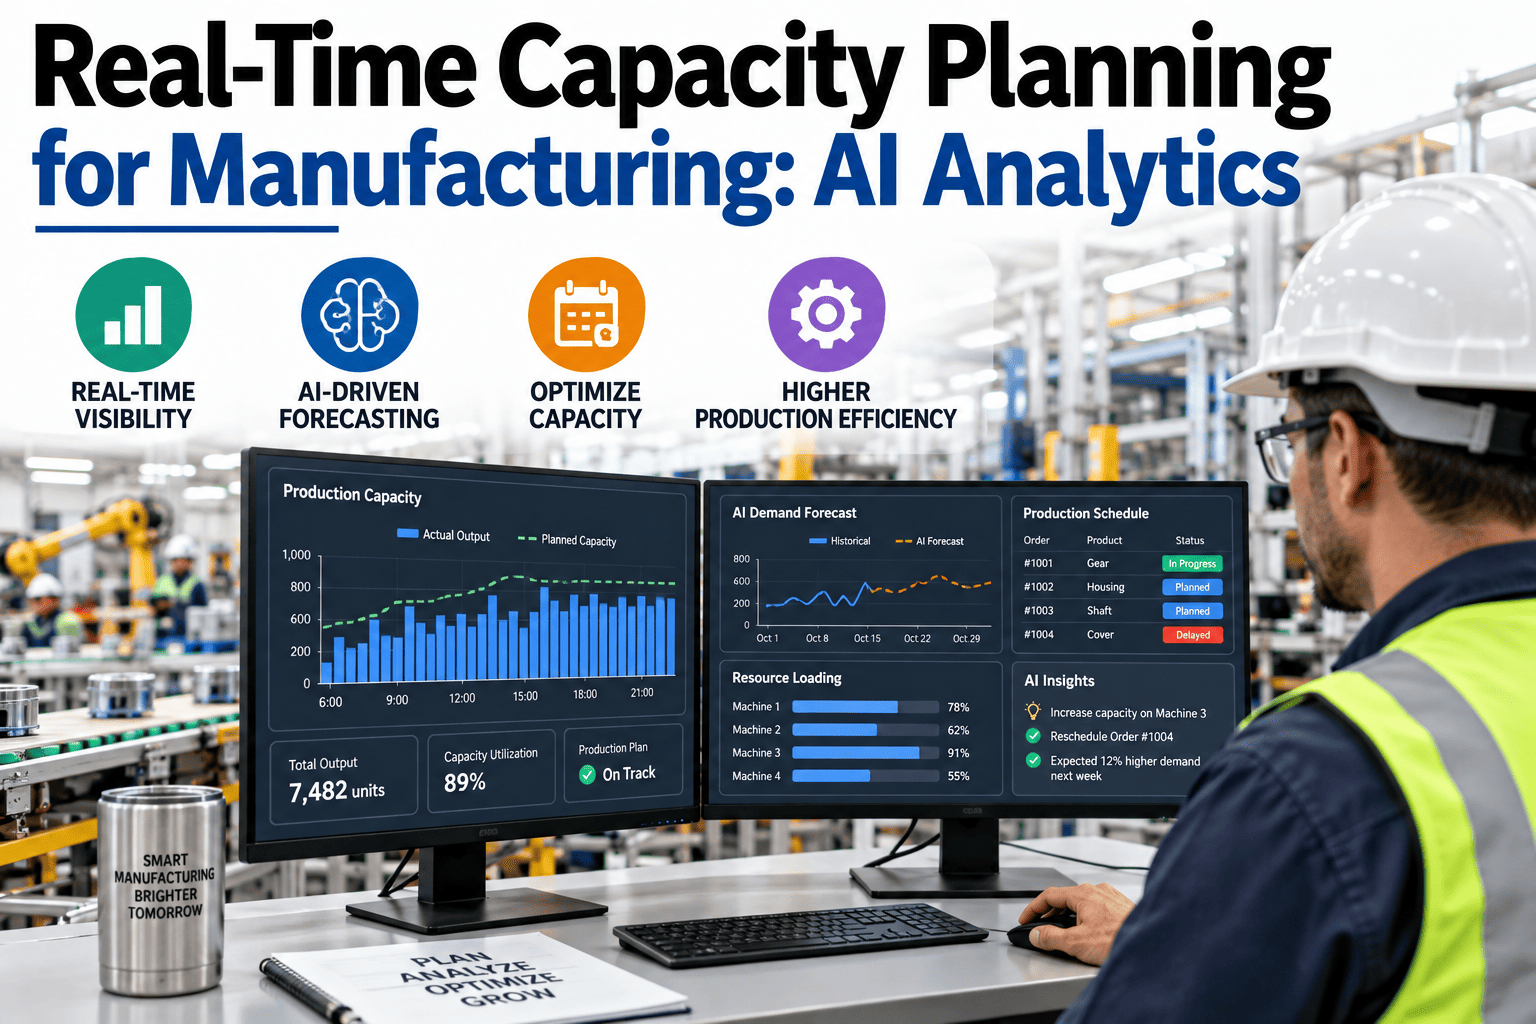
Most capacity plans are built on a number nobody has ever actually hit — the theoretical maximum a line could produce if nothing ever went wrong. Real production runs on a different number entirely, one that shifts by shift, by product mix, and by which machine is quietly running slower than its spec sheet says. Real-time capacity planning closes that gap by replacing the static, once-a-month capacity model with a live view of what a plant can actually produce right now, updated continuously as machines, constraints, and demand shift underneath the plan. Manufacturers ready to see the difference between their planned and actual capacity can talk to iFactory AI about mapping their own live capacity model.
Plan Against the Capacity Your Plant Actually Has, Not the Number on the Spec Sheet
iFactory AI turns live OEE, queue depth, and constraint data into a real-time capacity model — so planners schedule against what the floor can deliver today, not a theoretical maximum nobody has ever reached.
The Same Factory Can Show 60% or 95% Utilization — On the Same Day
Capacity utilization looks like a simple formula: actual output divided by maximum possible output. The ambiguity hides in the denominator. "Maximum possible output" can mean theoretical design capacity running around the clock with zero stops, or it can mean effective capacity — what the line can realistically deliver once planned downtime, changeovers, and real machine performance are subtracted out. Both numbers are arithmetically correct for the same plant on the same day. Only one of them is useful for a planner deciding what to promise a customer.
The top speed a machine or line could run with zero stops, zero changeovers, and perfect first-pass quality. Useful for capital planning. Useless as a scheduling promise.
Design capacity multiplied by real availability, performance, and quality — the same math behind OEE. This is what the floor can actually deliver, and it is the number a live capacity model has to track.
A line running at 60% OEE has an effective capacity of 60% of its design number — not 85%, not 75%. Planning against anything higher than the real OEE is planning against a number the floor was never going to hit.
Why a Monthly Capacity Number Is Already Wrong by Week Two
Static capacity plans assume the conditions on the day they were built hold for the whole planning period. On a real floor they rarely do. A single bearing starting to wear, a shift change, or a product-mix swing can move the constraint — and the plan — before the ink is dry.
The Constraint Migrates
The slowest station under one product mix is not necessarily the slowest under another. A constraint that held for last month's schedule can shift stations entirely once the mix or shift pattern changes.
Downtime Isn't in the Model
A machine flagged for bearing wear or awaiting a maintenance window is still counted at full capacity in a static plan, right up until it actually stops — at which point the plan is already wrong.
Queue Time Hides in the Gaps
In most job shops, queue time accounts for the majority of total cycle time — not run time. A capacity number built only from run-time assumptions misses where the time is actually going.
Demand Doesn't Wait for the Next Review
A rush order or a forecast swing that lands mid-cycle has nowhere to go in a plan that only gets rebuilt once a month, forcing planners back into manual, reactive rescheduling.
See the Gap Between Your Planned and Actual Capacity
Book a 30-minute session and iFactory AI will walk through what a live effective-capacity model looks like against your existing OEE and production data.
A Live Capacity View Across the Floor
A useful real-time capacity model doesn't report one plant-wide number — it shows each line or work center's actual utilization next to its effective capacity ceiling, so a gap is visible immediately rather than buried in a monthly report.
In this pattern, Line C is the binding constraint setting the pace for the whole system, while Line B and Line D both carry a meaningful recoverable gap between what they are running and what they could sustainably deliver. That is where a capital-spend conversation turns into a data-backed recovery plan instead of a guess.
The Three Metrics a Live Model Has to Separate
Utilization, efficiency, and OEE get confused constantly, and the confusion is exactly what makes a static capacity number misleading. A real-time model tracks all three separately because each answers a different question.
Time used divided by time available. A machine running 7 hours of an 8-hour shift is 87.5% utilized, regardless of how fast or well it actually produced during that time.
Actual output rate against standard rate. A machine rated for 30 parts per hour that produces 24 is running at 80% efficiency — it was running, just slower than spec.
Availability multiplied by performance multiplied by quality. The composite number that turns theoretical design capacity into the effective capacity a plan can actually trust.
Recoverable Capacity Versus a New Capital Line
A plant convinced it is out of capacity often prices a new machine before checking whether the capacity it already owns is fully in use. Real utilization data frequently tells a different story.
Finding the Constraint Before It Finds the Schedule
Every line has one station that sets the pace for the whole system, and the intuitive way to find it — "look for the slowest machine" — fails more often than it works. The visible queue usually builds two or three stations downstream from where the real limit sits, and the constraint itself moves as product mix and shift conditions change.
Continuous Per-Station Data
Cycle time or parts-per-hour, availability, and queue depth between stations, all time-stamped — the minimum dataset a live constraint model needs to work from.
Migration Detection
Because the model reads every station simultaneously, a constraint shifting from one line to another under a mix change surfaces within minutes instead of after a shift report.
Queue-Aware Target
Finite capacity planning targets roughly 85–90% utilization at the constraint rather than pushing for 100%, because queue time compounds sharply as utilization approaches its ceiling.
Dynamic Schedule Adjustment
When the model confirms a shift in the binding constraint, the schedule adjusts to protect the new limiting station rather than continuing to optimize around the old one.
A Composite Scenario: The Capacity Gap That Was Hiding in Plain Sight
A components manufacturer was preparing a capital request for a second machining line after several consecutive quarters of missed delivery dates, with the plant floor consistently reporting itself at or near full capacity on the weekly production board.
Once live per-station utilization data was pulled instead of the weekly estimate, the picture changed. The machining line quality teams had flagged as "maxed" was actually running at just over half its available time — starved for parts by an upstream station nobody had been tracking closely, which was itself running comfortably inside its own ceiling. The real constraint was a single under-resourced changeover step two stations upstream, invisible on the weekly board because its own utilization number looked unremarkable in isolation. Re-sequencing changeovers at that step and rebalancing labor recovered enough throughput to defer the capital request for a full budget cycle.
What Feeds a Real-Time Capacity Model
A live model is only as good as the data streams behind it. iFactory AI connects the systems that already run the floor rather than asking planners to build a new data source from scratch.
OEE and Machine Health
Availability, performance, and quality readings roll continuously into the effective-capacity number for every asset, replacing rated speed with real speed.
Maintenance Status
A machine flagged for a bearing issue or entering a maintenance window automatically loses its capacity allocation in the model, before it becomes an unplanned stop.
Queue Depth Between Stations
Work-in-progress building up between stations is tracked continuously, surfacing where cycle time is actually being lost rather than assuming it is all run time.
Live Demand Signals
Sales orders and forecast changes feed the same model, so a rush order or a mix shift is evaluated against real current capacity rather than last month's plan.
iFactory AI arrives pre-configured on an NVIDIA server that ships racked and ready with software pre-loaded — rack it, connect power and Ethernet, and the live capacity model is running. Scope covers cabling, network, PLC and SCADA integration, operator training and 24×7 remote monitoring, so planners get a working capacity view rather than a dashboard to configure themselves.
Frequently Asked Questions
What's the difference between real-time capacity planning and production scheduling?
Capacity planning answers how much a plant can realistically produce right now, across every line and station, while scheduling decides the order and timing of specific jobs against that capacity. A live capacity model is the foundation scheduling has to trust — without an accurate, continuously updated effective-capacity number, even the best scheduling engine ends up optimizing against a ceiling that doesn't actually exist. iFactory AI's broader scheduling capabilities build on top of this same live capacity data, and our team can walk through how the two connect for your specific setup.
Why does the same plant sometimes show very different utilization numbers?
It almost always comes down to which "maximum possible output" figure is used in the denominator. Design capacity assumes zero stops and perfect performance, while effective capacity accounts for real availability, performance, and quality — the same components that make up OEE. A plant reporting 95% against design capacity might be sitting at 60% against effective capacity, and only the second number reflects what the floor can reliably deliver against a delivery promise.
How is a bottleneck identified when it keeps moving between stations?
A live model reads cycle time, availability, and queue depth across every station simultaneously rather than snapshotting one point in time, so a shift in the binding constraint under a new product mix or shift pattern surfaces within minutes instead of after the fact. The visible queue buildup is often two or three stations downstream from the actual limiting operation, which is why continuous, all-station monitoring outperforms a manual time-and-motion study that only captures one moment under one set of conditions.
Can this help us avoid buying new equipment we don't actually need?
Often, yes. Many plants carry meaningfully more recoverable capacity than the weekly production board suggests, because a line that looks maxed can actually be starved by an upstream constraint rather than genuinely at its ceiling. Pulling real per-station utilization data before pricing new equipment frequently uncovers that the missing throughput was already sitting inside the existing floor. Book a demo to see what a live utilization view surfaces on your own lines before committing to a capital request.
What data do we need before we can start real-time capacity planning?
The minimum workable dataset is per-station cycle time or output rate, availability, and queue depth between stations, all time-stamped consistently. Most plants already generate a version of this data through existing MES, PLC, or sensor infrastructure, which means the starting point is usually connecting and time-aligning what already exists rather than instrumenting the floor from zero. From there, effective-capacity baselines can be calibrated against actual historical performance rather than rated machine speeds.
Stop Planning Against a Capacity Number That Was Never Real
iFactory AI turns live OEE, queue, and constraint data into a real-time effective-capacity model, so planners schedule against what the floor can actually deliver — today, not last month's estimate. Book a walkthrough to see it on data like yours.