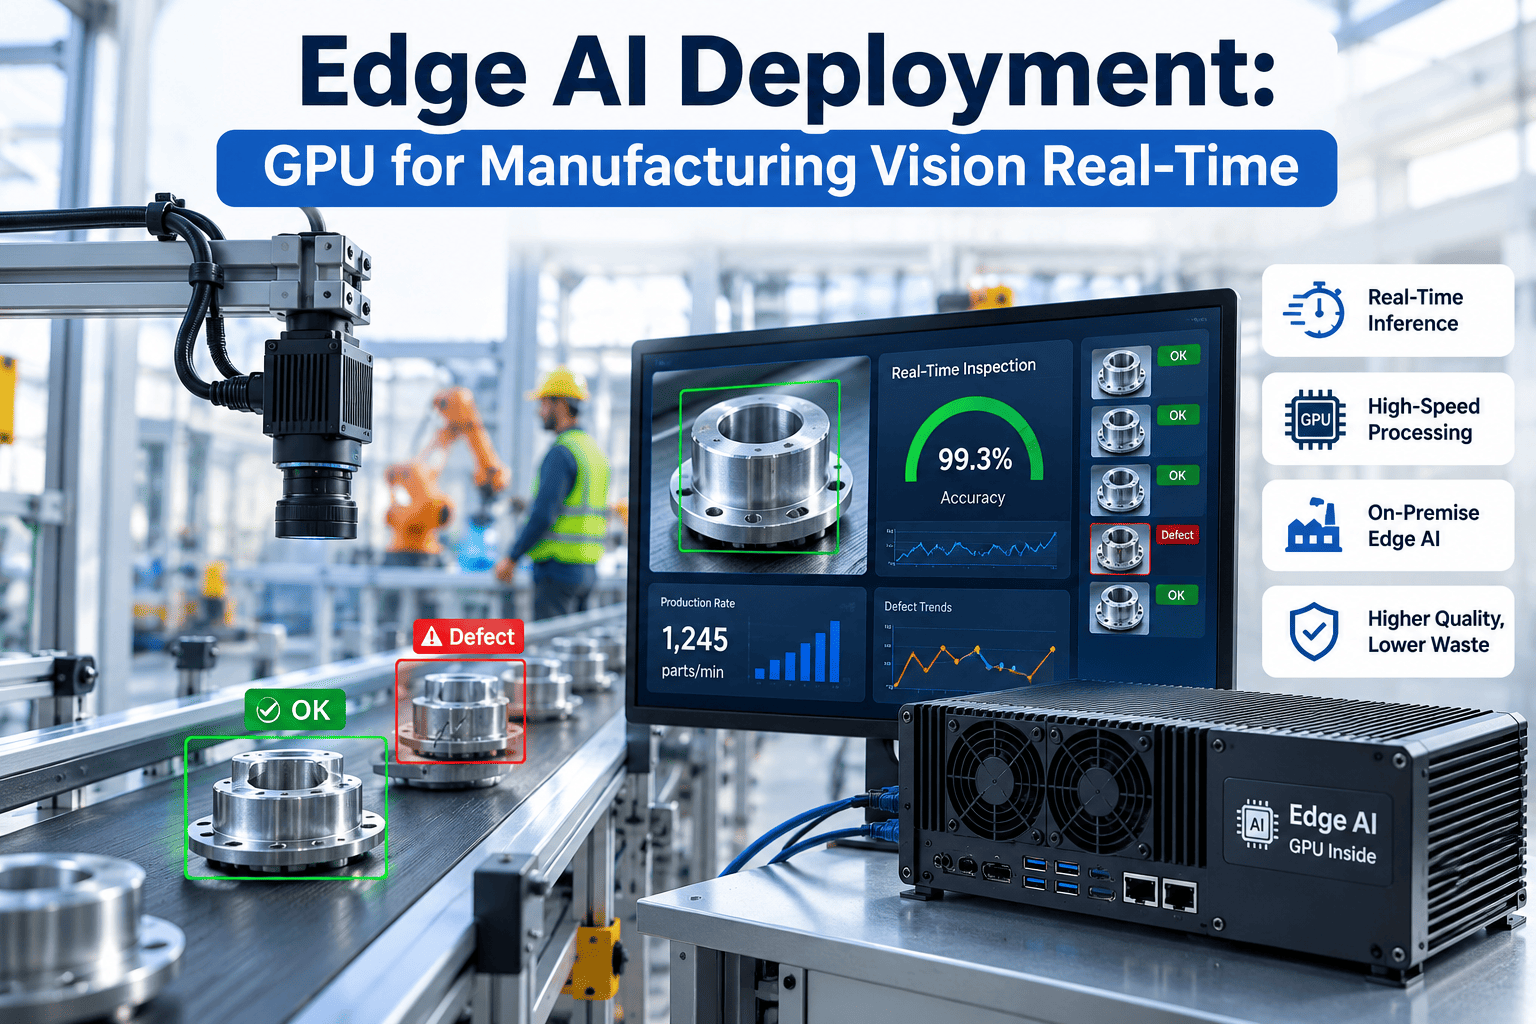
A model that classifies defects with 96% accuracy in a benchmark is not yet a production system — it becomes one only after someone specifies the GPU hardware that will run it, at the frame rate the production line actually demands, continuously, in an industrial enclosure that has to manage heat, vibration, and dust rather than the climate-controlled server room the benchmark was measured in. Edge AI deployment for manufacturing vision is fundamentally a hardware sizing problem wrapped around a software optimization problem, and getting either half wrong produces the same result: a vision system that works perfectly in a demo and fails to keep pace once it is bolted to a real production line running at real speed. This is a practical reference for sizing GPU compute, optimizing models for edge inference, and architecting the edge-cloud split that keeps a manufacturing vision system running reliably at production speed. Book a session with the iFactory edge infrastructure team to review compute sizing for your specific line speed and model requirements.
AI Vision · Edge Compute & GPU Deployment
Edge AI Deployment for Manufacturing Vision: GPU Hardware Selection for Real-Time Inspection
Matching GPU throughput to actual production line speed, optimizing models for edge inference constraints, and architecting the edge-cloud split that keeps real-time manufacturing vision systems running reliably in production — not just in a benchmark.
Inference Throughput by GPU Class vs. Line Speed Requirement
Throughput measured on a representative object detection model at 640×640 input resolution with INT8 quantization. Actual FPS varies with model architecture and resolution.
Real-Time Constraint Definition
Establishing the Actual Latency and Throughput Budget Before Selecting Any Hardware
Hardware selection is meaningless without first establishing the actual performance requirement in concrete numbers — a step frequently skipped in favor of buying "the fastest available" GPU, which either overspends significantly or, more dangerously, still underperforms if the wrong performance dimension was optimized. Manufacturing vision has two distinct performance requirements that are easily conflated: throughput (how many parts or frames per second the system must process to keep pace with the line) and latency (how quickly a single inference decision must complete, relevant when the decision gates a downstream action like a reject mechanism).
Throughput Requirement
Required FPS = Line speed (parts/min or mm/min) ÷ Inspection interval
For a discrete parts line running 600 parts per minute with one inspection per part, the throughput requirement is 10 FPS minimum. For continuous web inspection at 30 m/min with a required 0.1mm along-web resolution, the requirement translates to several thousand line-scans per second — a dramatically different order of magnitude that must be calculated explicitly, not assumed.
Latency Requirement
Required latency = Time from capture to actuator decision point
If a reject mechanism must fire within 50ms of image capture to intercept a defective part before it passes a fixed physical point on the line, the entire inference pipeline — preprocessing, model inference, post-processing, decision logic — must complete within that window, not just the model's raw inference time in isolation.
The throughput and latency requirements are independent constraints that both must be satisfied — a GPU capable of high aggregate throughput through batching may still fail a tight single-inference latency requirement if the batching strategy introduces queuing delay, making the two calculations equally essential before hardware selection.
GPU Selection Matrix
Matching GPU Class to Workload — Entry, Mid-Range, and High-Performance Edge Compute
Edge GPU selection spans a wide performance and cost range, and the correct choice depends on model complexity, resolution requirements, number of simultaneous camera streams, and the throughput/latency requirements established above — not on defaulting to the highest-spec option available.
| GPU Class |
Typical Compute (TOPS/TFLOPS) |
Simultaneous Streams |
Best Fit |
Power / Thermal Envelope |
| Entry edge (e.g. Jetson Orin Nano class) |
~20–40 TOPS |
1–2 streams, compact models |
Single-camera stations, lightweight classification tasks |
Low — 7–15W, fanless enclosure viable |
| Mid-range edge (e.g. Jetson Orin NX/AGX class) |
~70–275 TOPS |
2–6 streams, moderate complexity models |
Multi-camera inspection stations, standard detection models |
Moderate — 15–60W, active cooling typical |
| High-performance edge (discrete GPU server) |
>300 TOPS / multi-TFLOP FP16 |
8+ streams, complex models, high resolution |
Wide-web line-scan inspection, multi-line aggregated compute, heavy segmentation models |
High — 150–300W+, dedicated cooling and enclosure design required |
Published TOPS/TFLOPS figures represent peak theoretical performance under ideal conditions — sustained real-world throughput under continuous production load and realistic thermal conditions typically runs 40 to 70% of peak figures, and any sizing calculation should use sustained-performance estimates, not peak marketing specifications.
Model Optimization for Edge
Compressing and Accelerating Models to Fit the Edge Inference Budget
A model trained and validated at full precision on a development GPU almost always requires optimization before it will meet edge deployment throughput and latency targets on lower-power hardware. Optimization is not optional overhead — it is a required engineering phase with its own techniques and trade-offs.
Quantization
Reducing numerical precision from 32-bit floating point (FP32) to 16-bit (FP16) or 8-bit integer (INT8) representation dramatically reduces memory footprint and increases inference speed, often by 2 to 4 times, at a typically small accuracy cost when calibrated correctly against representative data. INT8 quantization without proper calibration can degrade accuracy disproportionately on subtle defect classes — calibration using representative production data is essential, not optional.
Pruning
Removing redundant or low-importance network connections and channels reduces model size and computation without a proportional accuracy loss, since trained networks typically contain significant redundancy. Structured pruning (removing entire channels or filters) produces hardware-friendly speedups more reliably than unstructured pruning, which can require specialized sparse computation support to realize actual speed gains.
Knowledge Distillation
Training a smaller, faster "student" model to replicate the behavior of a larger, more accurate "teacher" model — often achieving accuracy closer to the larger model than training the small architecture from scratch would produce. Useful when the target edge hardware genuinely cannot support the full-size model regardless of quantization and pruning applied to it.
Graph and Kernel Optimization
Runtime-specific graph compilation (via TensorRT, ONNX Runtime, or equivalent) fuses operations, eliminates redundant computation, and selects hardware-optimized kernel implementations for the specific target GPU architecture — often providing meaningful speedup with no accuracy trade-off at all, making this the first optimization step to apply before considering accuracy-affecting techniques.
Get Your Compute Requirement Calculated, Not Estimated
iFactory Sizes GPU Hardware Against Your Actual Model, Line Speed, and Camera Configuration
Most edge AI hardware decisions are made from vendor marketing specifications rather than a sizing calculation grounded in the actual model architecture and production constraints. iFactory's compute sizing assessment benchmarks your specific model on candidate hardware and confirms it meets your throughput and latency requirements before any purchase decision.
Edge-Cloud Architecture Split
What Runs at the Edge, What Runs in the Platform — and Why the Split Matters
Not every computational task in a manufacturing vision system belongs at the edge, and not every task belongs in the cloud or central platform. The correct architectural split is determined by latency sensitivity and data volume — tasks requiring sub-100ms response ride on the edge; tasks requiring large historical context or cross-line aggregation belong in the platform.
Edge Responsibilities
Real-time inference — the classification or detection decision gating an immediate production action
Preprocessing and image capture pipeline management
Local buffering for network interruption resilience
Basic anomaly flagging before data leaves the local network
Deployment Scaling
From Single Camera to Multi-Line Plant-Wide Deployment
Edge AI deployments typically start at a single inspection station and expand across additional lines and plants over time — the architecture decisions made at the first deployment significantly determine how smoothly that scaling occurs.
01
Single Station Validation
Initial deployment on one inspection station, validated against real production throughput and accuracy requirements over a sustained period before any scaling decision — this phase surfaces integration issues (thermal, vibration, network reliability) that a lab benchmark cannot reveal.
02
Standardized Edge Node Template
Once validated, the hardware configuration, enclosure design, and software deployment package are standardized into a repeatable template — reducing per-station deployment effort for subsequent lines from a custom integration project to a configuration exercise.
03
Fleet Management Infrastructure
As edge node count grows beyond a handful, centralized fleet management for model version deployment, health monitoring, and remote diagnostics becomes necessary rather than optional — manually managing individual edge devices does not scale past a small initial deployment.
04
Cross-Plant Standardization
Expanding across multiple plants introduces variation in line speed, product mix, and existing infrastructure — the edge-cloud architecture must accommodate plant-specific model variants and configuration while maintaining a consistent central platform for aggregated analytics and fleet-wide model governance.
Edge Deployment KPIs
Six Metrics That Define Production Edge AI Infrastructure Health
Sustained Inference Throughput
Target: >120% of line requirement
Actual measured throughput under continuous production load and realistic thermal conditions, maintaining margin above the calculated line speed requirement to accommodate variability and prevent bottleneck during peak conditions.
End-to-End Decision Latency
Target: within actuator response window
Total time from image capture to actionable decision output, measured on production hardware — not model inference time alone, which excludes preprocessing, post-processing, and any queuing delay in the full pipeline.
GPU Utilization
Target: 60–80% sustained
Average GPU compute utilization under normal production load. Persistently near 100% indicates insufficient headroom for demand variability; persistently low utilization indicates over-provisioned hardware relative to actual workload.
Thermal Throttling Events
Target: 0 per month
Occurrences of the GPU reducing clock speed due to thermal limits being reached, which directly degrades sustained throughput below rated specification. Any occurrence indicates inadequate cooling design for the actual enclosure and ambient conditions.
Edge Node Uptime
Target: >99.5%
Percentage of scheduled production time the edge inference system is operational and processing. Downtime attributable to the vision system itself (not upstream production stoppage) should be tracked separately as a direct reliability metric of the edge infrastructure.
Model Deployment Lead Time
Target: <24 hours fleet-wide
Time required to deploy an updated model version across all edge nodes in the fleet, from validation approval to live production status. Long deployment lead times slow the feedback loop between model improvement and production benefit.
From the Infrastructure Floor
“
The mistake I see most often in edge AI hardware procurement is buying compute based on a spec sheet comparison rather than a benchmark of the actual model on the actual candidate hardware. Published TOPS figures are peak theoretical numbers measured under conditions no production deployment will ever match — a fanless enclosure sitting near a stamping press in a hot manufacturing environment will not sustain the same clock speeds as a GPU on an open test bench in a climate-controlled lab. I have seen teams purchase hardware that looked comfortably oversized on paper, only to discover in production that sustained throughput under real thermal load came in at sixty percent of the rated figure — barely adequate, with none of the margin the paper specification suggested. The fix is straightforward but consistently skipped: benchmark the actual model, quantized and optimized the way it will actually run in production, on the actual candidate hardware, under conditions that approximate the real deployment environment, before committing to a purchase. It takes an extra week. It prevents discovering the hardware is undersized after it is already bolted to the line.
Tobias Mwangi-Reinholt
Edge AI Infrastructure Engineer · MLOps for Manufacturing Specialist · 16 years deploying and scaling edge compute systems across automotive, electronics, and general manufacturing · Former Principal Infrastructure Engineer, industrial AI platform provider · NVIDIA Deepstream and TensorRT deployment specialist
Infrastructure Team Questions
Edge AI Deployment for Manufacturing Vision — Frequently Asked
How do we calculate the correct GPU size for a multi-camera inspection station rather than a single camera?
Multi-camera sizing starts with the same per-stream throughput calculation used for a single camera, then accounts for whether the streams can share compute efficiently through batching or require independent processing. If multiple cameras are inspecting the same product simultaneously from different angles with similar timing, batched inference across streams often achieves better aggregate throughput per unit of compute than running each stream independently, since batching improves GPU utilization efficiency. If cameras operate on independent timing (different stations, different trigger events), independent per-stream allocation is usually simpler and more predictable, at some cost to aggregate hardware efficiency. The total required compute is approximately the sum of per-stream requirements adjusted for the efficiency gain from batching where applicable, and the correct approach for a specific multi-camera configuration should be validated through benchmarking on candidate hardware rather than calculated purely theoretically, since actual batching efficiency varies by model architecture and framework. For a sizing calculation specific to your camera count and configuration,
book a session with the iFactory edge infrastructure team.
Is it better to use one powerful centralized edge server for multiple inspection stations, or a dedicated smaller GPU at each station?
This decision depends primarily on the physical layout and network topology of the stations relative to each other, and on the criticality of maintaining inspection capability if a single compute unit fails. A centralized server approach reduces total hardware cost through better utilization efficiency (aggregate demand across stations is typically smoother than any single station's demand) and simplifies fleet management to a single node rather than many, but creates a single point of failure — if the centralized server goes down, every connected station loses inspection capability simultaneously, and network latency to remote stations must be accounted for in the latency budget. A dedicated-per-station approach costs more in aggregate hardware but isolates failures to a single station and eliminates network latency from the inference path entirely, generally preferred when stations are physically distant from each other, when network reliability between stations and a central point is uncertain, or when the cost of losing multiple stations simultaneously to a single hardware failure is unacceptable. Many production deployments use a hybrid: dedicated edge compute for the real-time inference decision at each station, with a centralized platform layer handling the less latency-sensitive aggregation and analytics workload.
How much accuracy do we typically lose when optimizing a model for edge deployment through quantization and pruning?
With proper calibration, INT8 quantization typically produces accuracy degradation in the range of 0.5 to 2 percentage points on standard object detection metrics for most manufacturing vision models — a generally acceptable trade-off given the substantial throughput improvement gained. Poorly calibrated quantization, particularly using generic calibration data rather than representative production imagery, can produce significantly worse degradation, disproportionately affecting subtle or rare defect classes that were already operating near the model's confidence threshold before optimization. Pruning's accuracy impact varies more widely depending on how aggressively the network is pruned — light to moderate structured pruning (removing 10 to 30% of parameters) typically shows minimal accuracy impact when combined with brief fine-tuning after pruning, while aggressive pruning beyond that range increasingly risks measurable accuracy loss, particularly on the rare, subtle defect classes that already have the least representation in most training datasets. The critical practice is validating optimized model accuracy against the full validation set, broken down per defect class, after every optimization step — aggregate accuracy figures can mask disproportionate degradation on the specific classes that matter most for your quality risk profile.
Contact our support team for optimization methodology specific to your model and defect catalog.
What happens to production inspection if the edge device or its network connection fails during a shift?
A well-architected edge deployment includes explicit failure mode handling rather than assuming continuous availability. For network failure between the edge device and the central platform, the edge device should continue operating autonomously — real-time inference decisions do not require a live platform connection since the model runs locally, with local buffering storing results for upload once connectivity restores, as described in the edge-cloud architecture split above. For edge device hardware failure itself, the mitigation depends on the criticality established during architecture planning — some deployments include redundant edge compute at critical stations with automatic failover, while others accept a defined fallback procedure (routing to manual inspection, or triggering a controlled line stop) for the duration of hardware replacement, based on a documented risk assessment of the specific station's criticality. The fleet management infrastructure discussed in the deployment scaling section should include automated health monitoring that detects device failure or degraded performance immediately, minimizing the time before the defined fallback procedure activates or replacement hardware is dispatched.
Book a session to discuss failure mode planning for your specific station criticality profile.
How often do we need to upgrade edge hardware as models and requirements evolve, and how should we plan for this?
Edge hardware typically has a useful production lifespan of 4 to 6 years before performance, power efficiency, or vendor support considerations justify replacement, though this varies with how aggressively the deployment's requirements grow over that period. Sizing initial hardware with reasonable headroom above current requirements — the 20% throughput margin referenced in the KPI section, plus additional margin for anticipated model complexity growth as defect catalogs expand or additional inspection tasks are added to the same station — extends useful hardware life meaningfully compared to sizing precisely to current-day requirements with no growth allowance. Planning for hardware refresh should be built into the broader AI programme roadmap rather than treated as a reactive, unplanned capital expense — tracking GPU utilization trends over time (per the KPI above) provides an early warning when a station's compute demand is approaching the ceiling of its current hardware, allowing proactive budget planning before performance actually degrades in production. For a hardware lifecycle and refresh planning framework specific to your deployment scale,
book a session with our team.
Size the Hardware to the Actual Requirement — Not the Spec Sheet
Get GPU Compute Sized and Benchmarked Against Your Actual Model and Line Speed
iFactory's edge infrastructure team benchmarks your specific model — quantized and optimized the way it will actually run in production — on candidate GPU hardware under realistic thermal and load conditions, confirming sustained throughput and latency meet your production requirement before any purchase decision. From single-station validation through multi-plant fleet deployment, we architect the edge-cloud split that keeps your vision system running reliably at production speed.