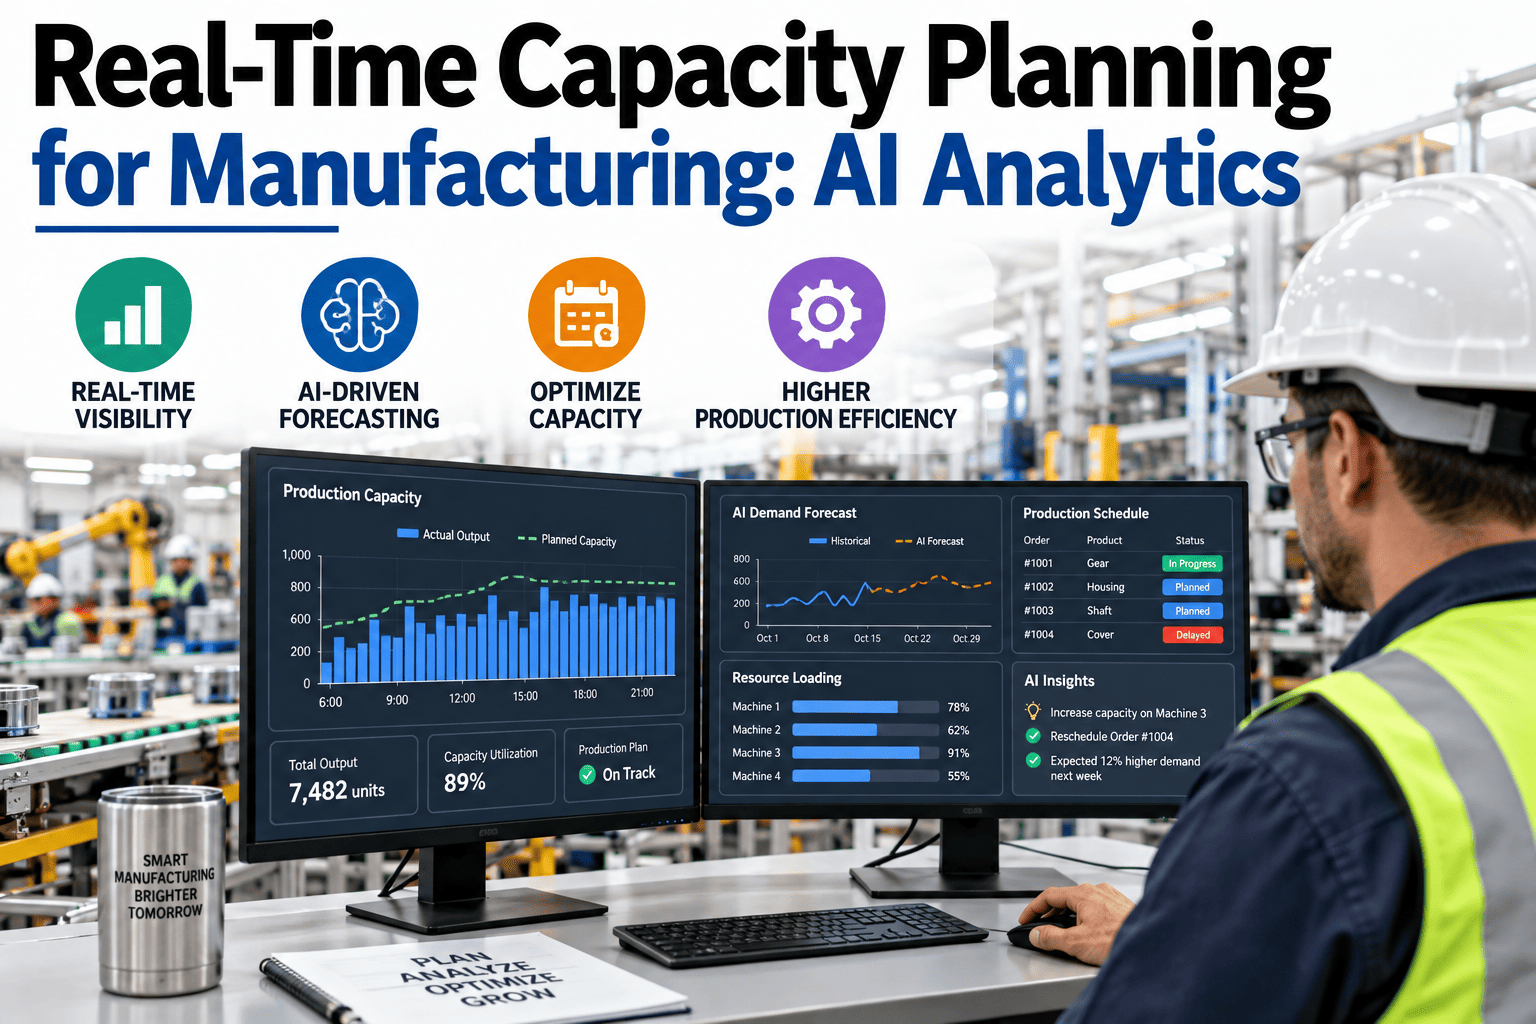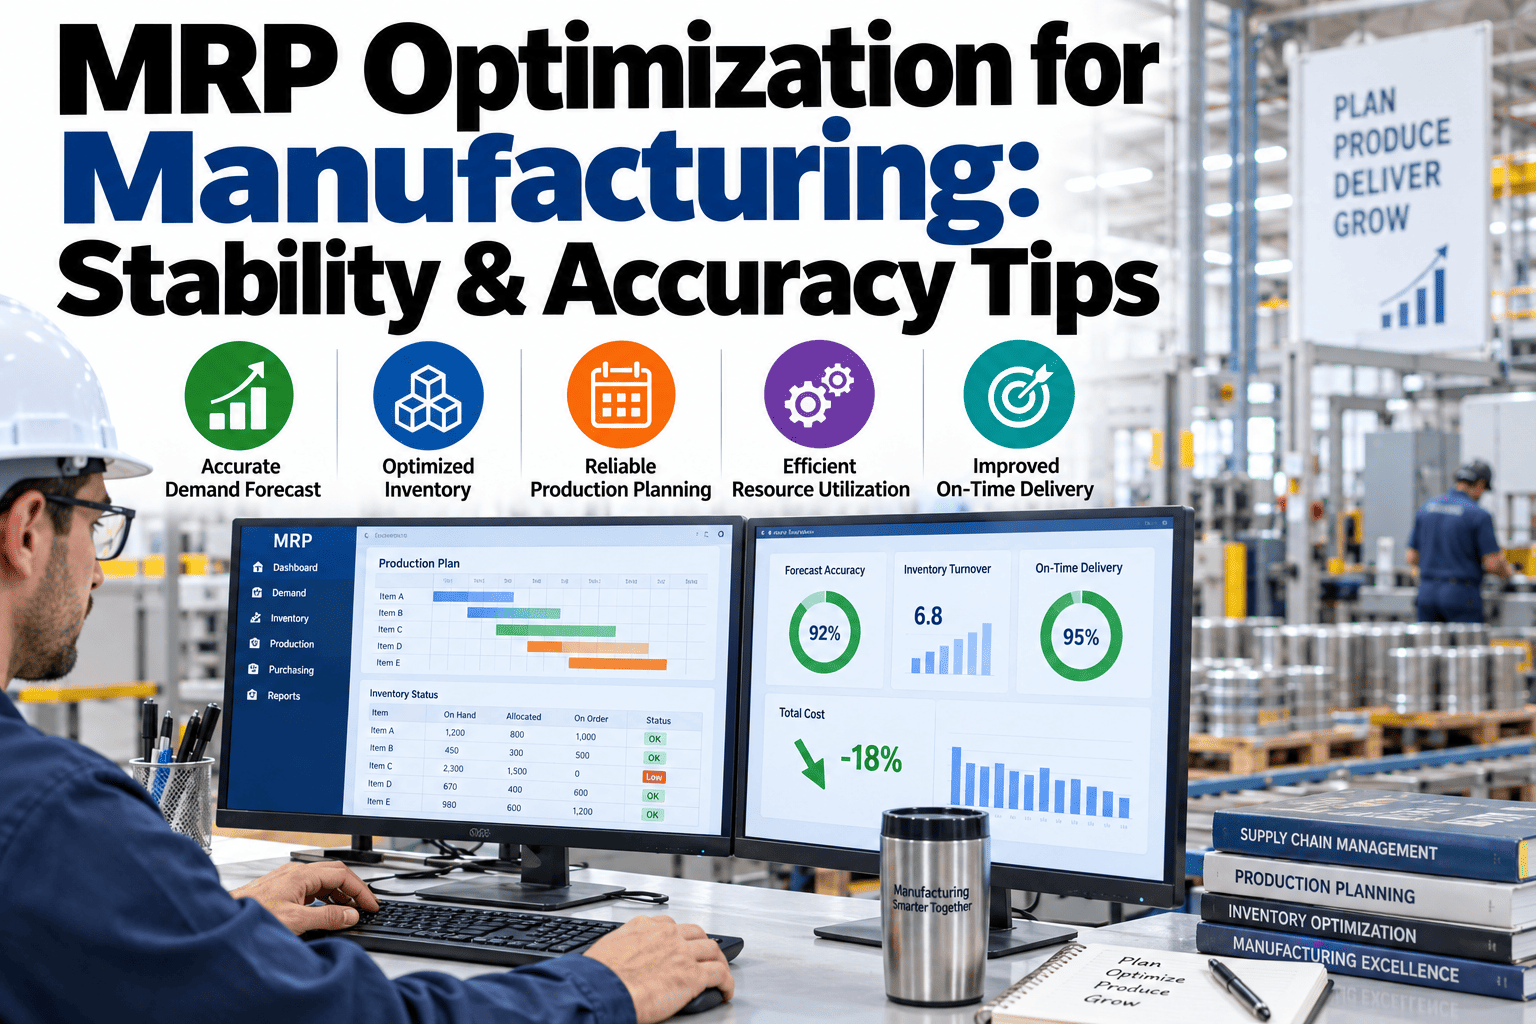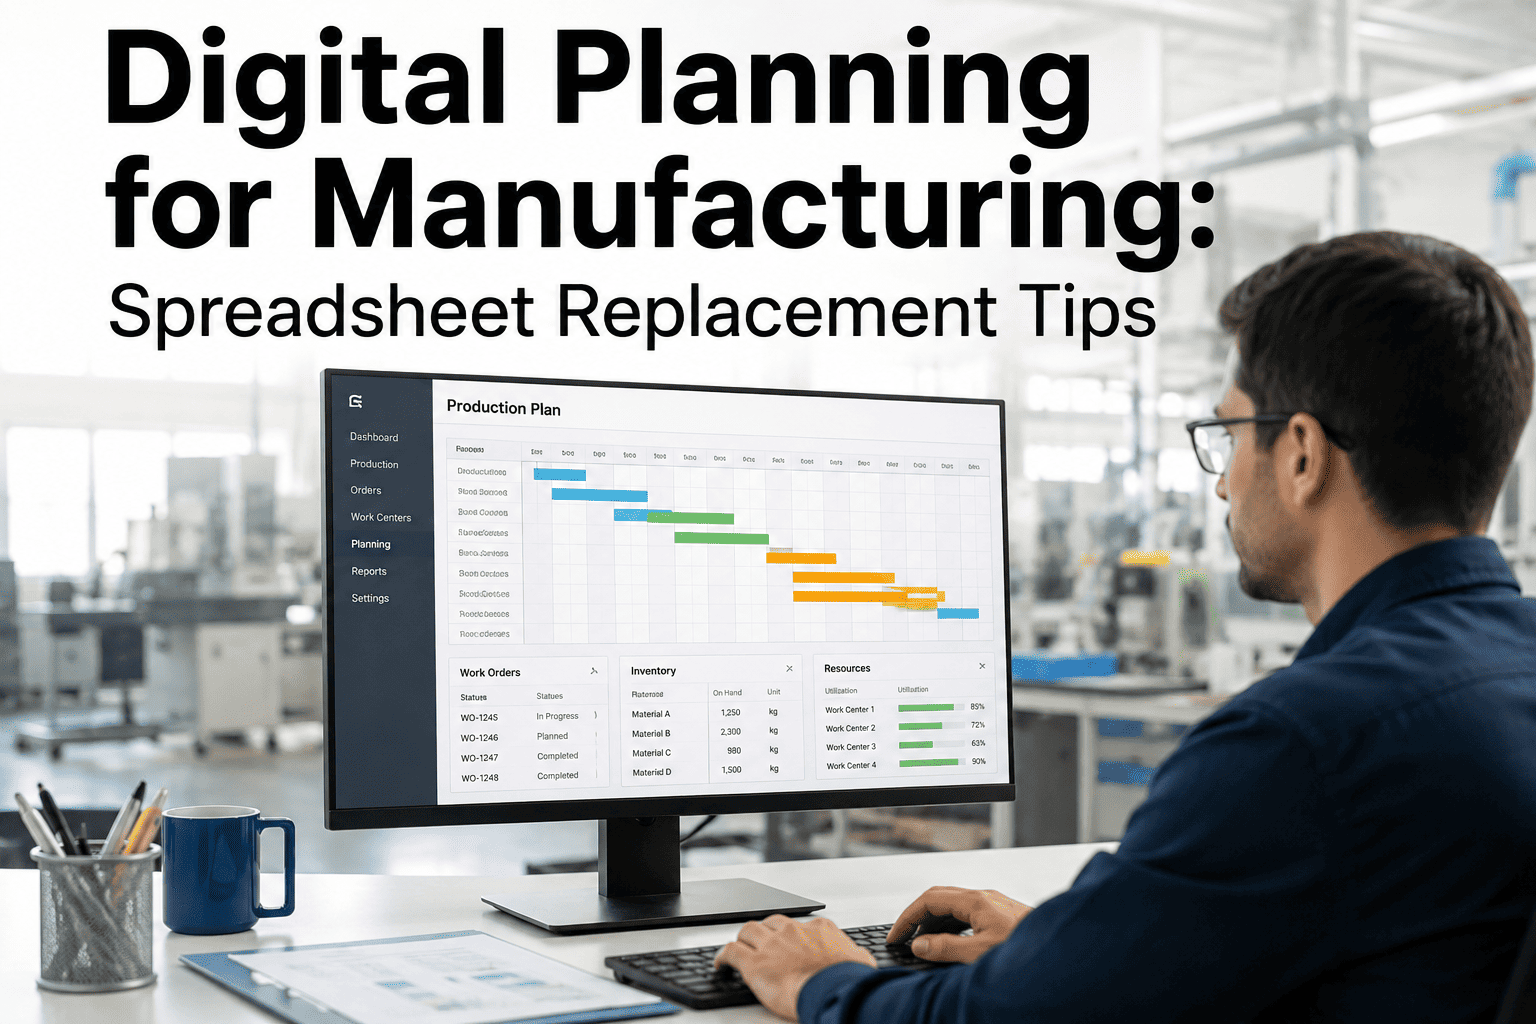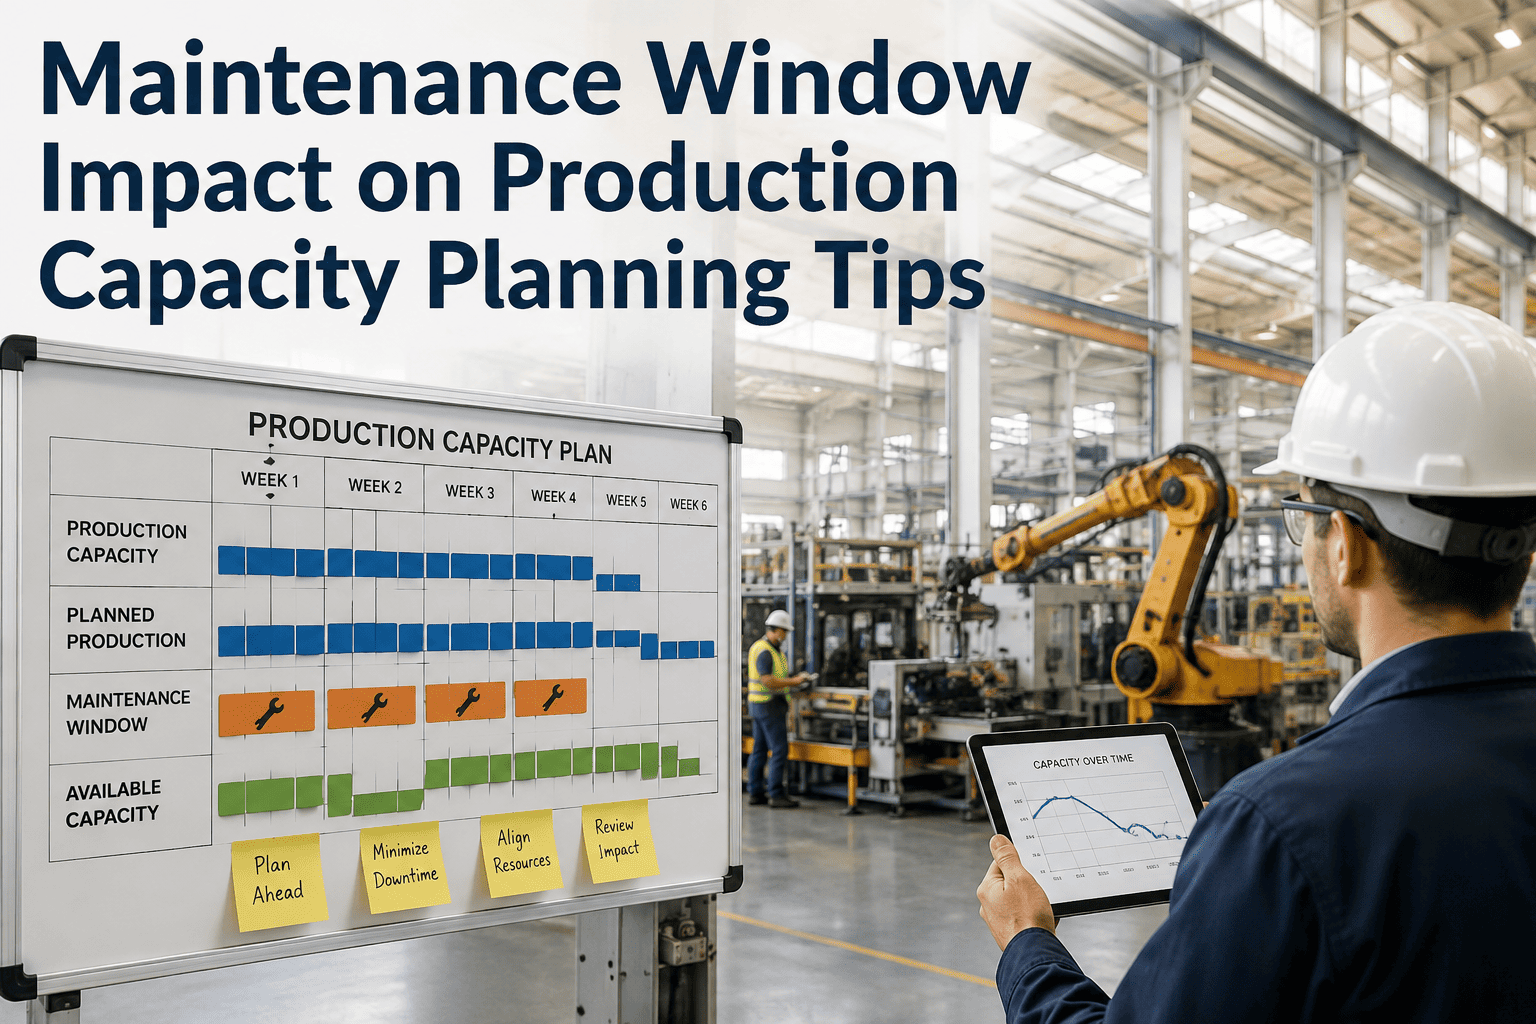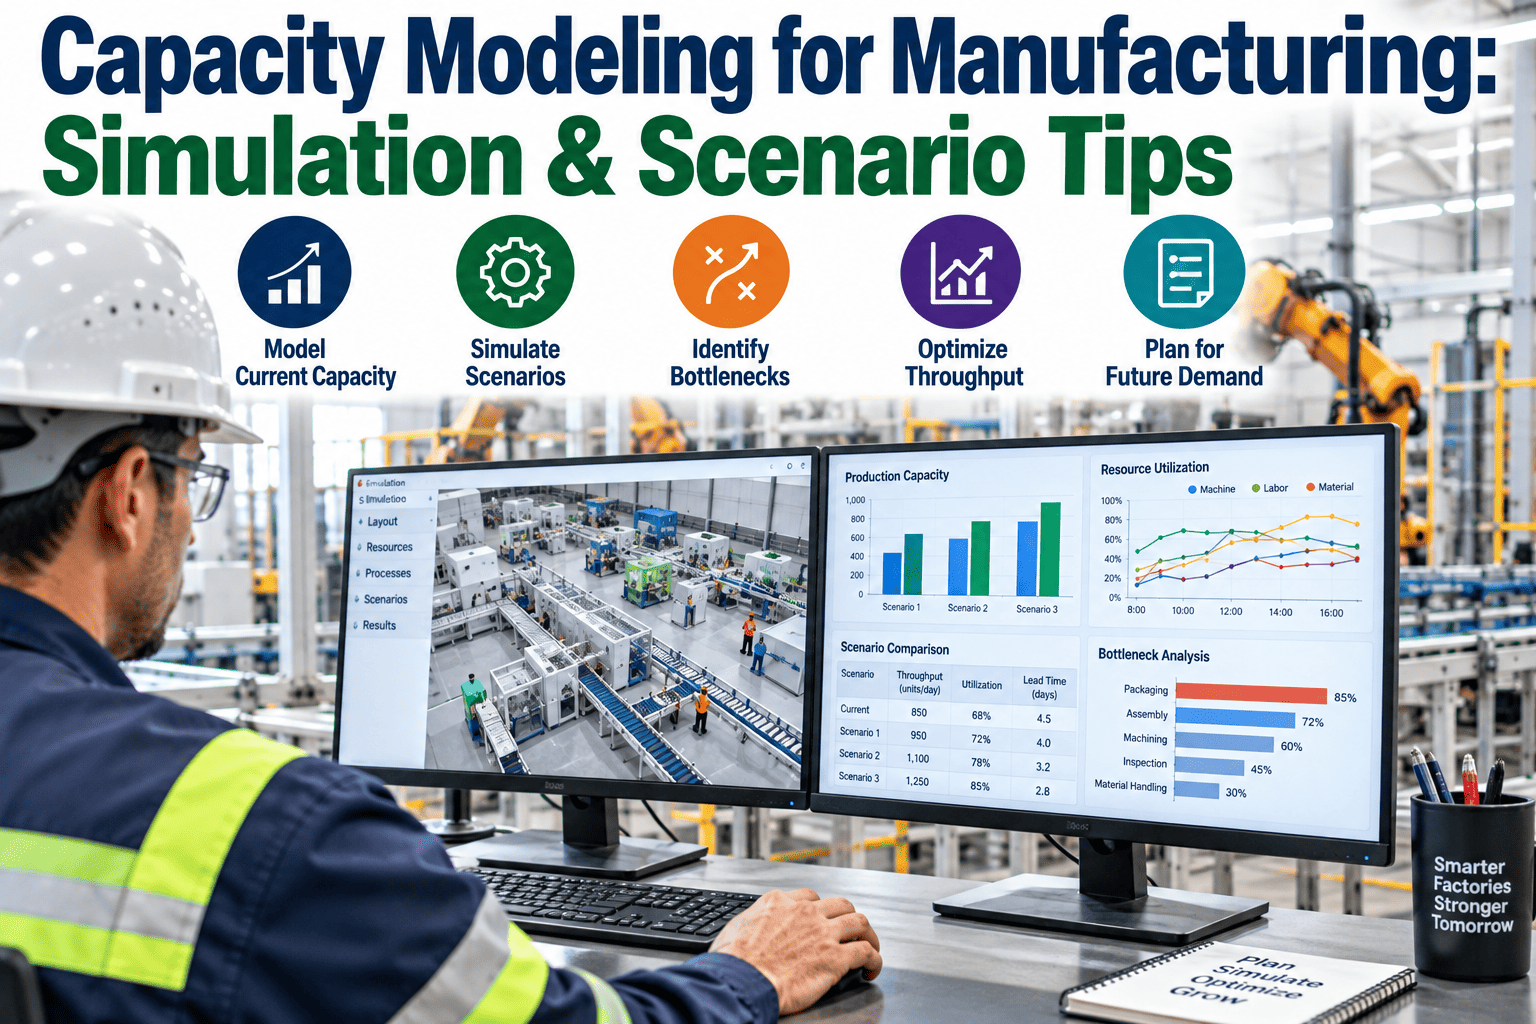
The question a plant manager actually needs answered is never "do we have enough capacity," it's "which of these three ways of getting more capacity is the right one to spend money on." Add a shift, add a machine, or send the overflow to a contract manufacturer — each option has a real cost and a real risk, and most plants still choose between them with a spreadsheet that assumes everything runs at its rated speed with no downtime, no changeover, and no variability. Boeing found this out the hard way on a paint facility where Excel-based capacity studies couldn't handle the batching rules and sequencing constraints that actually governed throughput, and had to move to simulation to get an answer Excel simply couldn't produce. iFactory AI builds that same kind of model against your own line, so the equipment-versus-shift-versus-outsource decision is made on evidence instead of a guess — see what a model of your line would show.
Before You Spend on Capacity, Simulate the Decision First
Equipment addition, shift extension, and outsourcing all promise more capacity — but a spreadsheet can't show you how each one actually behaves under real variability, changeover, and downtime. iFactory AI builds a working model of your line so you can test the decision before you fund it.
A Rated-Capacity Number Isn't a Capacity Plan
Most capacity spreadsheets start from a nameplate number — units per hour times hours per shift times shifts per week — and call that the plant's capacity. It's a clean number, and it's almost never the number the plant actually achieves, because it assumes every machine runs at its rated speed continuously with no changeover, no starved or blocked stations, and no variation in cycle time.
Real lines don't work that way. A bottleneck shifts depending on which product is running. A changeover eats twenty minutes nobody put in the spreadsheet. One station running slightly slower than its neighbors creates a queue that ripples through the rest of the line. None of that shows up in a static formula, which is exactly why static capacity math routinely gets the equipment-versus-shift-versus-outsource decision wrong.
The Boeing paint facility case is a useful illustration precisely because it wasn't an unusually complicated plant, it was a plant with the same kind of batching and sequencing rules most manufacturers live with every day. The spreadsheet couldn't show buffer requirements or predict on-time delivery by part, and leadership was left choosing between over-investing in equipment they didn't need or under-preparing for demand they couldn't see coming.
What makes that outcome so costly is that both failure modes are expensive in different ways. Over-investing ties up capital in equipment that sits underutilized for years, a mistake that shows up on the balance sheet long after the decision is made. Under-preparing shows up faster and more painfully, as missed delivery dates, expedited freight, and customers who start looking elsewhere. A model that can distinguish between the two outcomes before either one happens is worth far more than the cost of building it.
Equipment, Shifts, or Outsourcing — Each Behaves Differently
When a plant runs short of capacity, there are really only three practical levers to pull, and each one trades off cost, speed, and risk in a different way. The mistake most plants make isn't picking the wrong lever, it's picking one before modeling how it actually performs against the specific bottleneck they have.
None of these levers is universally right. A short demand spike almost always favors outsourcing or overtime over a capital purchase you'd regret in six months. A sustained, structural increase in demand usually justifies equipment, because shift extension alone can't outrun a genuine throughput ceiling forever. The right call depends entirely on where your actual bottleneck sits and how it behaves — which is precisely what a model can show and a spreadsheet can't.
There's also a sequencing logic to how these three levers get exhausted in practice. Overtime is usually the first response because it requires no capital and can start tomorrow, but it runs into a ceiling fast as fatigue and premium labor cost erode the gain. Outsourcing extends that ceiling further without adding fixed cost, but at a per-unit price that eats into margin the longer it runs. Equipment is the lever that resets the ceiling itself, which is exactly why it deserves the most scrutiny before the capital is committed.
See which lever actually fixes your bottleneck
iFactory AI can build a working model of your line and test equipment, shift, and outsourcing scenarios against it, before you commit capital to any of them.
Why the Cost Comparison Isn't Just Price-Per-Unit
A make-versus-buy comparison on outsourcing, or a shift-versus-equipment comparison on internal expansion, is often reduced to a single number that hides more than it reveals. The real cost structure has several moving parts that behave very differently over time.
A model that only compares the headline cost per unit across the three levers will consistently favor whichever option looks cheapest in isolation, without ever showing you what happens to that number once real demand variability, quality risk, and the time value of capital are factored in.
This is precisely where a comparison built on average or per-unit numbers alone tends to mislead. Two options can show identical cost per unit on paper and still carry very different total exposure, once one of them concentrates risk in a single supplier relationship and the other spreads it across a longer capital horizon. The comparison that actually matters weighs the full structure, not just the number on the summary line.
What a Model Shows That a Formula Can't
The distinction between static capacity math and simulation isn't academic, it's the difference between a number that describes a theoretical plant and a number that describes yours.
| What You Need to Know | Static Capacity Spreadsheet | iFactory AI Simulation Model |
|---|---|---|
| Where's the real bottleneck? | Assumed fixed, based on rated speeds | Tracked dynamically as it shifts under different scenarios |
| What happens if we add a shift? | Linear extrapolation — assumes proportional output gain | Accounts for diminishing returns, fatigue, and downstream constraints |
| What if we add one machine here? | Assumes the whole line's throughput rises by that machine's rate | Shows whether the constraint actually moves elsewhere first |
| How much buffer do we need? | No visibility — buffers are sized by rule of thumb | Sized from modeled variability and queue behavior |
| What's the payback timeline? | A single static estimate with no sensitivity range | Tested across demand scenarios, showing the range of likely outcomes |
The value isn't that simulation is more sophisticated for its own sake, it's that the questions leadership actually asks — will this investment pay back, what happens if demand comes in lower than forecast, where does the constraint move if we fix this one — are questions a static formula structurally cannot answer.
How iFactory AI Builds a Model of Your Line
Rather than starting from a generic simulation template, the platform builds a discrete-event model calibrated to your actual process data, so the scenarios it tests reflect how your line really behaves.
Because the model is calibrated on your own line's real behavior rather than industry averages, the answer it produces is specific to your bottleneck, your batching rules, and your demand pattern — not a generic capacity-planning template applied to your numbers after the fact.
Delivered Ready to Run, Not as a Consulting Project
Capacity simulation has traditionally meant hiring a specialist consultant for a multi-month engagement. iFactory AI delivers it as a turnkey capability connected to your live production data, so the model stays current rather than going stale the moment conditions change.
Scope covers the cabling, network configuration, PLC and SCADA integration, and operator training, so what your team inherits is a working decision tool rather than a one-time study that's outdated by the time the next capacity question comes up. Trusted by 1000+ clients with 99.9% uptime, the deployment is built to run alongside a live plant.
What Operations Teams Ask Before Modeling a Capacity Decision
Know Which Lever Actually Fixes Your Capacity Problem
iFactory AI builds a working model of your line so equipment addition, shift extension, and outsourcing are compared on evidence — not a spreadsheet that assumes everything runs perfectly.