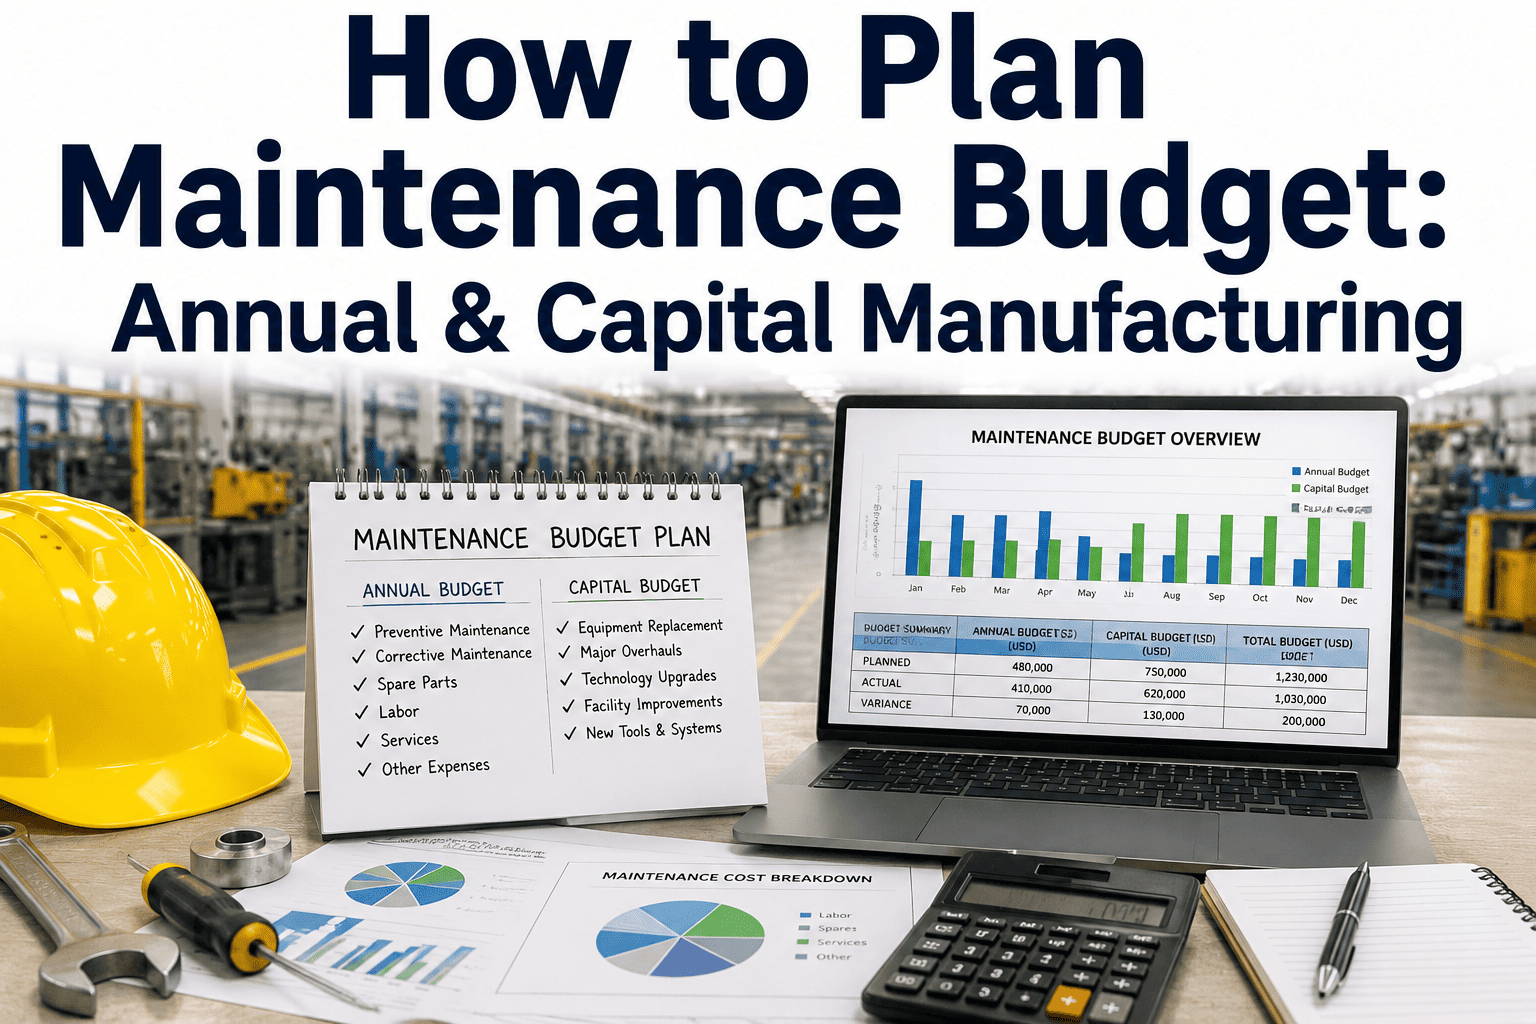
A maintenance director walks into budget season with a spreadsheet of last year's invoices and a gut feeling about what next year will cost. The CFO walks in with a model showing maintenance as the third-largest variable line item and no ROI attached to any of it. That mismatch is why so many maintenance budgets get cut to a number that looks reasonable on paper and turns out, six months later, to have cost far more in emergency repairs than the original request ever would have. iFactory's budget planning tools replace the spreadsheet-and-gut-feel approach with the asset-level cost data a finance team actually needs to say yes — and if you'd rather see it than read about it, book a demo and we'll walk through your own numbers.
Maintenance Costs → Annual & Capital Planning
Your Maintenance Budget Isn't Being Rejected Because It's Too High. It's Being Rejected Because It's Unproven.
A budget request built on last year's invoices reads as an opinion. A budget request built on asset-level cost history, planned-versus-reactive ratios, and a documented backlog reads as a business case. iFactory gives maintenance leaders the second one. Book a demo to see your own budget case built out before your next planning cycle.
Recommended Budget Split — Manufacturing Plants
60-70%
Operating Maintenance
30-40%
Capital Projects
Where to Start
Set Your Budget Ceiling With RAV, Not With a Guess
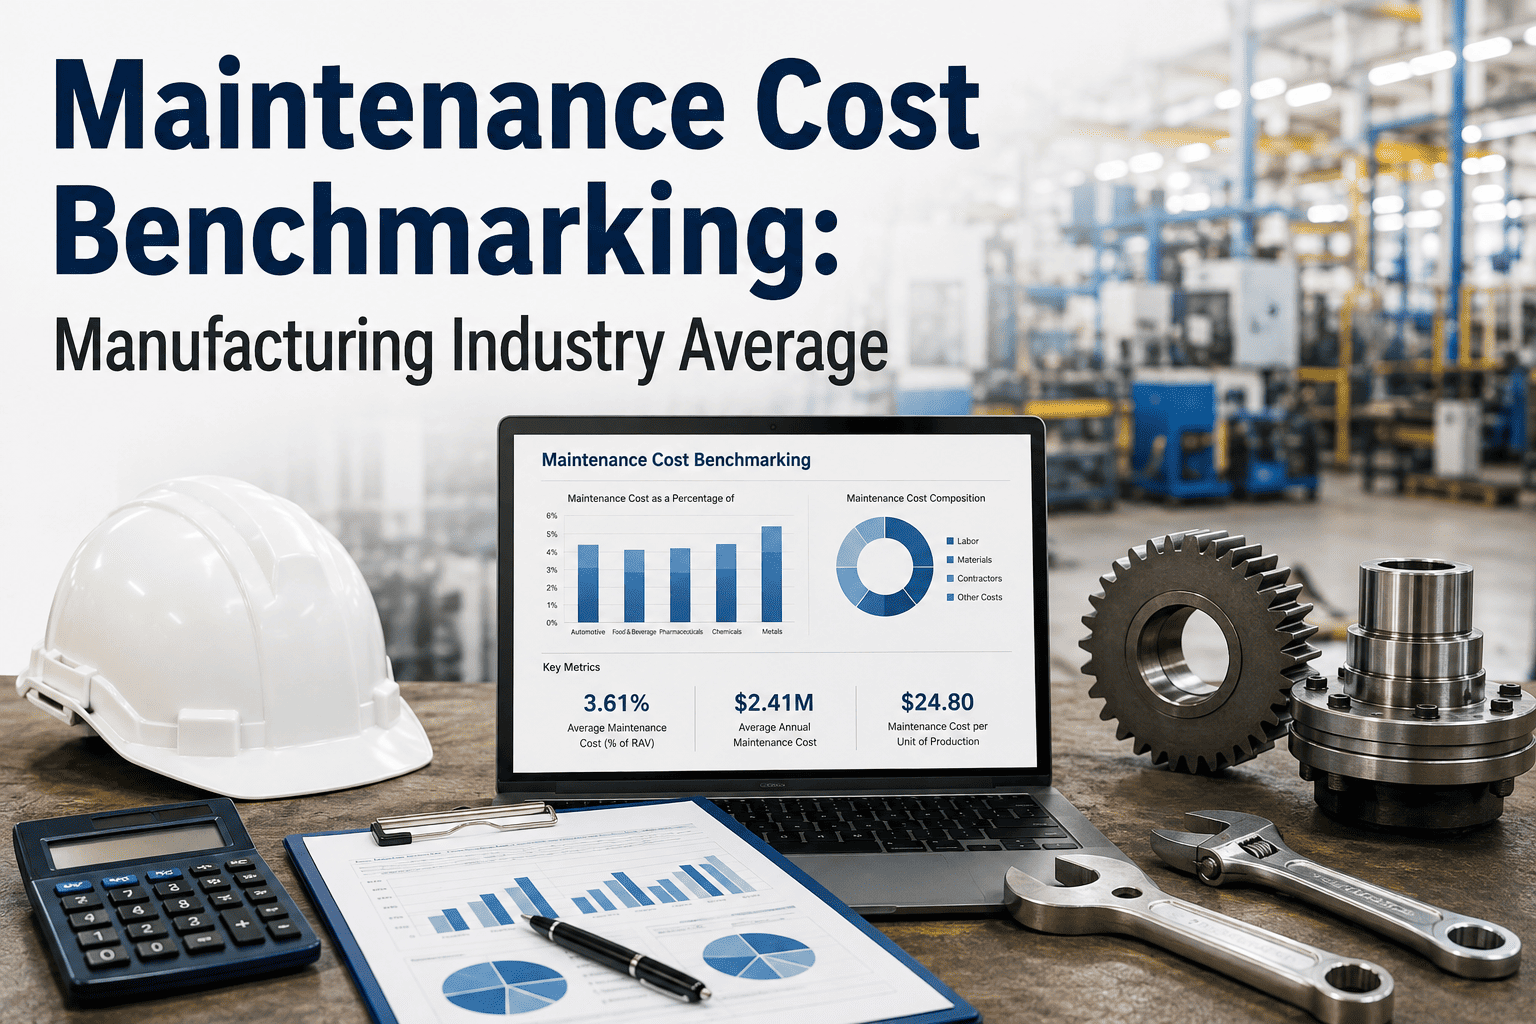
Before allocating a single line item, most reliability programs anchor the total maintenance budget to a percentage of Replacement Asset Value — the estimated cost to rebuild the entire facility's equipment base from scratch. This single number gives finance a defensible ceiling instead of a moving target. RAV as an anchor works because it scales naturally with plant size and equipment intensity in a way that a flat percentage of revenue or a simple year-over-year adjustment to last year's number never fully can — two plants with identical revenue can have wildly different maintenance needs depending on how much physical equipment they actually operate day to day.
1.5-2.5%
World-class plants with newer, well-maintained assets and mature PM programs
2-4%
Typical manufacturing plant benchmark, adjusted for equipment intensity
4-6%
Older facilities with aging infrastructure and critical, high-consequence operations
Example: a $20M RAV plant at a 3% benchmark produces a $600K annual maintenance budget ceiling — before any line-item allocation begins. The critical caveat is that the percentage is a starting ceiling, not a finished budget: a plant sitting well below its benchmark range is not necessarily running an efficient operation, it may simply be deferring cost and accumulating deterioration that has not yet surfaced as a failure. See how iFactory calculates your plant's RAV-based ceiling automatically from asset data.
OpEx vs CapEx
The Split That Determines Whether a Dollar Hits the P&L or the Balance Sheet
Every maintenance dollar falls into one of two accounting treatments, and getting this classification wrong is one of the fastest ways to lose credibility with finance. The distinction is not about how the money feels — it is a defined accounting test, and maintenance leaders who present a request already correctly split between the two categories signal to finance that the rest of the numbers were prepared with the same discipline.
Operating Expense (OpEx)
Routine labor, parts, and contracted maintenance services
Preventive maintenance program costs
Emergency and reactive repair costs
Expensed fully in the current period — reduces this year's profit immediately
Capital Expenditure (CapEx)
Equipment replacement and major overhauls
Upgrades that extend useful life or add capacity
Condition-monitoring sensor and predictive maintenance system installs
Depreciated over several years — spreads cost across the asset's useful life
Accountants apply what is often called the BAR test to decide which bucket an expense belongs in: does it deliver a Betterment to the asset's efficiency or capacity, an Adaptation to a new or different use, or a Restoration of the asset to like-new condition after significant deterioration? A yes to any of these generally points toward CapEx treatment rather than OpEx.
Project Prioritization
Not Every Capital Request Deserves the Same Urgency
When capital is limited — and it almost always is — the strongest budget presentations sort every deferred item onto a simple matrix before asking for money. This turns the leadership conversation from "why do you need more" into "here is the most efficient allocation of what we have." The matrix itself is deliberately simple by design — the discipline it enforces, not its sophistication, is what makes it persuasive to a finance audience that reviews dozens of competing requests every budget cycle.
Fund First
High Probability / High Impact
Assets already showing degradation signals on equipment where failure stops production. These are the items that justify emergency or off-cycle capital approval, and they should arrive at the budget meeting with condition data attached, not just a verbal warning.
Plan Into Next Cycle
Low Probability / High Impact
Low current failure risk but severe consequence if it happens. Belongs in the standard capital planning cycle with condition monitoring in the interim, since the goal here is early visibility rather than immediate spend.
Address Opportunistically
High Probability / Low Impact
Frequent but low-consequence issues. Often best bundled into routine PM rather than requesting standalone capital, since the cumulative annoyance rarely justifies the administrative overhead of a separate capital line.
Monitor, Defer
Low Probability / Low Impact
The lowest-priority tier. Defer without material risk, and revisit only if the probability or impact score changes — spending capital here almost always represents a worse allocation than leaving it available for the top-left quadrant.
Beyond One Year
Why a Single-Year Budget Always Loses to a Five-Year Capital Forecast
A budget that only looks twelve months ahead forces every major replacement decision into a reactive scramble the year it finally becomes unavoidable. A rolling multi-year capital forecast changes that dynamic entirely, and it is one of the more persuasive documents a maintenance leader can bring into a finance conversation.
Smooths Capital Spend
Instead of three major replacements colliding in the same fiscal year purely by coincidence of when the equipment happened to age out, a five-year view lets finance spread capital outlay more evenly across budget cycles.
Uses Condition Data, Not Just Age
Two identical assets installed the same year can have very different remaining useful life depending on duty cycle, environment, and maintenance history. A forecast built on condition scoring rather than calendar age avoids replacing healthy assets early or holding failing ones too long.
Converts Surprises Into Line Items
A major asset replacement that finance sees for the first time during the current budget cycle reads as an emergency. The same replacement, visible on a rolling forecast for the prior two years, reads as planned execution — a very different conversation.
Building this forecast does not require predicting the future with precision finance will never fully trust anyway. It requires an honest asset register with install dates, current condition scores, and a documented replacement trigger for each critical asset — the same underlying data that powers the RAV benchmark and the prioritization matrix above, reused for a longer time horizon. Plants that maintain this register as a living document, updated as condition assessments happen rather than reconstructed once a year under deadline pressure, consistently produce forecasts that hold up better under finance scrutiny than those assembled in the final weeks before a budget submission.
See Your Own Backlog Sorted Onto This Matrix
A prioritization matrix is only as useful as the data behind it. iFactory pulls real asset condition and failure history to sort your actual backlog — not a hypothetical one.
Inside the OpEx Line
Labor Is Usually the Largest Single Category — Here Is How to Defend It
Labor typically consumes the largest share of any maintenance operating budget, and it is also the category finance scrutinizes hardest because headcount decisions carry visible, recurring cost. Defending a labor budget requires separating three distinct questions that often get blurred into one general "we need more people" request during budget season.
Are We Staffed for Planned Work?
Calculate the labor hours required to execute the current PM schedule at full compliance, then compare against actual available wrench-turning hours after accounting for training, meetings, and travel time between jobs. A gap here is a straightforward staffing case.
How Much Are We Paying in Overtime Premiums?
Overtime driven by reactive work is functionally a hidden tax on the labor budget. Separating planned overtime — such as a scheduled shutdown — from reactive overtime caused by emergency repairs makes visible exactly how much the reactive-to-planned ratio is costing in premium labor alone.
Are We Buying Contractor Capacity We Could Build In-House?
Recurring contractor spend on the same specialized task, tracked over several years, often crosses the cost threshold where training or hiring an in-house specialist becomes the cheaper long-term option — a comparison that is invisible without multi-year contractor cost history.
Each of these three questions produces a different kind of budget request — a headcount addition, a process fix, or a make-versus-buy decision — and conflating them into a single "increase the labor line" ask makes the request harder for finance to evaluate on its own merits. Separating them also tends to produce a smaller, more targeted ask than the original blended request, which paradoxically improves the odds of approval even though the underlying need has not changed.
What Happens Without This
The $600K Cut That Cost $800K More
A manufacturing facility submitted a $1.8M maintenance budget request. Leadership cut it to $1.2M because the maintenance director could not explain why labor costs had risen 22% year over year, could not point to which specific equipment would fail without the requested PM schedule, and had no data proving that emergency repairs actually cost multiple times more than planned work.
Budget Season
Request cut from $1.8M to $1.2M — no line-item pushback possible without supporting data
Month 6
Three unplanned equipment failures cost $680,000 combined in downtime and emergency repairs
Month 6
PM backlog grows to 847 overdue tasks; team requests a $400K supplemental budget mid-year
Year End
Total actual spend: $1.6M plus operational cost of failures — the $600K "savings" cost $800K more than the original request
The failure here was not the cut itself — leadership is entitled to scrutinize spending. The failure was that the original request had no data to make scrutiny productive. A budget backed by asset-level cost history and a documented backlog risk score changes that conversation entirely, because it moves the discussion from a negotiation over trust to a review of evidence. Finance teams are not trying to underfund maintenance out of malice; they are trying to allocate scarce capital across every department making a request, and the departments that show up with the strongest evidence tend to fare best regardless of how much any individual reviewer personally sympathizes with the underlying need. The same asset-level data that would have prevented this cut is exactly what turns next year's budget conversation into a review of evidence rather than a negotiation over trust.
Health Check
Three Ratios That Tell You If Your Current Budget Is Actually Healthy
Labor Above 50% of Budget
Often signals a reactive-heavy operation, where emergency overtime is quietly inflating hourly labor costs above what a planned schedule would require. This ratio tends to creep upward gradually, which makes it easy to miss without a quarterly review specifically looking for the trend.
Parts Spend Above 35%
May indicate poor PM scheduling — reactive parts purchases typically carry a 15-30% emergency premium over the same parts ordered on a planned cycle, on top of the expedited shipping costs that rushed orders almost always incur.
Zero Contingency Reserve
Is not lean budgeting. It is deferred maintenance risk waiting to surface as a mid-year supplemental request during peak production, which is precisely the moment a supplemental request is hardest to get approved quickly.
Every ten-point shift toward planned work over reactive work tends to reduce total maintenance program cost by roughly 5-8%, as expedited parts, emergency premiums, and secondary damage all decline together. iFactory tracks this ratio automatically and flags it before it becomes a budget problem.
Common Mistakes
Where Budget Requests Lose Credibility Before Finance Even Reads the Total
01
Estimating from a flat percentage of revenue.
Revenue has no direct relationship to how many assets a plant maintains or how old they are. A budget anchored to actual cost history and RAV is far harder to argue with than one anchored to a formula finance can immediately see is disconnected from operational reality.
02
Blending OpEx and CapEx into one number.
Finance teams need the two treated separately for tax and reporting purposes. A budget that mixes them forces the reviewer to do that separation manually, which slows approval and invites the kind of line-by-line scrutiny that could have been avoided.
03
Presenting cost without consequence.
"$200K for additional PM labor" is a cost. "$200K in PM labor that raises compliance from 72% to 90% and is projected to prevent $1.3M in downtime" is a business case. The gap between those two sentences is usually the entire gap between approval and rejection.
04
Treating the budget as static once approved.
A budget set once a year and never revisited cannot absorb the kind of unplanned failure that will inevitably occur. Monthly review against actuals, with a documented process for mid-year revision, keeps the annual number honest rather than aspirational.
05
Requesting capital without a decommissioning or disposal plan.
A replacement request that only accounts for the cost of the new asset, without addressing what happens to the old one — resale value, disposal cost, or transitional downtime during the swap — presents an incomplete financial picture that a careful finance reviewer will notice and ask about, often stalling approval while the gap gets filled in. Addressing this upfront, even briefly, signals a level of completeness that speeds review rather than inviting it.
Common Questions
Maintenance Budget Planning — Frequently Asked Questions
How do I calculate a defensible maintenance budget for a manufacturing plant?
Start with three years of actual work order cost history broken down by category, apply a corrective maintenance reserve ratio — typically 40-100% of planned PM cost, depending on asset age and criticality — add all contracted services, and layer in capital replacement requirements pulled from an asset lifecycle register. Avoid estimating from a flat percentage of revenue alone; actual historical cost data, benchmarked against a percentage of Replacement Asset Value, produces a far more defensible number. This approach also naturally surfaces category-level anomalies — a sudden spike in one asset class' repair cost, for instance — that a top-down revenue-percentage estimate would never reveal.
iFactory pulls this cost history automatically from existing work order data rather than requiring a manual spreadsheet reconstruction.
What is the real difference between OpEx and CapEx in a maintenance budget, and why does it matter so much?
OpEx covers recurring costs expensed immediately in the current period — labor, parts, and routine contractor services — which reduces this year's reported profit right away. CapEx covers investments that create future benefit beyond the current year, and is instead capitalized and depreciated over the asset's useful life, which is generally viewed more favorably by finance because it spreads cost over time rather than hitting earnings immediately. Keeping the two cleanly separated in a budget request is not just an accounting formality; it materially affects how quickly and how favorably a request gets reviewed.
How should a plant decide between repairing an aging asset again versus replacing it with capital?
Track the crossover point where an asset's rising annual maintenance cost approaches or exceeds the annualized cost of replacement — a commonly used threshold is when annual maintenance cost on a single asset exceeds roughly 20-25% of its full replacement value. Below that threshold, continued repair investment is usually the more economical path; above it, the numbers typically favor planned replacement rather than continuing to fund an asset in decline. This threshold works best as a flag for deeper review rather than an automatic trigger, since a single unusually expensive repair year does not necessarily indicate a structural decline in the asset's condition.
Book a demo to see this crossover calculated automatically per asset from your own maintenance history.
What is a healthy contingency reserve to include for unplanned repairs?
Most reliability programs build a corrective maintenance reserve equal to a substantial share of the planned PM budget — commonly cited ranges run from 40% up to full parity with planned spend, depending on how mature the PM program already is and how much of the current failure rate is still reactive rather than planned. A reserve set at or near zero is not evidence of an efficient budget; it typically indicates deferred maintenance risk that has simply not yet surfaced as a mid-year supplemental request. As the planned-to-reactive ratio improves over successive budget cycles, the required reserve as a percentage of planned spend should trend downward — a useful secondary signal that the underlying reliability program, not just the budget document, is actually maturing.
How often should a maintenance budget actually be revisited once it is approved?
The annual budget is typically set during the fiscal year planning cycle but should be reviewed monthly against actual spend, with a clear, pre-agreed process for mid-year revision when major unplanned repairs or capital decisions materially shift the full-year cost trajectory. Treating the annual number as fixed rather than as a living forecast is one of the more common reasons budgets end up requiring an unplanned supplemental request later in the year.
Bring Data to Your Next Budget Meeting, Not Last Year's Invoices
iFactory turns your asset history into the cost breakdowns, planned-versus-reactive ratios, and backlog risk scores that finance teams actually approve. See what your own budget case looks like before you walk into the room.