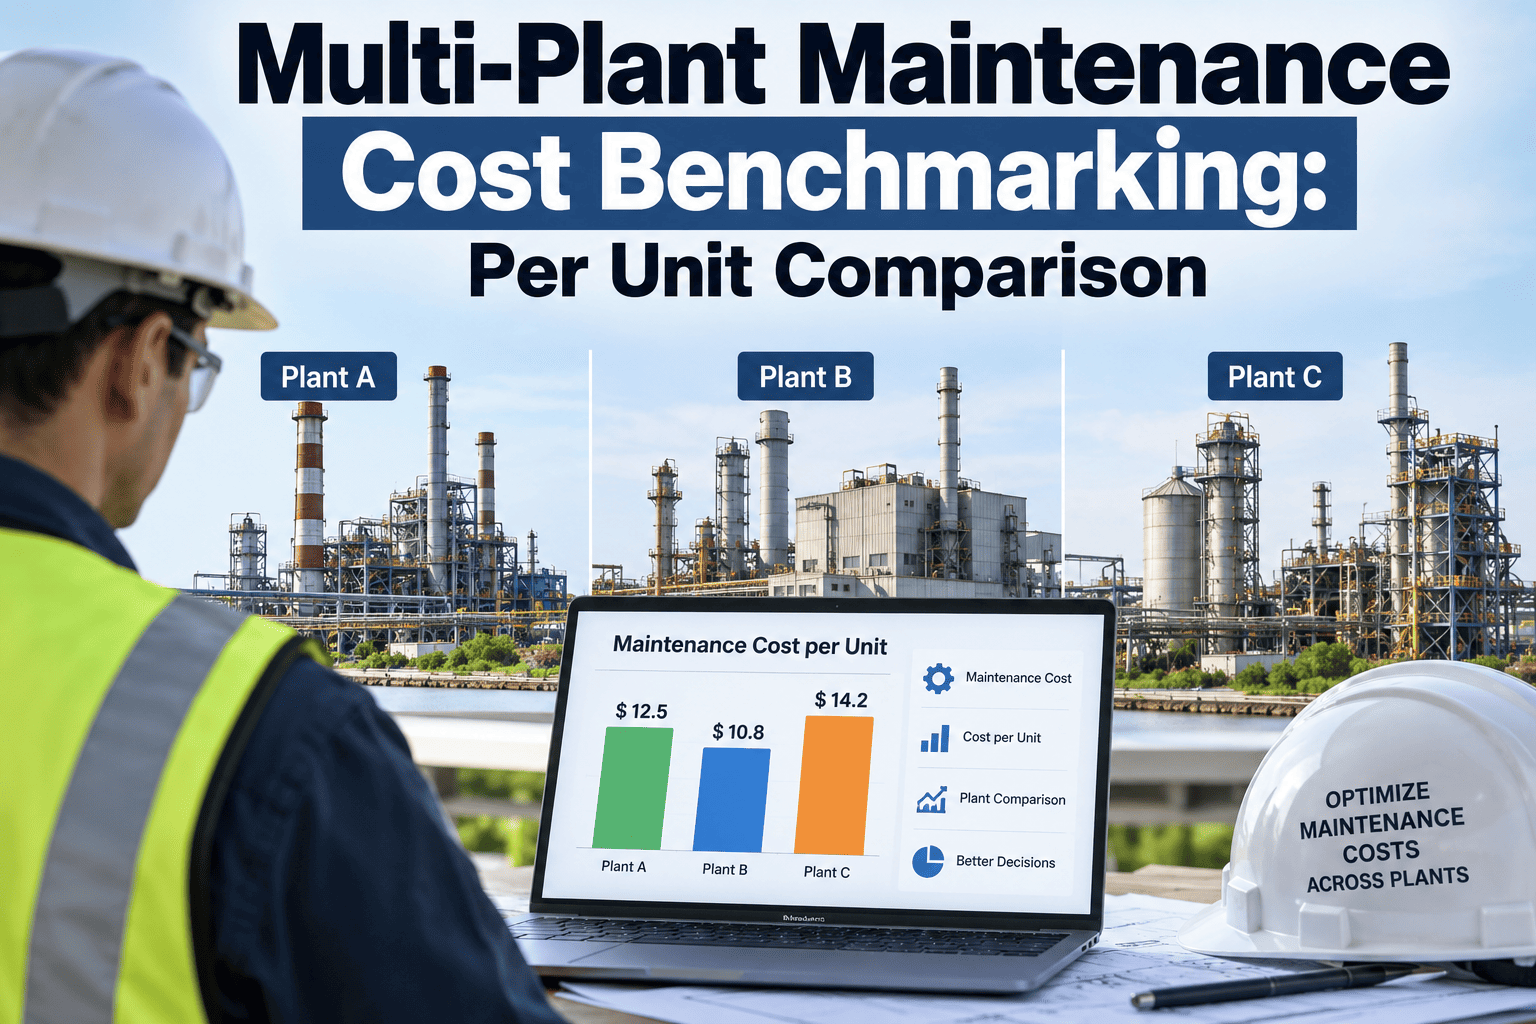
Two plants in the same manufacturing group can both report maintenance spending that looks reasonable on its own, and still be wildly different in efficiency, because a raw dollar figure says nothing about how much output that spending actually supported. Normalizing maintenance cost against production volume, expressed as cost per unit, is what turns an otherwise meaningless comparison between a high-volume plant and a low-volume one into something genuinely useful. Once that normalized number exists across every site, patterns emerge quickly: one plant might be spending far more per unit than its sister facilities simply because it never moved past reactive maintenance, while another has quietly built a leaner, more disciplined program worth studying. Groups ready to build this kind of normalized cost comparison can talk it through with iFactory's support team.
"We Spent $2.1 Million on Maintenance" Means Nothing Without a Number Next to It
iFactory normalizes every plant's maintenance spend against its actual production volume, so a raw dollar figure finally becomes a per-unit cost you can compare fairly across your entire network.
Why Raw Maintenance Spend Is a Meaningless Number on Its Own
A plant manager reporting a maintenance budget without context is reporting a fact that says nothing about efficiency, and comparing two plants' raw spend without normalizing for output volume is comparing apples to a completely different orchard.
High-Volume Plants Look Artificially Expensive
A plant running three shifts and higher throughput naturally spends more in absolute dollars, even if its per-unit efficiency is actually the best in the group.
Low-Volume Plants Look Artificially Efficient
A quieter plant's modest total spend can mask a genuinely poor per-unit ratio once its lower output is factored in properly.
Category Breakdown Rarely Gets Compared at All
Even when total spend is normalized, few groups break the number down into labor, parts, and contractor cost to see exactly where one plant's efficiency advantage actually comes from.
Reactive Spend Hides Inside the Same Line Item
Emergency repair cost and planned maintenance cost often get lumped into one total, obscuring exactly how much of a plant's spend is firefighting versus prevention.
The Right Way to Normalize Maintenance Spend Across Plants
A defensible cost comparison depends on choosing the right denominator and breaking total spend into categories that reveal where the real differences between plants actually live.
| Normalization Method | Best Used For | Limitation |
|---|---|---|
| Cost per Unit Produced | Comparing plants with similar product types | Distorted by product mix complexity differences |
| Cost as % of Replacement Asset Value | Comparing plants with different products entirely | Requires an accurate, updated asset valuation |
| Cost per Machine Hour | Comparing utilization-heavy operations | Less intuitive for non-technical stakeholders |
| Cost per Employee Hour | Comparing labor-intensive processes | Can undervalue capital-intensive automation gains |
Turning a Cost Gap Into a Specific Improvement Target
Identifying that one plant spends more per unit than its sister sites is only the starting point; the real value comes from breaking that gap down into a specific, closeable cause.
Normalize Every Plant on the Same Basis
Choosing one consistent denominator, whether unit output or replacement asset value, and applying it identically across the group.
Break Down the Gap by Spend Category
Separating labor, parts, and contractor cost reveals whether a high per-unit number comes from overtime, expedited freight, or something else entirely.
Check the Planned-to-Reactive Ratio
A plant spending more per unit is frequently doing so because reactive, emergency work dominates its maintenance activity.
Set a Specific, Time-Bound Cost Target
A vague instruction to "reduce cost" rarely moves the number; a specific per-unit target with a review date usually does.
Turn Raw Maintenance Spend Into a Number You Can Actually Compare
iFactory normalizes maintenance cost per unit across every plant and breaks the spend down by category, so a gap becomes a specific, closeable improvement target.
A Composite Scenario: The Plant That Looked Cheap Until the Math Changed
A four-plant manufacturing group had long assumed its smallest facility ran the leanest maintenance program in the network, based on its consistently modest annual maintenance budget compared to the three larger sites. A normalized cost-per-unit analysis told a different story once actual production volume was factored into the comparison.
The smallest plant's lower absolute spend was simply a function of running far less volume than its sister facilities, and once normalized, its cost per unit was actually the highest in the group, driven by a planned-to-reactive maintenance ratio well below the other three sites. The group redirected a planned budget increase originally intended for its largest facility toward the smallest plant's reliability program instead, specifically targeting its reactive maintenance rate, and within a year that plant's per-unit cost had dropped to align with the group average.
Common Mistakes in Multi-Plant Cost Benchmarking
Comparing Raw Dollars Without Normalizing
Two plants with very different output volumes simply can't be compared fairly on total spend alone.
Ignoring Product Mix Complexity
A plant running a highly varied product mix will naturally show higher per-unit maintenance cost than one running a single simple product, and that context matters in the comparison.
Never Breaking Spend Into Categories
A single total spend number hides whether the real driver is labor, parts, or reactive emergency work, each of which needs a different fix.
Using Stale Asset Valuations
A replacement asset value figure left unupdated for years produces a normalized ratio that no longer reflects the plant's actual asset base.
Is Your Group Ready to Normalize Maintenance Cost Across Plants
Every plant tracks production volume reliably
Accurate unit output data is the essential denominator any per-unit comparison depends on.
Maintenance spend is categorized, not just totaled
Labor, parts, and contractor cost broken out separately makes any gap actionable rather than just observable.
Replacement asset value is current for every plant
An outdated valuation undermines any comparison built on the percentage-of-RAV method.
Leadership is prepared to redirect budget based on the finding
The exercise only pays off if a revealed gap actually changes where investment goes next.
Frequently Asked Questions
What's the difference between cost per unit and cost as a percentage of replacement asset value?
Cost per unit normalizes maintenance spend against how much a plant actually produced, making it useful for comparing plants that make similar products at different volumes. Cost as a percentage of replacement asset value instead normalizes against the size of the plant's physical asset base, which works better when comparing plants making entirely different products, since it doesn't depend on counting comparable units at all. Many groups track both, since each reveals a different dimension of efficiency. Groups deciding which method fits their network can talk to iFactory support.
How do we fairly compare plants that make very different products?
Cost as a percentage of replacement asset value generally works better than cost per unit when products differ significantly, since it removes the need to define a comparable "unit" across dissimilar product lines. Even then, some judgment is needed to account for genuine differences in process complexity, and many groups supplement the ratio with a qualitative review of why a plant's number sits where it does before drawing firm conclusions.
Why would a plant with a lower total maintenance budget actually be less efficient?
A low total budget only reflects genuine efficiency once it's compared against how much that plant actually produced or how large its asset base is. A smaller plant naturally spends fewer absolute dollars simply because it has less to maintain and less output to support, and that smaller number can still represent a worse per-unit ratio than a larger plant spending considerably more in total but producing proportionally far more output.
What's the fastest way to identify which spend category is driving a plant's high per-unit cost?
Start by checking the planned-to-reactive maintenance ratio, since reactive, emergency work is consistently the single biggest driver of excess per-unit cost across most manufacturing plants, typically showing up as overtime labor, expedited parts freight, and unplanned production loss combined. Book a demo to see how a category breakdown gets built around your specific plants' spend data.
How often should multi-plant cost benchmarking be updated?
Monthly tracking gives leadership an early view of drift before it becomes a significant annual variance, while a deeper quarterly review comparing categories and root causes across plants is usually where the most actionable insight actually emerges. Waiting for an annual budget cycle to run this comparison means a full year can pass before a real inefficiency gets identified and addressed.
Give Every Dollar of Maintenance Spend a Number You Can Actually Compare
iFactory normalizes maintenance cost across your whole plant network, turning raw spend into a per-unit benchmark that drives real improvement decisions.