Roughly 80% of loom stops trace back to mechanical wear on air jets, grippers, and reeds, yet most weaving mills still discover which loom is dragging down efficiency by watching the shift report at the end of the day rather than catching the pattern as it develops. Top-performing mills consistently run at 92% loom efficiency or higher, not because their machines are newer, but because they track breaks per hour and minutes per stop on every loom continuously and act on the pattern immediately. Downtime analytics software turns that raw stop data into a clear picture of exactly which looms, shifts, and stop types are costing you the most production. Mill managers can book a demo to see live loom downtime analytics running on real weaving floor data.
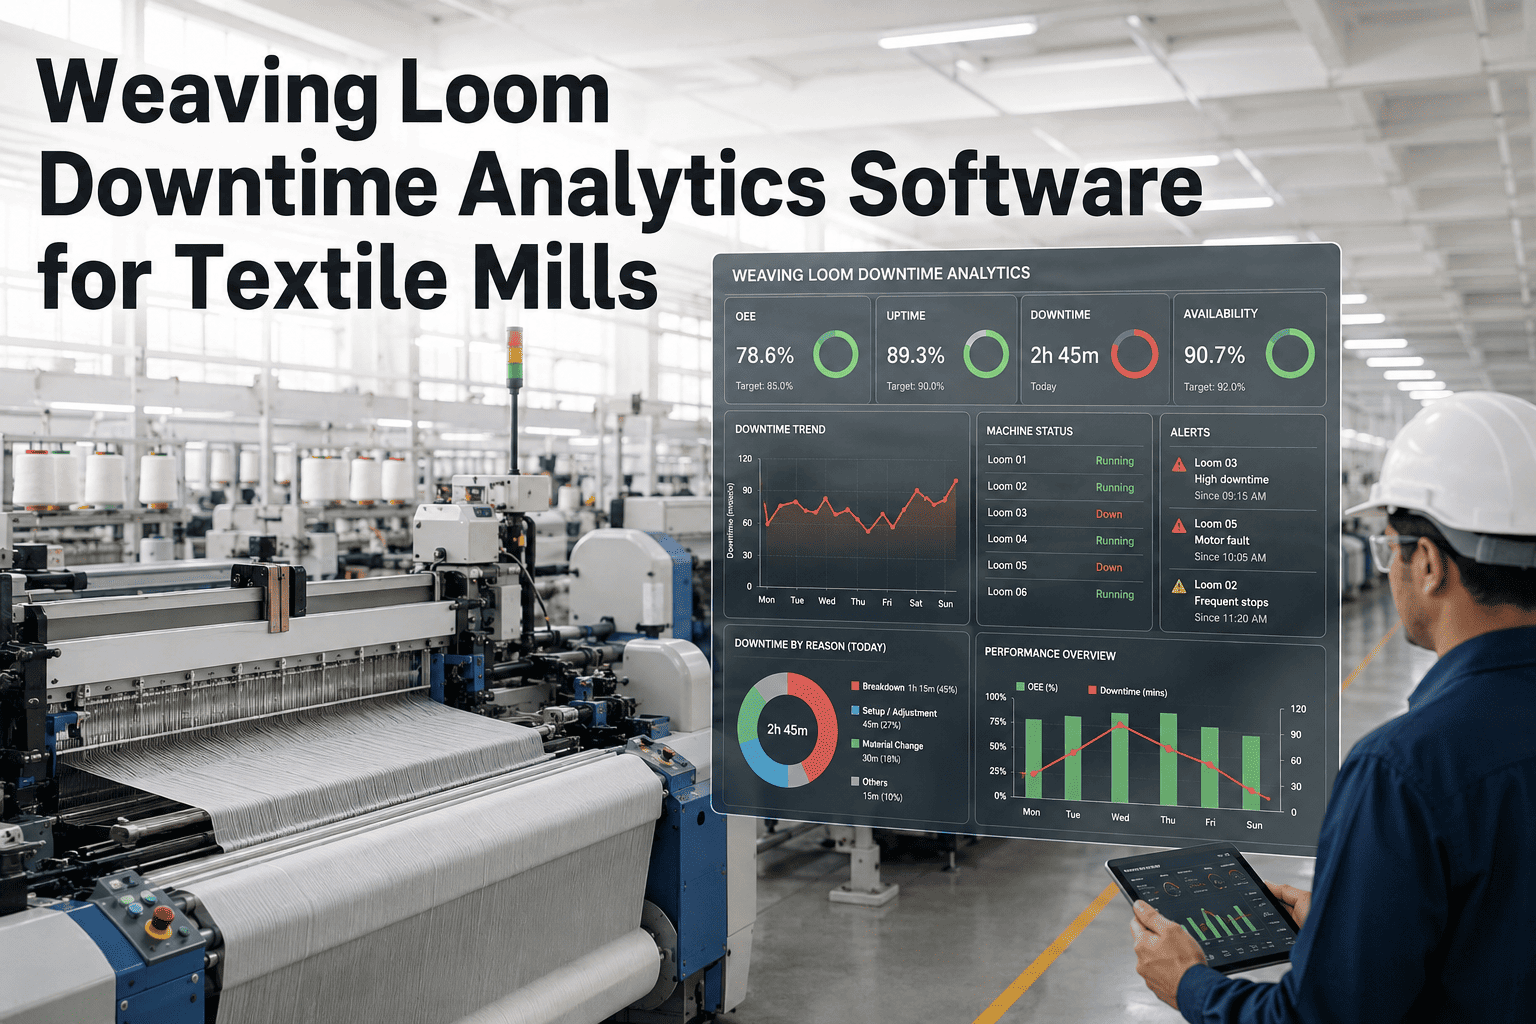
TEXTILE MANUFACTURING · WEAVING LOOM DOWNTIME ANALYTICS
Know Exactly Which Loom Is Costing You Production
Continuous downtime analytics tracks breaks per hour and minutes per stop across every loom, surfacing the specific machines, shifts, and stop types dragging down your efficiency.
80%
Of loom stops caused by mechanical wear on air jets, grippers, and reeds
92%+
Loom efficiency consistently achieved by top-performing weaving mills
25-30%
Typical downtime reduction after mills adopt structured, data-driven maintenance
The "Stop vs. Slow" Problem Most Mills Miss
A loom stop from a warp or weft break is obvious, everyone on the floor notices when a machine goes idle. What's harder to catch is a loom running five percent slower than the rest of the line, a silent efficiency killer that never shows up as a stoppage but quietly erodes output all shift long. Downtime analytics tracks both, comparing machines running the same style side by side to flag the underperformer before it becomes a pattern nobody questions.
Where the Downtime Actually Comes From
1
Warp & Weft Breaks
The most frequent and most visible stop type, directly tied to yarn quality and tension settings.
2
Air Jet & Gripper Wear
Mechanical wear on insertion components accounts for the majority of stop time across most fleets.
3
Beam Change & Setup Time
Knotting and gaiting during beam changes is a major, often uncounted, source of changeover loss.
4
Lint & Dust Buildup
Poor cleaning schedules let lint accumulate, causing micro-stops that individually seem minor but add up fast.
Loom Efficiency Benchmarks by Mill Tier
| Mill Tier |
Typical Loom Efficiency |
Maintenance Approach |
| Bottom Quartile |
Below 75% |
Informal, operator-driven schedules |
| Average Mill |
80-88% |
Fixed preventive maintenance intervals |
| Top-Performing Mill |
92%+ |
Continuous data-driven monitoring |
TEXTILE MANUFACTURING · DOWNTIME ANALYTICS
See Which of Your Looms Are Losing You Production
Get a walkthrough of downtime analytics running against your own weaving floor data.
We always assumed our looms were roughly the same, until we saw the data side by side and realized three machines running the same style were losing us hours a week nobody had flagged. Once we could see it broken down by loom and by stop type, fixing it was straightforward. The hard part had always been knowing where to look.
Weaving Floor Manager, Textile Mill
Is Your Weaving Floor a Strong Fit
Efficiency Below 88%
Mills running below top-tier efficiency typically have the most to gain from visibility into stop patterns.
Multiple Loom Types in One Facility
Air-jet, rapier, and projectile looms all benefit from comparing performance on the same style.
Downtime Tracked Only Manually
Mills still logging stops on paper see the fastest improvement once data is captured automatically.
Frequently Asked Questions
TEXTILE MANUFACTURING · DOWNTIME ANALYTICS
Turn Loom Stop Data Into a Clear Action Plan
Get a personalized walkthrough of downtime analytics for your weaving floor.