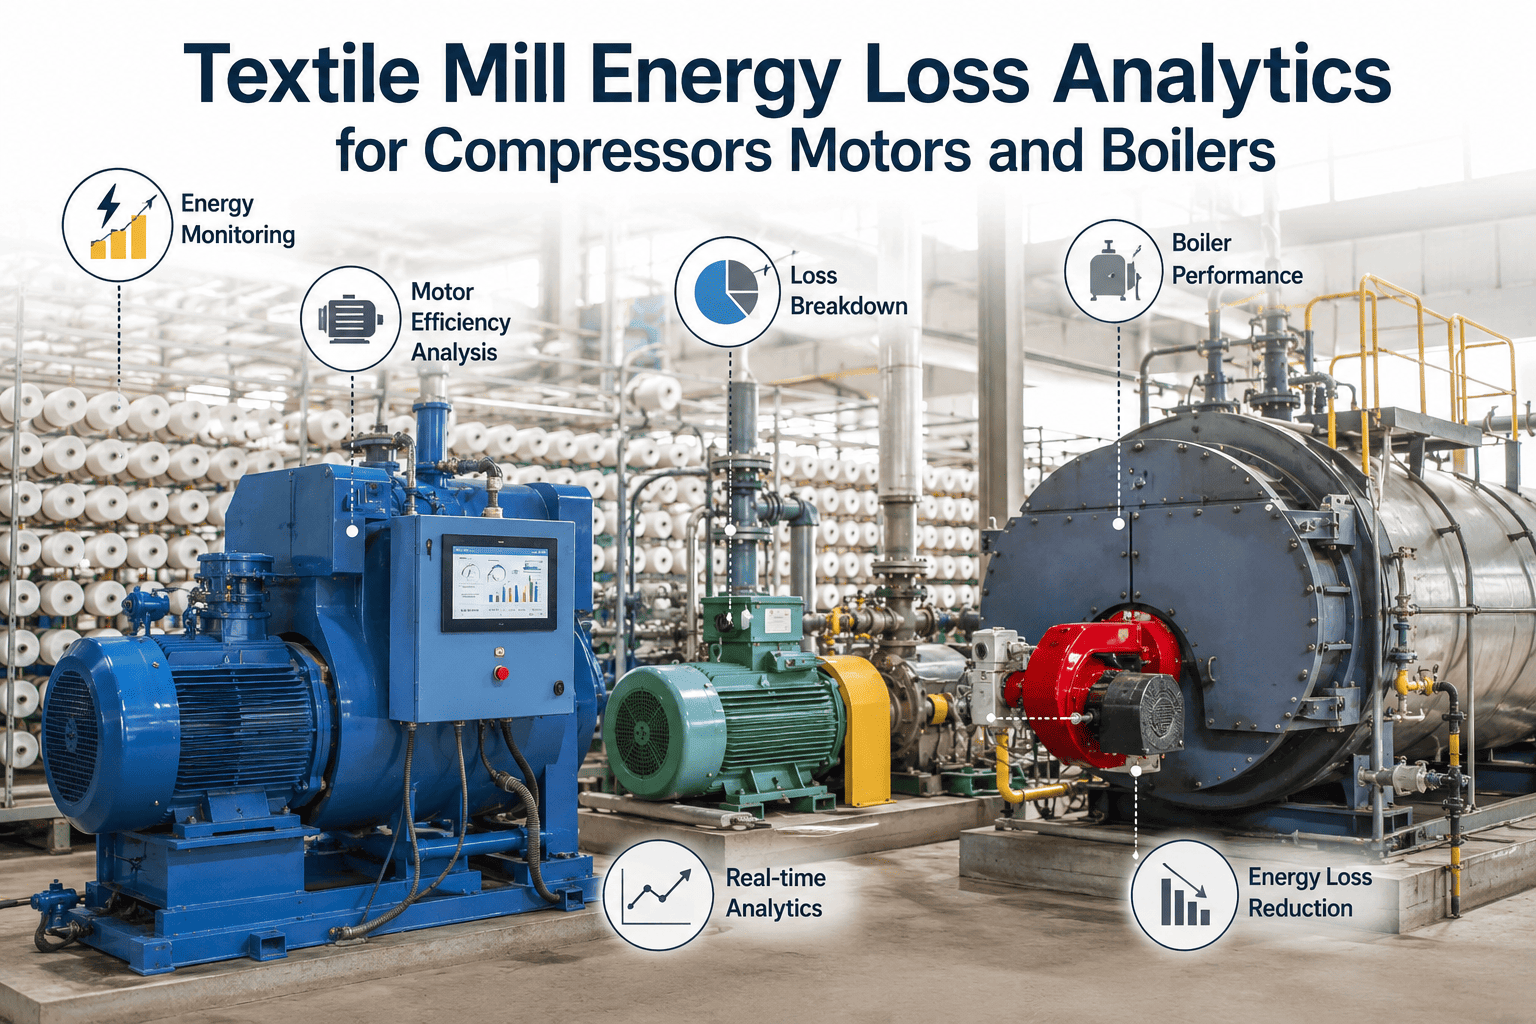
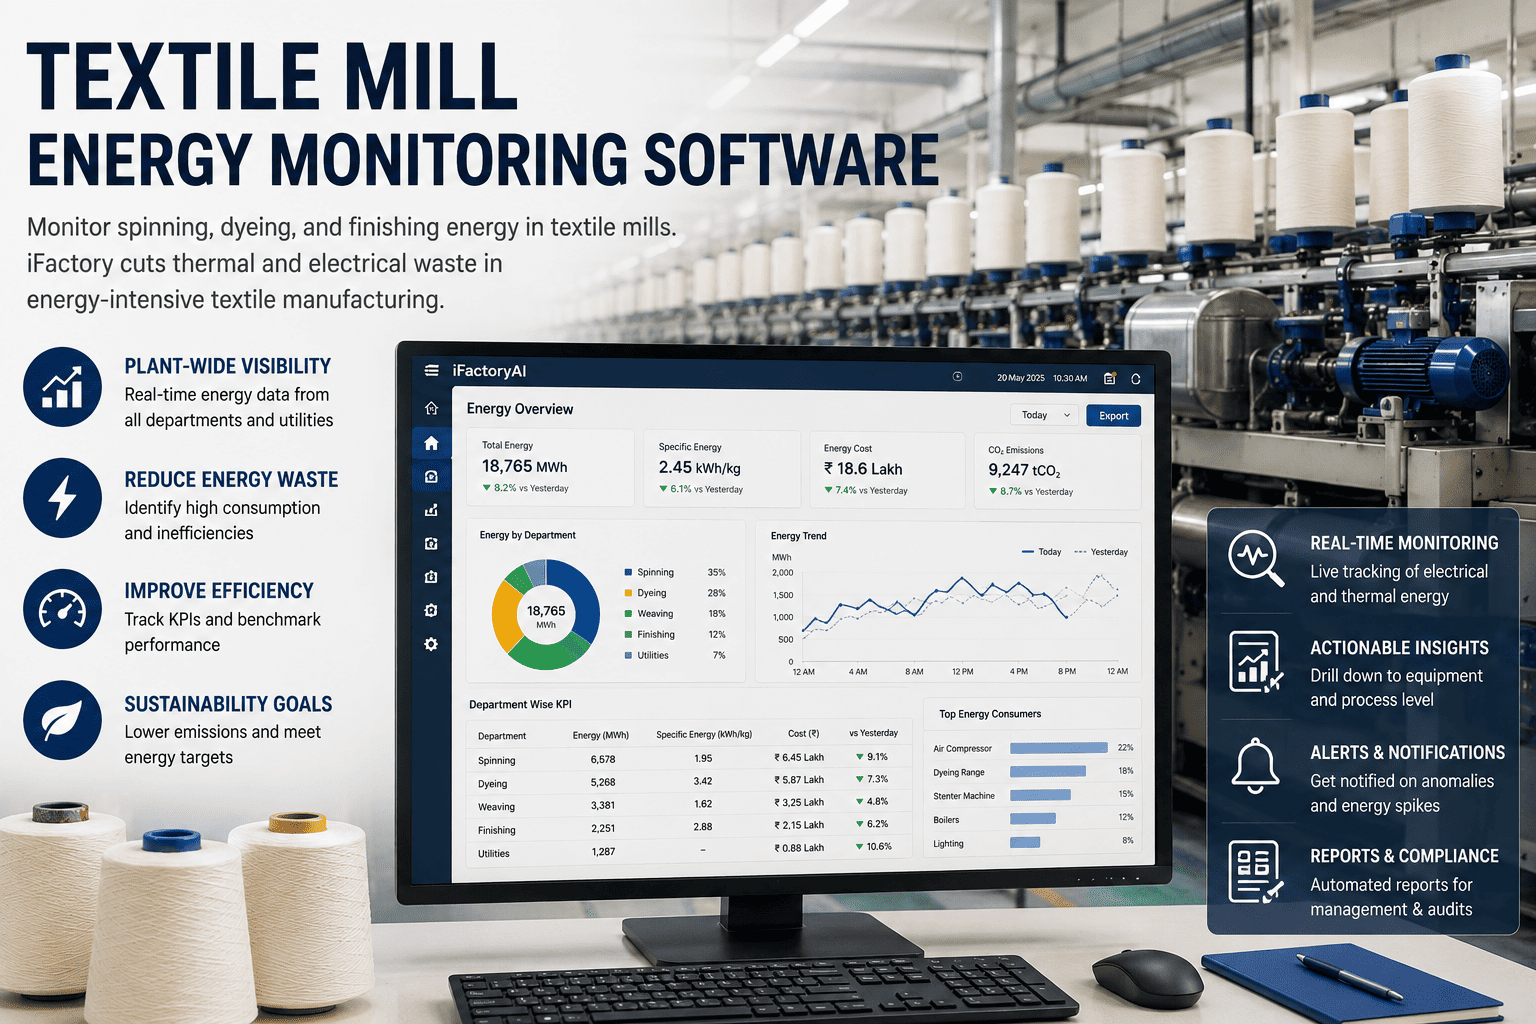
A textile mill's electricity bill rarely comes with a breakdown of where the waste actually happened — it just arrives 30% higher than the plant manager expected, again. Compressed air leaks alone typically waste 20-30% of generated air in an average mill, motors run at partial load all shift because they were sized for peak demand rather than actual draw, and boiler efficiency drifts down for months before anyone notices the fuel bill creeping up. None of this shows up as a single alarm. It shows up as margin quietly disappearing into utility costs that finance keeps asking production to explain. iFactory tracks energy consumption at the equipment level — compressor, motor, boiler, dye jet — and flags exactly where and when losses are happening, in numbers your team can act on the same day. Book a free energy loss assessment for your mill.
Quick Answer
iFactory monitors compressors, motors, and boilers across your textile mill in real time, detecting compressed air leaks, motor overload or underload conditions, and boiler efficiency drift before they compound into a large utility bill. Mills typically recover 12-18% of energy spend within the first two quarters of deployment.
Where the Money Actually Leaks Out
Energy loss in a textile mill is rarely one big failure — it is many small, continuous losses stacking up across every shift. Here is roughly how a typical mill's avoidable energy waste breaks down by source.
Motor Partial-Load Inefficiency
Idle Equipment Left Running
Approximate distribution of avoidable energy waste across a typical composite textile mill, based on industry utility audits.
See Where Your Mill's Energy Spend Is Actually Going
iFactory's assessment reviews your existing meters and utility bills to show which equipment class is costing you the most before any hardware is installed.
How iFactory Monitors Each Equipment Class
Compressors, motors, and boilers each waste energy in different ways, so iFactory applies a different detection model to each rather than a single generic "energy monitoring" dashboard. See the models applied to your specific equipment list.
01Compressed Air Systems
iFactory tracks compressor load percentage, discharge pressure stability, and specific power (kW per 100 CFM) continuously, flagging leak signatures from pressure drop patterns during non-production hours when no air should be flowing at all. Ultrasonic leak survey data can be layered in to pinpoint leak locations down to the fitting.
02Motors & Drives
Current, voltage, and power factor are monitored per motor to detect sustained partial-load operation, a common condition on oversized motors driving looms, spinning frames, or blowers. iFactory flags candidates for variable frequency drive retrofits based on actual load profiles rather than nameplate assumptions.
03Boilers & Thermal Systems
Stack temperature, excess oxygen, and fuel-to-steam ratio are tracked against the boiler's design baseline, detecting the slow efficiency drift caused by scaling, burner wear, or insulation degradation before the fuel bill shows a visible jump.
04Dye House & Process Heat
Dye jet heating cycles and steam consumption per batch are compared against recipe standards, identifying batches running longer heat-up times than necessary due to fouled heat exchangers or incorrect recipe parameters.
iFactory vs Traditional Energy Monitoring Tools
Standalone sub-metering, building management systems, and generic energy dashboards can show you consumption. Few are built to explain why a specific machine is wasting energy in a way your maintenance team can act on. Compare against your current metering setup.
| Capability | iFactory | Sub-Metering Only | Generic BMS Dashboard | Manual Utility Audit |
|---|
| Detection Depth |
| Equipment-level root cause, not just kWh totals | Root cause identified | Consumption only | Aggregated view | Point-in-time only |
| Compressor leak signature detection | Continuous, automatic | Not available | Not available | Annual survey only |
| Frequency & Timeliness |
| Real-time drift detection vs annual review | Continuous | Depends on review cadence | Depends on review cadence | Once or twice yearly |
| Action & Reporting |
| Auto-flagged maintenance action per finding | Included | Not available | Not available | Manual report only |
Based on publicly available product documentation as of Q2 2026. Verify current capability with each vendor before procurement decisions.
Our Numbers
12-18%
Energy Spend Recovered in First Two Quarters
38%
Of Waste Traced to Compressed Air Leaks
6 wks
To Full Equipment-Level Visibility
Zero
New Hardware Needed for Most Existing Meters
Stop Waiting for the Utility Bill to Tell You Something's Wrong
iFactory's pre-deployment assessment identifies your highest-loss equipment before any commitment is made.
What Our Clients Say
"We had sub-meters on our compressor house for years and could see total consumption go up every summer, but nobody could tell us why. iFactory's leak detection flagged three major leaks in our distribution piping within the first month, all in areas we hadn't inspected in over a year. Fixing those three leaks alone paid for a full year of the platform. What surprised us more was the boiler efficiency drift it caught — we would have kept running six more months before the fuel bill made it obvious."
Utilities Manager
Composite Textile Mill, Coimbatore
Frequently Asked Questions
QDo we need to install new sensors on every compressor, motor, and boiler, or can iFactory use our existing meters?
Most mills already have some level of sub-metering on major equipment, and iFactory connects to these existing meters wherever available rather than requiring a full hardware replacement. Where a critical asset has no metering at all — a common gap on older motors and smaller boilers — iFactory's assessment identifies which additions would deliver the fastest payback based on the equipment's energy consumption and failure risk.
Book an assessment to review your current metering coverage.
QHow accurately can iFactory pinpoint the location of a compressed air leak rather than just flagging that one exists?
iFactory's continuous monitoring identifies that a leak signature exists and estimates its magnitude from pressure decay patterns during non-production hours, which narrows the search significantly compared to a blind manual survey. For exact physical location, an ultrasonic leak survey is still the most precise method, and iFactory's findings are used to prioritize which distribution zones to survey first, making that manual work far more targeted and efficient.
QOur boilers are already regularly serviced by our AMC vendor — what does iFactory add beyond that maintenance schedule?
Scheduled AMC servicing catches issues that are visible during a periodic inspection, but efficiency drift from gradual scaling or minor burner wear often develops between service visits and goes unnoticed until the fuel bill rises. iFactory tracks stack temperature and fuel-to-steam ratio continuously, so drift is flagged as it develops rather than discovered at the next scheduled visit, giving your AMC vendor a specific issue to address instead of a routine checklist.
QCan iFactory help us build a business case for variable frequency drives on our oversized motors?
Yes, this is one of the most common findings mills act on. iFactory tracks actual load profiles per motor over weeks of real operation, rather than relying on nameplate ratings, and identifies which motors are running consistently underloaded — the strongest candidates for VFD retrofits. The reported load data gives your energy team a specific, defensible payback calculation to present for capital approval.
Ask for a sample VFD business case during your demo.
QHow long before we see a measurable reduction in our utility bill after going live?
Most mills see their first actionable findings — usually specific compressed air leaks or clearly underloaded motors — within the first two to three weeks of monitoring, since these issues tend to be the most immediately visible in the data. Measurable impact on the utility bill typically appears within one full billing cycle after those initial fixes are implemented, with the larger 12-18% recovery figure building over the first two quarters as boiler and process-heat findings are addressed as well.
Know Exactly Where Your Energy Spend Is Going — Not Just How Much It Was
iFactory tracks compressors, motors, and boilers at the equipment level, turning a rising utility bill into a specific, fixable list.
Compressor Leak Detection
Motor Load Analytics
Boiler Drift Alerts
No New Hardware Required