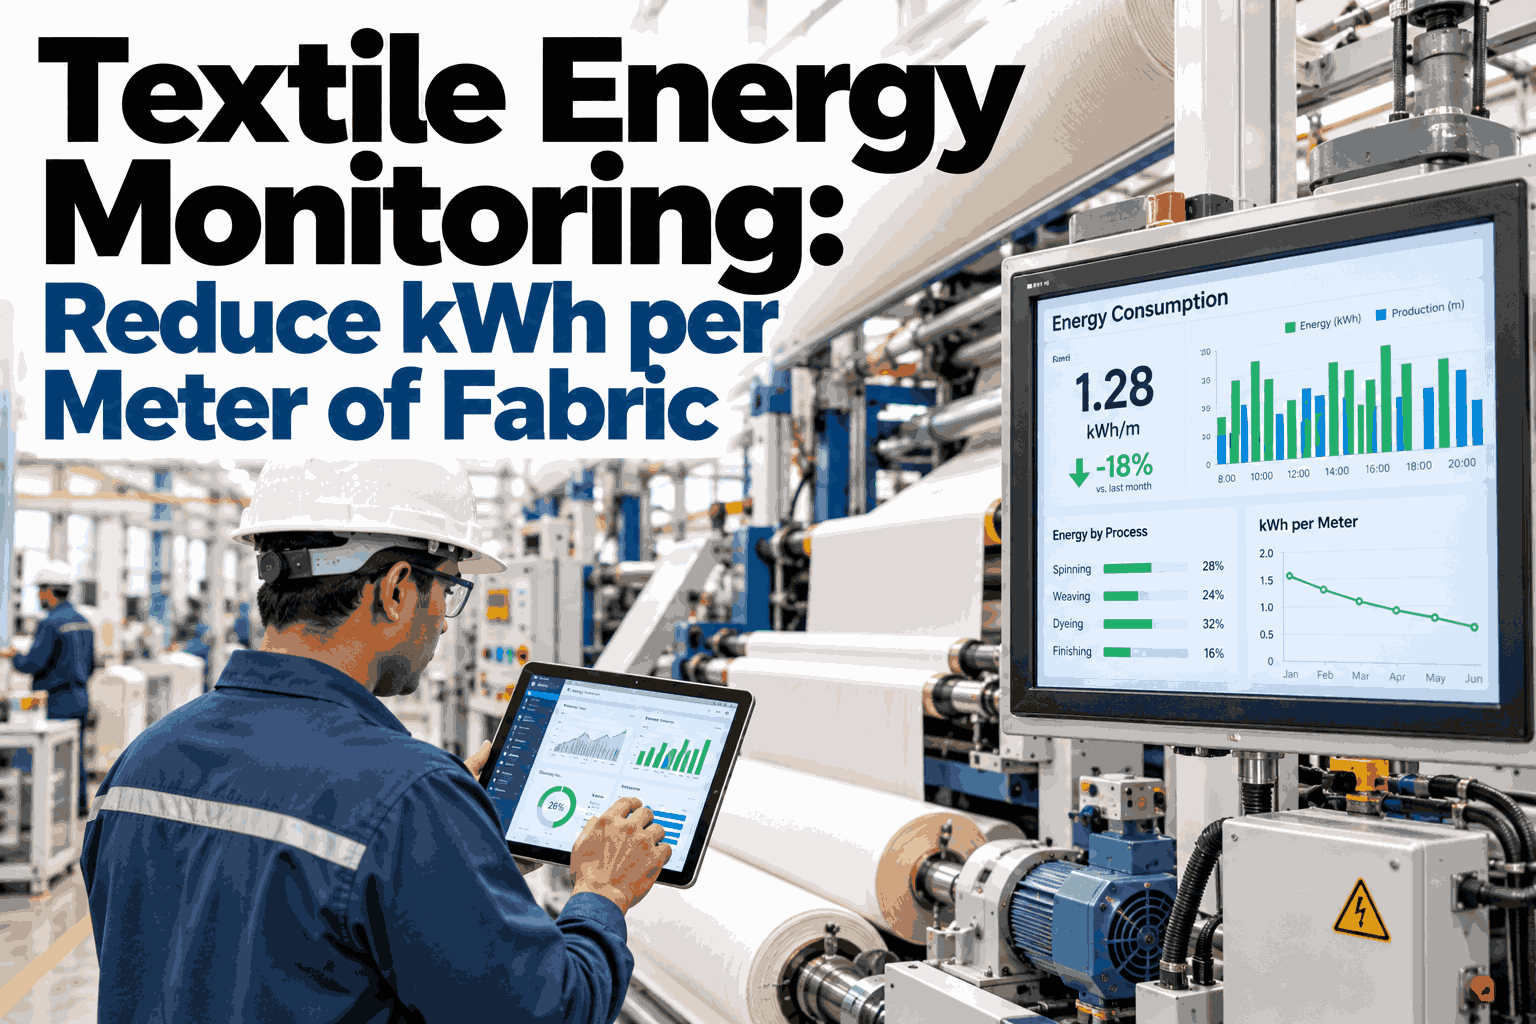
Textile Energy Monitoring: Reduce kWh per Meter of Fabric

By James Smith on October 13, 2026

textile-energy-monitoring-kwh-per-meter

Most textile mills know their monthly electricity bill to the last unit, but very few can say how many kilowatt hours went into a single meter of fabric. The bill hides the story. A loom shed running half empty, a dyeing machine heating a bath that nobody needs yet, and a compressor feeding air leaks all land on the same invoice at the end of the month. Once energy is measured per meter, those losses show up as numbers a supervisor can act on. This article shows where the energy goes, how to read it by department and shift, and how to start small, and if you want to see it on your own mill, you can map your energy per meter with our team.

Textile energy monitoring

Textile Energy Monitoring: Reduce kWh per Meter of Fabric

A practical look at how mills turn a single monthly bill into a clear energy cost for every meter produced, and where the first savings usually hide.

Total kWh used
divided by
Meters produced
equals
kWh per meter
The shift in thinking

Why a Monthly Bill Cannot Tell You Where to Save

A bill shows total spend. It cannot say which department, product or shift caused it, so nobody owns the number.

Bill view
One total per month, known weeks later, with no link to output.
Per meter view
Energy tied to each machine, style and shift, visible the same day.

Per meter figures also make fair comparisons possible. A busy week and a quiet week can finally be judged on the same scale.

Where it goes

The Energy Split Across a Typical Textile Mill

This illustrative split shows how energy is often shared between departments. Your mill will differ by process route, so treat it as a starting guide.

100%
of energy
Spinning, 30 percent
Wet processing, 30 percent
Weaving or knitting, 20 percent
Finishing, 15 percent
Utilities and other, 5 percent

Wet processing also uses a large amount of thermal energy such as steam, so a full view should track both electricity and heat.

Follow the fabric

The Fabric Journey and Its Hidden Energy Leaks

Each stage has its own typical waste. Knowing the usual suspect helps you decide what to measure first.

1
Spinning
Frames running at partial load and long idle motor time.
2
Weaving or knitting
Compressed air leaks and machines left running during stops.
3
Wet processing
Heating baths early and rinsing longer than needed.
4
Finishing
Dryers and stenters running hotter or longer than the fabric requires.
5
Utilities
Oversized compressors, boilers and chillers cycling inefficiently.
Spot the pattern

Shift and Department Heatmap: Where Intensity Climbs

This illustrative grid shades each cell by energy per meter. Darker means more energy for the same output.

Department
Shift A
Shift B
Shift C
Spinning
Low
Low
Medium
Weaving
Medium
High
Very high
Dyeing
Low
High
Medium
Finishing
Medium
Medium
High

A pattern like the dark night shift cell in weaving usually points to practice, such as machines idling, rather than to equipment faults.

See your own heatmap

Find Your Highest kWh per Meter Hotspots

Share your departments and shift pattern, and we will show how energy per meter can be tracked by machine, style and shift.

Prioritize

Quick Wins and Deeper Projects: What to Do First

Not every saving needs capital. Sort ideas by effort and impact, and start where effort is low.

Quick wins
Switch off idle machines, fix air leaks, trim bath heating time.
Plan next
Variable speed drives, heat recovery and compressor sequencing.
Fill in later
Small lighting and housekeeping fixes with modest impact.
Think hard
Major equipment replacement and process redesign.
How deep to measure

Three Levels of Energy Monitoring

You do not need a meter on every motor on day one. Build up in layers as the value becomes clear.

Level 1: Mill main meters and utilities
Level 2: Department and big machine meters
Level 3: Machine level with output and style data
Worked example

What a Small Drop in kWh per Meter Is Worth

This illustrative case uses round numbers to show how a small gain scales across a full month.

1.8
kWh per meter before
1.6
kWh per meter after
100,000
kWh saved per month at 500,000 meters

The saving comes from 0.2 kWh multiplied by 500,000 meters. Multiply it by your own tariff to see the monthly value.

Frequently asked questions

What Textile Teams Ask Before Starting

Do we need to meter every machine to start?
No. Most mills begin with main meters and the largest departments, then add machine level meters where the data shows a real opportunity. Plan a staged metering approach with our team.
How do we get meters produced for the calculation?
Production counts can come from machine counters, ERP records or shift logs, and they are matched to energy readings by time period. Ask support about connecting output data for your machines.
Can steam and gas be tracked along with electricity?
Yes, thermal energy can be tracked with flow and fuel meters and converted to a common unit, which gives a more honest figure for wet processing. Review your thermal data options on a call.
Does product mix change the kWh per meter figure?
It does, since heavy or heavily finished fabrics need more energy. Comparing by style or fabric weight keeps the numbers fair. Learn how to group styles for comparison with the support team.
How quickly can we expect to see savings?
Behavioral and maintenance fixes such as idle shutdown and leak repair can show up within weeks, while equipment upgrades take longer. Set realistic savings targets with our specialists.
Measure it to manage it

Start Reducing kWh per Meter in Your Mill

Book a session with iFactory AI to see how energy monitoring can reveal hotspots, set fair targets and cut cost for every meter of fabric.

Share This Story, Choose Your Platform!