An energy manager at a composite textile mill in Tamil Nadu told us in 2025: "We knew the stenter was inefficient. We did not know it was consuming as much energy as the entire spinning preparation. We did not know our compressed air system was running at 7.5 bar when 6.0 was sufficient. We did not know the third dyeing machine was using 22% more steam per kg than the other two." Twelve months later, after deploying plant-wide process energy analytics across spinning, weaving, dyeing, and finishing, the same mill had cut total energy spend by 14.3% and submitted its first Higg FEM Level 2 score above 75. The fix was not a new boiler or a new motor. It was visibility — at the right level of the process, for the first time. This page is for mill operators, energy leads, and sustainability managers who need to understand where plant-wide energy monitoring actually delivers in textile manufacturing.
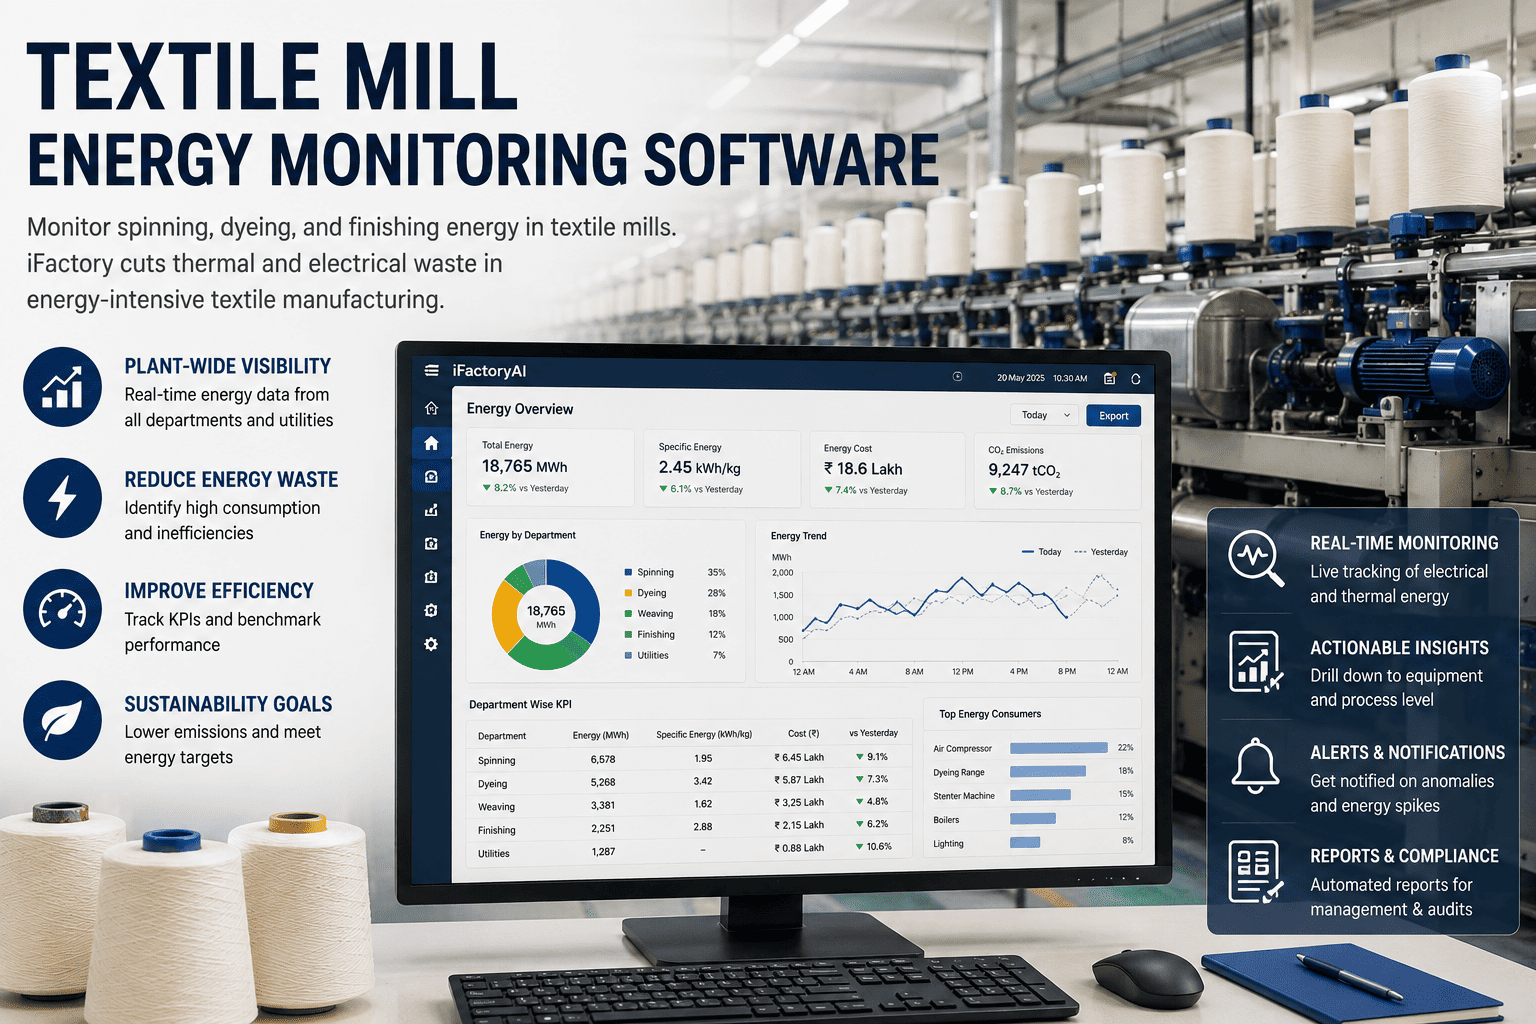
Textile Mill Energy Monitoring — Spinning, Dyeing, Finishing, and the Thermal-Electrical Reality Other Industries Do Not Face
Textile manufacturing is the only sector where electrical and thermal energy are roughly equal contributors to the bill — and where the dominant loads change completely between process stages. Spinning is electrical and motor-heavy; wet processing is thermal and steam-heavy; finishing is thermal and gas-heavy. A monitoring platform that does not separate these flows is a monitoring platform that misses where the waste lives.
Electrical and Thermal — Two Bills, Two Failure Modes, One Plant
A composite textile mill spends roughly half its energy on electricity and half on thermal energy. Both have to be monitored or the picture is wrong. The breakdown below shows where each goes in a typical composite mill — and why a monitoring platform built for discrete manufacturing misses most of the textile-specific waste.
Electrical Energy
Motor-dominated, compressed-air-heavyThermal Energy
Steam-dominated, distribution-loss heavyWhy this split matters operationally
An electrical-only monitoring platform misses the thermal half of the bill. A thermal-only platform misses spinning and compressed air. Generic plant monitoring without process context misses the fact that ring frames are not the same as humidification fans even though both draw from the same panel. Textile monitoring has to track both streams and tag every reading with the process stage that consumes it.
Five Stages of Textile Production — Energy Intensity at a Glance
Textile manufacturing has a defined linear flow from fibre to finished fabric. Each stage has a distinct energy fingerprint — its dominant load type, its intensity (kWh per kg), and the savings opportunities it offers. The flow below is the operational reality of a composite mill.
Spinning
3–5 kWh/kg yarn ElectricalWeaving / Knitting
1.2–6 kWh/kg fabric ElectricalWet Processing
10–15 kWh/kg + steam BothFinishing & Stenter
17.9 kWh/kg ThermalGarmenting
0.5–1 kWh/kg ElectricalWhere the visibility gap costs the most
Finishing is the highest-intensity single stage at 17.9 kWh per kg. Wet processing is the second. Spinning is third by absolute intensity, but first by absolute consumption because it runs continuously across the largest installed motor base. Monitoring without process-level tagging cannot tell you which of the three is contributing the marginal kWh — and that is the kWh you can act on.
Five Process Stages — Dominant Load, Top Opportunity, Where to Meter First
Each stage has its own monitoring playbook. The cards below cover what plant-wide visibility means specifically for each — which loads to meter, what KPIs to track, and what savings the meters typically uncover within the first ninety days.
Spinning — Blow Room to Ring Frame
Electrical · Motor-dominated · 41% of mill electricityWeaving and Knitting
Electrical · Compressed-air heavy · 18–23% of mill electricityWet Processing — Preparation, Dyeing, Printing
Thermal-electrical mix · 38% of mill total energyFinishing & Stenter — Drying and Heat-Setting
Thermal-dominated · Highest single intensity in the millGarmenting — Cutting, Sewing, Finishing
Electrical-dominated · Lowest intensity, highest behavioural variationSix Largest Energy Waste Pockets in Indian and Bangladeshi Textile Mills
Across more than 150 mill audits, six categories of waste account for the majority of the recoverable savings. The order below is the typical priority — biggest first, fastest payback last.
Compressed air leaks and over-pressurisation
Air-jet mills lose 15–25% of compressed air to leaks. Setpoint of 7.0–7.5 bar where 6.0 is sufficient adds another 10–15%. Combined waste: typically 4–6% of total mill electricity.
Stenter inefficiency and exhaust losses
Stenter exergy efficiency averages 28.7% — meaning 70%+ of fuel is lost. Exhaust heat recovery, exhaust humidity tuning, and zone-temperature optimisation typically recover 25–35% of stenter fuel.
Steam distribution and trap failures
15–20% of steam generated is lost in distribution and trap failures. Single-point steam metering at the boiler hides this. Distribution submetering reveals where the steam is actually consumed versus generated.
Humidification system over-running
Humidification fans frequently run at full speed regardless of ambient RH. VFD control responsive to outside air conditions saves 20–35% on humidification — a significant slice in spinning halls.
Idle dyeing machine cycles and partial loading
Soft-flow and jet dyeing machines running partial loads consume nearly full thermal energy. Real-time machine-by-machine kWh-per-kg surfaces the under-loaded machines that should be scheduled together.
Ring frame and spinning preparation motor inefficiency
The ring frame is typically the lowest-efficiency major motor in the spinning hall. Submetering by frame reveals the outliers — high-efficiency motor retrofits on the bottom decile save 5–8% of spinning electricity.
Higg FEM, BEE PAT, ZDHC — The Compliance Layer Buyers Now Require
Textile is the only major manufacturing sector where customers — global apparel brands — directly score and audit supplier sustainability performance. Plant-wide energy monitoring provides the data foundation for every major framework. The compliance value runs alongside the energy savings, not separately.
Higg FEM — Facility Environmental Module
The Sustainable Apparel Coalition's Higg FEM scores facilities annually against energy, water, chemicals, waste, and air emissions. Self-reported FEM is the entry; Higg-verified FEM is what unlocks premium contracts. Plant-wide submetering provides the asset-level data needed for FEM Level 2 and 3 scoring.
BEE PAT — Designated Consumers (India)
The Perform-Achieve-Trade scheme designates large textile mills (above 3,000 tonnes of oil equivalent per year) as obligated consumers with assigned Specific Energy Consumption targets. Submetering provides the verification data for PAT compliance and energy savings certificate (ESCert) trading.
ZDHC — Zero Discharge of Hazardous Chemicals
Increasingly required by global apparel brands. While ZDHC focuses on chemical management, the energy-water linkage in wet processing means submetering data is required to demonstrate the operational practices that satisfy the broader sustainability commitment.
ISO 50001 — Energy Management System
The international standard for energy management. Submetering provides the Energy Performance Indicator (EnPI) data and Energy Baseline (EnB) data required for certification. Increasingly demanded by European customers as a procurement prerequisite.
Scope 2 GHG — Customer-mandated reporting
Large apparel brands now require Scope 2 emissions reporting from Tier 1 fabric and garment suppliers. Plant-wide monitoring with location-based and market-based emission factors produces the defensible per-kg and per-garment carbon numbers buyers demand.
LEED & IGBC — Green Mill certifications
Plant-wide energy data feeds the operational energy performance credits in LEED v4.1 and Indian IGBC mill certifications. New-build and retrofit mills increasingly target these certifications for market positioning and customer access.
Get a stage-by-stage energy assessment for your mill
We walk the mill from blow room to finishing, audit your existing electrical and thermal metering, and deliver a prioritised meter-point plan with stage-specific savings projection. Includes Higg FEM gap analysis and BEE PAT alignment if applicable.
- Stage-by-stage meter inventory
- Electrical + thermal gap analysis
- Compressed air and steam audit
- Higg FEM data-readiness assessment
- Pre-configured NVIDIA AI server, racked and ready
- Live in 6–12 weeks across pilot stages
Process Energy Analytics — What a Textile-Specific Platform Measures
Generic energy monitoring tracks kWh and rupees. Textile-specific process energy analytics tracks the metrics that connect energy to fabric — per kg, per metre, per garment, per shade, per machine, per fibre type. These are the metrics that turn data into operational decisions.
| Metric | Where it lives | What it surfaces |
|---|---|---|
| kWh per kg yarn (by count) | Spinning hall, ring frame level | Outlier ring frames; coarse vs fine count specific consumption; preparation efficiency |
| kWh per metre fabric (by construction) | Weaving and knitting, loom-by-loom | Loom efficiency comparison; air-jet vs rapier specific consumption; warp tension impact |
| Steam kg per kg fabric (by lot) | Wet processing, machine-by-machine | Liquor ratio efficiency; under-loaded machines; dyeing recipe variations |
| Thermal kWh per kg fabric (stenter) | Finishing, stenter zone-by-zone | Zone temperature deviation; exhaust heat losses; residual moisture targeting |
| Compressed air Nm³ per kg fabric | Weaving section, compressor house | Air-jet loom efficiency; leak progression; setpoint waste |
| Humidification kWh per m³ conditioned | Spinning hall HVAC plant | Over-running fans; setpoint waste; seasonal optimisation opportunity |
| Energy per garment (by SKU) | Garmenting, cluster-level | Idle sewing-machine consumption; pressing efficiency; SKU profitability impact |
| Scope 2 kg CO₂e per kg fabric | Plant-wide aggregation | Customer carbon disclosure; Higg FEM reporting; renewable PPA impact tracking |
Case Study — Composite Textile Mill, ₹54 Cr Annual Energy Spend
A composite textile mill in Tamil Nadu with spinning, weaving, dyeing, and finishing on a single site. 320,000 spindles, 480 air-jet looms, 18 dyeing machines, 6 stenters. Plant-wide energy monitoring deployed across 14 months in three waves. The 18-month outcome:
| Metric | Pre-deployment | After 18 months | Change |
|---|---|---|---|
| Annual energy spend | ₹54.0 Cr | ₹46.3 Cr | −14.3% |
| Spinning kWh per kg yarn (40s combed) | 4.42 | 3.86 | −12.7% |
| Stenter thermal kWh per kg fabric | 17.9 | 13.4 | −25.1% |
| Compressed air pressure setpoint | 7.5 bar | 6.0 bar | Reduced |
| Steam distribution losses | ~18% | ~9% | Halved |
| Higg FEM verified score | Not submitted | Level 2, 77 points | Achieved |
| BEE PAT compliance status | Below target SEC | 15% above target | ESCerts generated |
| Scope 2 reporting cycle time | 2–3 weeks per quarter | One click, real-time | Eliminated |
Where the 14.3% reduction actually came from
The biggest single contribution was the stenter — exhaust heat recovery, humidity tuning, and zone-temperature optimisation delivered 4.6 percentage points on the total bill. Compressed air pressure reduction and leak repairs delivered 2.8 points. Humidification VFD control delivered 1.9 points. The remaining 5 points came from a long tail of smaller wins — ring frame retrofits, dyeing schedule consolidation, steam trap repairs, and behaviour change driven by cost-center reporting. No single silver bullet — compounding small wins, every one of them invisible without process-level metering.
Six-Phase Roadmap from Audit to Verified Higg FEM Score
A textile mill energy program that produces the 8–15% savings range follows a deliberate sequence — meter the highest-impact stages first, prove savings, then expand. The phases below are calibrated for composite mills in active production with no shutdown windows.
Mill Walk-down and Meter Point Prioritisation Week 1–3
Walk every stage from blow room to dispatch. Document existing electrical and thermal metering. Prioritise meter points by expected ROI — stenter, compressed air, ring frames, dyeing machines, humidification typically rank in the top thirty.
Wave-1 Electrical & Thermal Submetering Week 4–10
Install the top 100–150 points. Non-invasive CTs and flow meters on stenter and dyeing thermal headers. Edge gateway aggregates by stage. Most installation during normal operation; only steam-header work needs a planned shutdown window.
Baseline Collection and Quick Wins Week 11–18
Six to eight weeks of data. Quick-win audits — compressed air leaks, steam trap failures, stenter exhaust analysis, humidification fan operation. First 3–5% of mill bill recovered before deeper deployment completes.
Wave-2 Expansion & Stage Analytics Week 19–28
Mid-tier loads — ring frames individually, looms in clusters, dyeing machines, finishing-line submeters. Stage-by-stage dashboards delivered to supervisors. Cost-center reporting begins.
Operationalisation and Compliance Reporting Month 7–9
Per-stage dashboards delivered to operations. Higg FEM data export configured. BEE PAT compliance reports automated. Scope 2 carbon reporting goes live. Monthly energy review meetings established.
Wave-3 Completion and Verified Scoring Month 10–14
Final remaining meter points installed — garmenting, balance of plant, distribution submetering. Higg FEM Level 2 verification submitted. Audited energy savings calculation finalised, typically 8–12% in Year-1 against baseline.
Textile Energy Monitoring — Common Questions
Can we use the same monitoring platform for spinning, weaving, dyeing, and finishing?
The same platform, but with stage-specific configuration. Each stage requires its own KPIs (kWh per kg yarn for spinning, kWh per metre for weaving, steam-kg per kg fabric for wet processing, thermal kWh per kg for finishing). Generic energy software that treats all stages the same misses the textile-specific metrics that drive the savings. Process Energy Analytics in iFactory ships with pre-configured templates for each textile stage.
Do we have to monitor thermal energy or can we focus on electrical only?
You can start with electrical only and capture roughly 50–60% of the mill's energy picture. But for a composite mill the wet processing and finishing thermal savings are larger in absolute rupees than most electrical opportunities. Most mills add thermal in Wave 2 once the electrical baseline is delivering quick wins. Final-state plant-wide monitoring requires both.
How does this integrate with our existing BEE PAT reporting?
Submetering data feeds directly into the Specific Energy Consumption (SEC) calculations that PAT requires. The platform exports BEE-format reports with the assigned versus actual SEC, ESCert tracking, and the M&V documentation auditors expect. Mills with submetering routinely produce 10–20% over-target performance translating to traded ESCerts.
What is the typical Higg FEM uplift from plant-wide submetering?
Self-reported Higg FEM scores in the 40–50 range routinely move to 70–80 in Level 2 verification once submetering provides the asset-level data points the higher levels require. The data is not the only factor — the actual energy reduction also drives the score — but submetering is the prerequisite for advancing beyond Level 1.
How does the platform handle the spinning humidification system specifically?
Humidification fans are submetered individually and the platform correlates their consumption with ambient temperature and humidity. The dashboard surfaces when humidification is over-running for the prevailing conditions. Mills with this configuration routinely save 20–35% on humidification load in cooler months through fan VFD control driven by the analytics.
Do we need to buy NVIDIA AI servers separately?
No. The fully-loaded AI server is supplied pre-configured and pre-loaded with the textile-specific Process Energy Analytics platform, Higg FEM reporting, BEE PAT compliance, ISO 50001 EnMS, Scope 2 carbon reporting, and dashboards for spinning / weaving / wet processing / finishing / garmenting. On-premise, no cloud, no egress. Rack it, connect power and Ethernet, and the system goes live. Cabling, electrical and thermal meter integration, operator training, and 24×7 remote monitoring are all included.
What is the typical timeline from contract to first verified savings?
Live in 6–12 weeks for the Wave-1 install. Three-phase delivery: weeks 1–4 — mill walk-down and meter prioritisation. Weeks 5–8 — Wave-1 hardware install and baseline collection begins. Weeks 9–12 — first dashboards live, first quick-win savings identified. Full Year-1 savings typically realised by month 12–14, with verified Higg FEM submission by month 18.
From Blow Room to Stenter — One Platform, Two Energy Streams, Verified Savings
Hardware + software bundle. Pre-configured NVIDIA AI server, racked and ready, on-premise — no cloud, no data egress. Pre-loaded with textile-specific Process Energy Analytics, Higg FEM reporting, BEE PAT compliance, ISO 50001 EnMS, Scope 2 carbon dashboards, and stage-by-stage templates for spinning, weaving, wet processing, finishing, and garmenting. Live in 6–12 weeks. Trusted by 1000+ industrial clients with 99.9% uptime.