A 3000 TPD cement plant in Rajasthan experienced catastrophic ball mill failure at 2 AM. The mill—critical for their grinding circuit—was down for 72 hours. Emergency bearing replacement cost ₹45 lakhs. Production loss: 9000 tonnes. Total impact: ₹2.8 crores. The failure was 100% preventable—vibration data showed bearing degradation starting 18 days earlier, but traditional time-based maintenance missed it.
Indian cement manufacturers lose 15-25% of production capacity to unplanned downtime. Ball mills, VRMs, and grinding circuits represent the highest-value failure points—where a single breakdown cascades through the entire operation. AI-powered predictive maintenance is now preventing these failures 2-3 weeks in advance and reducing downtime by 250+ hours annually. Here's how leading plants are doing it.
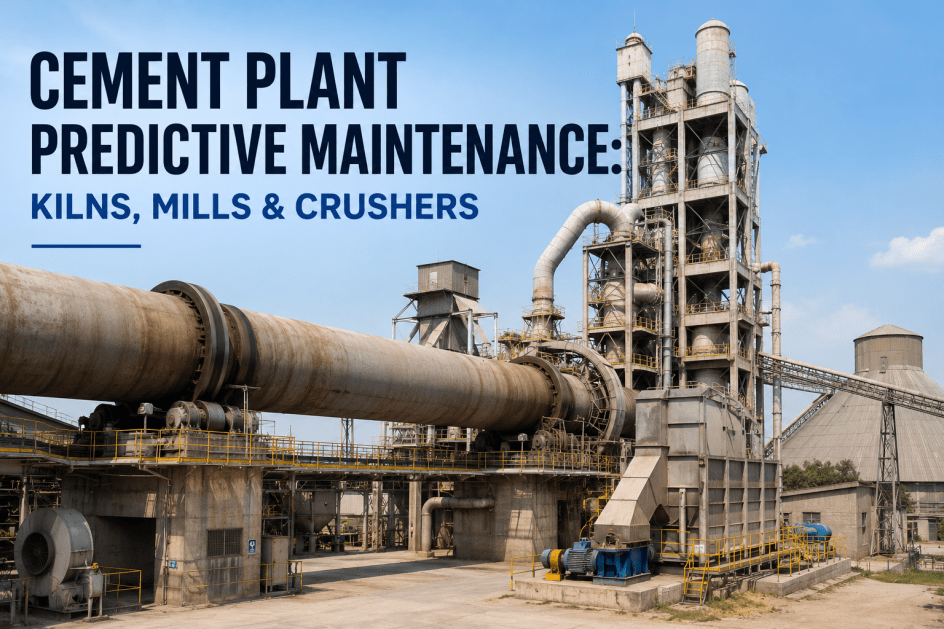
Predictive Maintenance for Cement Mills: Reducing Unplanned Downtime by 250+ Hours
AI-Powered Failure Prevention for Ball Mills, VRMs & Grinding Circuits
Real Results: 5000 TPD Cement Plant (Gujarat)
12-Month Predictive Maintenance Deployment
Ball Mill & VRM Monitoring | 5000 TPD Capacity
Baseline: 18 unplanned shutdowns (previous year) | 380 hours total downtime | ₹22 Cr production loss
- Ball mill main bearing failure (predicted 21 days early)
- VRM table liner cracking (predicted 16 days early)
- Gearbox lubrication system degradation (predicted 23 days early)
- Mill motor rotor imbalance (predicted 12 days early)
Get Free Downtime Analysis for YOUR Plant
We'll analyze your last 12 months of mill shutdowns and calculate exact savings potential from predictive maintenance. See which failures were preventable and when AI would have warned you.
- Historical failure analysis
- Preventable vs non-preventable breakdown
- Lead time estimation
- Production loss calculation
- ROI projection
- Implementation roadmap
Want to discuss your specific mill failures? Talk to our cement industry specialists — We've deployed at 15+ Indian cement plants.
Critical Failure Modes: What AI Detects Early
Ball Mill & VRM Critical Failures
Ball Mill Main Bearing Degradation
Most expensive failure mode—complete mill replacement if bearing seizes
- Vibration amplitude increase (0.5mm/s → 3.2mm/s over 18 days)
- Temperature rise in bearing housing (45°C → 62°C)
- High-frequency vibration spikes (bearing cage defect signature)
- Acoustic pattern changes (metal-to-metal contact)
VRM Roller & Table Liner Wear
Gradual degradation leading to sudden catastrophic failure
- Vibration pattern shift (grinding efficiency degradation)
- Power consumption increase (12% over 3 weeks)
- Product fineness variation (Blaine changes)
- Hydraulic pressure fluctuations
Mill Gearbox Lubrication Failure
Oil contamination or pump failure leads to rapid gear damage
- Oil temperature abnormalities (pressure-temp correlation)
- Gear mesh frequency vibration changes
- Acoustic signature of metal particles in oil
- Flow rate fluctuations in lubrication system
Mill Motor Rotor Imbalance
Gradual rotor degradation from thermal cycling and electrical stress
- 1× RPM vibration amplitude increase
- Motor current imbalance (phase-to-phase variation)
- Thermal imaging hotspots
- Startup vibration signature changes
How the AI Monitoring System Works
Sensor Network & AI Analytics
Vibration Sensors
• 0-10kHz frequency range
• Bearing points + motor
• 24/7 continuous monitoring
Temperature Monitoring
• PT100 RTDs at bearings
• Oil temperature sensors
• Trending & anomaly detection
Power & Acoustics
• Power quality monitoring
• Ultrasonic sensors
• Pressure transducers
AI-Powered Predictive Analytics
ML models trained on 2+ years of normal operation to detect subtle degradation patterns
Known failure modes from 50+ cement plants—bearing defects, liner wear, lubrication issues
Predicts days until failure threshold—enabling planned shutdowns during maintenance windows
Prioritizes alerts by criticality—urgent (0-7 days), warning (8-21 days), informational (21+ days)
See Live Vibration Analysis Demo
Bring your mill vibration data (if available) or see demo with real cement plant data. Watch AI identify bearing defects, liner wear, and imbalance issues in real-time.
Implementation Timeline: 60-Day Deployment
From Installation to Predictions
Week 1-2: Sensor Installation
Install vibration sensors, temperature probes, and current transformers on ball mill, VRM, motors, gearboxes. No production shutdown required—sensors installed during normal operation.
Week 3-4: Baseline Data Collection
Collect 2-3 weeks of "healthy" operation data to establish normal patterns. AI learns your specific equipment signatures—every mill is unique.
Week 5-6: Model Training & Tuning
Train machine learning models on your baseline data + historical failure data from similar mills. Tune sensitivity to minimize false alarms while catching all real issues.
Week 7-8: Live Monitoring & Validation
System goes live with full predictive capabilities. First 2 weeks run in "validation mode"—operators verify alerts against their observations to build confidence.
Week 9+: Full Predictive Operation
System operates autonomously with 24/7 monitoring. Maintenance teams receive alerts 2-3 weeks before failures, enabling planned interventions during scheduled shutdowns.
ROI Breakdown: Investment vs Savings
12-Month Financial Impact (5000 TPD Plant)
Total Investment
₹28 LakhsHardware + software + installation + training + 1-year support
Downtime Prevention Value
₹15.8 Crores267 hours × 5000 TPD × ₹4500/tonne production margin
Net ROI (Year 1)
564%₹15.52 Cr net savings ÷ ₹28L investment = 56.4x return
- Maintenance cost reduction: Planned interventions cheaper than emergency repairs (₹15-20L savings)
- Inventory optimization: Stock critical spares based on predicted failure modes (₹8-12L working capital release)
- Safety improvements: Prevent catastrophic failures that endanger personnel
- Product quality: Maintain consistent grinding performance—no gradual degradation before failures
Want customized ROI for your plant capacity? Chat with our team — We'll calculate exact savings potential based on your TPD and failure history.
Predictive Maintenance Key Takeaways
- 250+ hours annual downtime reduction is typical for 3000-5000 TPD plants with ball mills + VRM
- 18-21 day warning lead time enables planned shutdowns during scheduled maintenance windows
- Ball mill bearing failures are 100% predictable—vibration patterns show degradation 2-3 weeks early
- 60-day implementation from sensor installation to live predictions—no long IT projects
- ROI typically 500-700% in year 1 for plants with ≥3 major shutdowns annually
- Most failures are gradual—AI catches the subtle early signs that time-based maintenance misses
Reduce Unplanned Downtime at Your Cement Plant
Free assessment: We'll analyze your last 12 months of mill failures and calculate exact preventable downtime.
See which shutdowns AI would have predicted and how much production you could have saved.