Most plants can name their downtime cost in general terms — a rough dollar-per-hour figure everyone quotes in meetings — but rarely quantify it precisely, and that imprecision is itself expensive, because a cost that isn't measured accurately can't be systematically reduced. Independent industry analysis is consistent on the scale of the gap: the true cost of an unplanned downtime event typically runs 2 to 4 times higher than the lost-production figure most plants actually calculate, once labor idle time, startup scrap, overtime, expediting fees, and customer penalties are counted alongside it. Most plants only count one or two of these components and underestimate their real exposure by 50 to 70 percent as a result — and that gap is precisely the difference between a downtime prevention investment that looks marginally worthwhile and one that's obviously overdue. See how iFactory captures every cost component of a downtime event automatically, not just the lost-production line everyone already tracks.
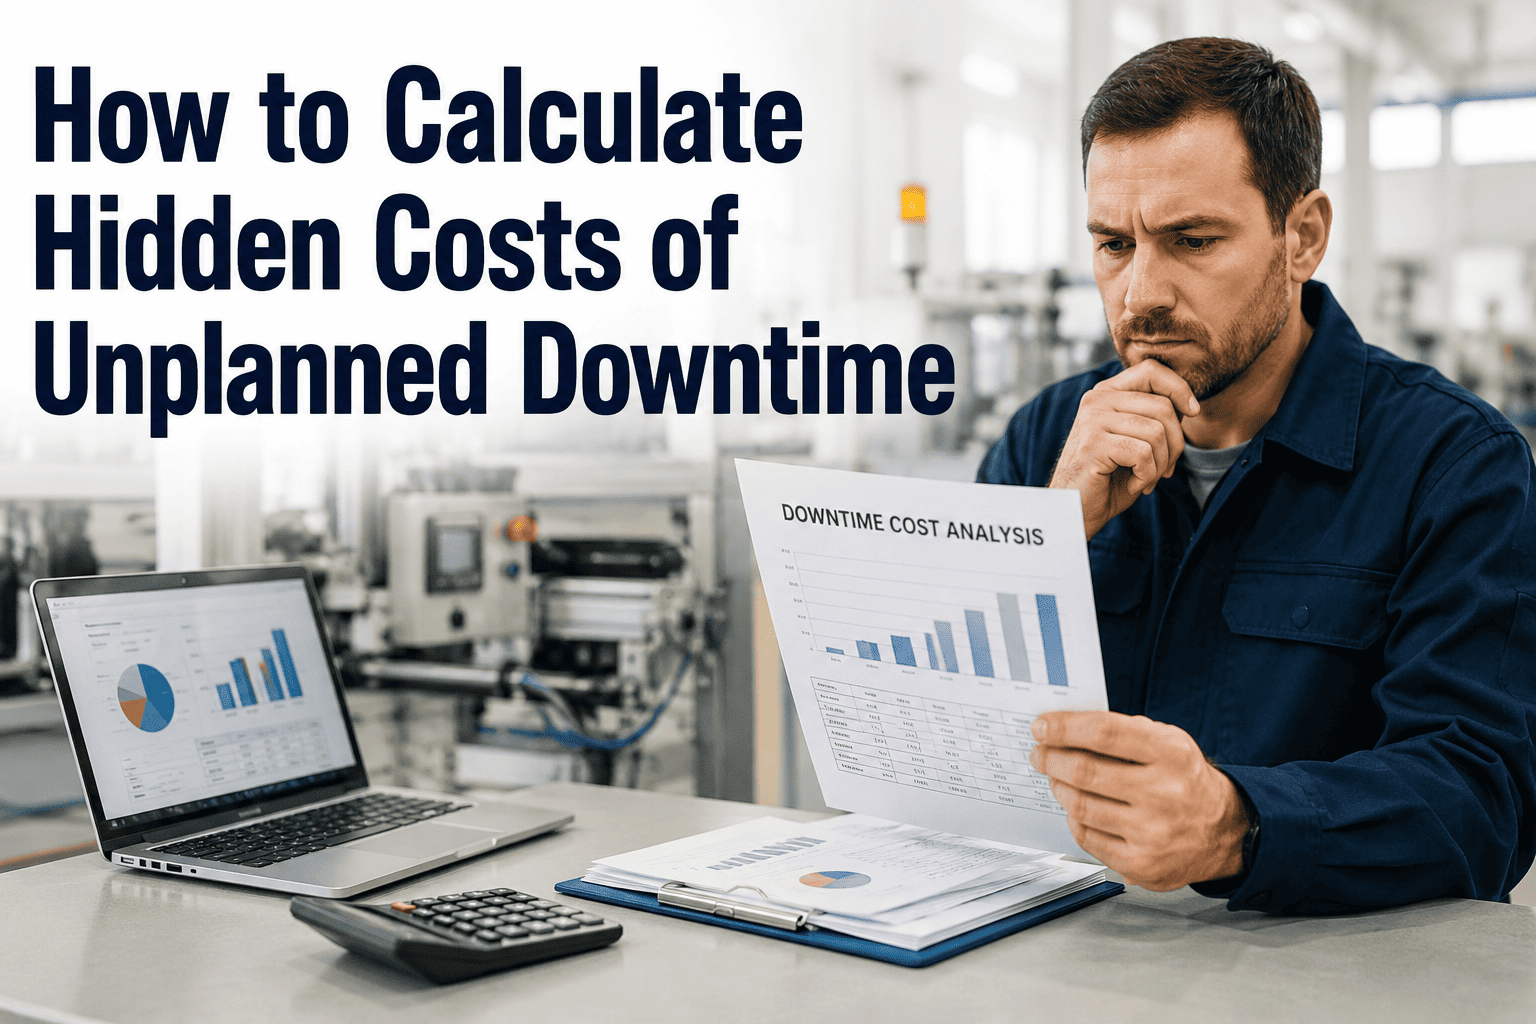
How to Calculate the Hidden Costs of Unplanned Downtime
Labor idle time, startup scrap, overtime, expediting fees, and customer penalties — the components that turn a lost-production estimate into the true cost of a downtime event, and why most plants only see a fraction of it.
Lost Production Is the Easiest Cost to See — and the Least Complete
When a line goes down, the number that gets reported up the chain almost always starts and ends with lost production value: units per hour, times margin per unit, times hours down. That figure is real, and it's usually the largest single line item — but it's also the easiest one to calculate, which is exactly why it's the one most plants stop at. The categories that actually determine whether a downtime event costs tens of thousands or hundreds of thousands of dollars are the ones sitting outside that first calculation entirely, scattered across payroll, quality, procurement, logistics, and account management, with no single person responsible for reconciling them back to the original event.
Six Components, Not One
A defensible total-cost calculation adds five categories to the lost-production figure most plants already track. Each one is straightforward to calculate individually — the value is in the discipline of tracking all six for every event, not just the obvious one, and in linking each category back to the specific incident that caused it rather than letting it disperse into a general budget line.
| Component | Formula | Why Plants Miss It |
|---|---|---|
| Lost Production | Units/hour × margin/unit × hours down | Usually the only component tracked — not missed, just treated as the whole picture |
| Idle Labor | Idled workers × fully-loaded hourly rate × hours down | Wages, benefits, and overhead continue for every operator, tech, and material handler who can't work while the line is down |
| Startup Scrap | Additional scrap rate × units produced during restart × cost/unit | Restart quality issues are treated as a separate quality metric, not linked back to the triggering downtime event |
| Overtime / Recovery | Recovery overtime hours × overtime premium rate | Catch-up overtime often shows up in a different budget line weeks later, disconnected from the event that caused it |
| Expediting & Emergency Costs | Emergency parts premium + expedited freight premium + emergency labor callout | Procurement and logistics premiums are absorbed into standard budget categories rather than attributed to the specific event |
| Customer Penalties | Contractual late-delivery penalties + goodwill/relationship risk (conservative estimate) | Penalties often land in a commercial or account-management function entirely disconnected from the plant floor |
The visual proportions above are illustrative, but the pattern they represent is consistent across the independent industry sources this figure is drawn from: lost production is the largest single bar, but it is rarely more than half of the total once every other category is stacked on top of it. A plant that reports only the first bar isn't lying about its downtime cost — it's reporting an accurate number for an incomplete question.
If Your Downtime Report Only Shows Lost Production, It's Showing Roughly a Third of the Story
iFactory links idle labor, startup scrap, overtime, and expediting costs directly to the downtime event that caused them — automatically, not reconstructed later from five different budget lines.
A 3-Hour Unplanned Stop, Priced Completely
The scenario below uses realistic, independently-benchmarked figures for a mid-sized production line to show how the six components compound past the number most incident reports actually capture. None of the individual figures here are extreme — each one falls within commonly cited ranges for a moderate-severity event.
This example uses a moderate multiplier — roughly 1.6x, toward the lower end of the commonly cited 2 to 4x range — precisely because it's meant to be a realistic, defensible floor rather than a worst-case scenario. A more severe event, with heavier emergency parts premiums or a larger penalty exposure, pushes well past this figure.
Turning a One-Time Calculation Into a Standing Practice
A single worked example is useful for making the case that hidden costs matter, but the real value comes from applying this calculation consistently, not as a one-off exercise triggered by a particularly bad incident. A commonly recommended starting approach: run the full six-component calculation against the last three to five significant unplanned downtime events, which yields a realistic multiplier specific to your own operation rather than relying on an industry-average figure that may not reflect your actual labor rates, contract terms, or supply chain exposure.
That plant-specific multiplier then becomes a practical shortcut — applying it to the lost-production figure for routine incident tracking gives a reasonable total-cost estimate without requiring a full cross-departmental reconciliation for every single stoppage. The full six-component breakdown is still worth revisiting periodically, particularly after a significant change in labor costs, contract terms, or supply chain conditions that would shift the multiplier meaningfully.
Where the Invisible 50 to 70 Percent Actually Lives
The four patterns below explain why these costs disappear from view even at plants with reasonably mature financial reporting — the issue usually isn't a lack of data, it's that the data lives in the wrong place to ever get connected back to the triggering event.
Every plant controller I've worked with can quote a downtime-cost-per-hour figure from memory. Almost none of them can tell you, for a specific incident three months ago, what the recovery overtime actually cost or whether the customer penalty on that late shipment ever got connected back to the original stoppage. The lost-production number is the one everyone already has, so it's the one that gets reported. The other five categories require someone to go looking, across payroll, procurement, and account management, and most plants simply don't have anyone whose job it is to do that reconciliation. That's not a data problem. It's an ownership problem — and it's a genuinely fixable one, once someone actually owns pulling those five categories into the same view as the incident that caused them.
Frequently Asked Questions
Every Cost Component, Linked to the Event That Caused It
iFactory automatically links idle labor, startup scrap, recovery overtime, and expediting costs to the specific downtime event that triggered them — so your true cost of downtime is a number you can see, not one you have to go reconstruct across five departments after the fact.