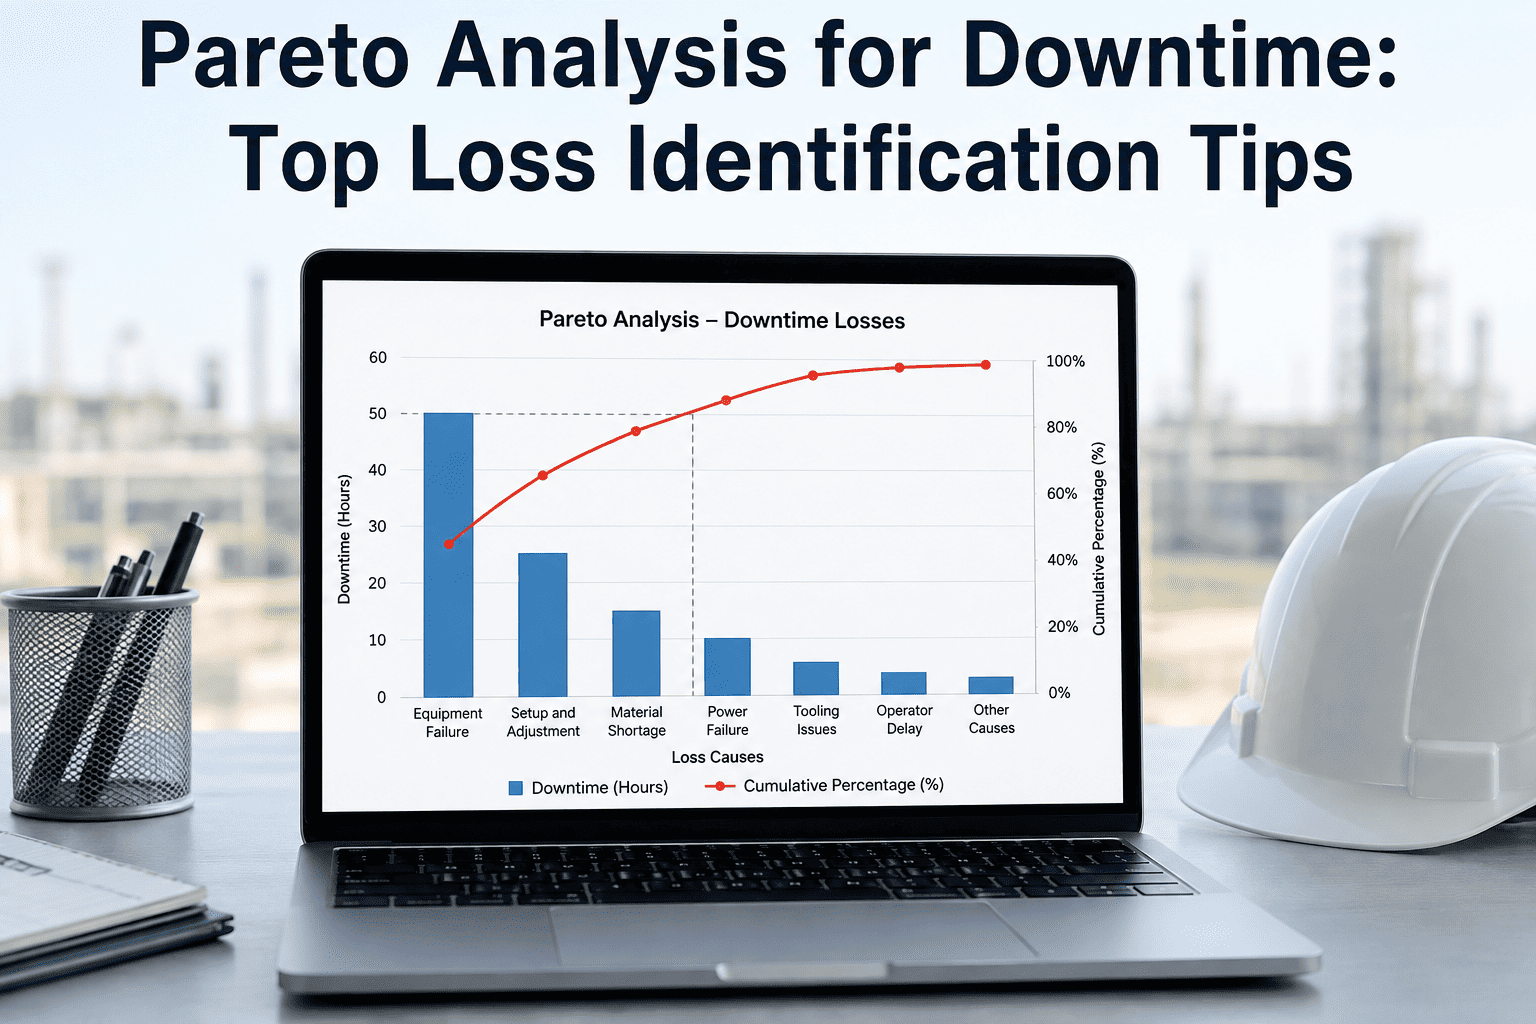
Most plants have more downtime causes on their list than they could ever realistically fix at once, which is exactly the situation Pareto analysis is built for. Ranking causes by cumulative time lost rather than by how recently or loudly they were complained about routinely reveals that a small handful of categories, often as few as three to five, account for the majority of total downtime. Improvement teams that skip this ranking step and instead chase whichever failure is freshest in memory tend to spread their limited engineering time across low-impact fixes while the real top losses stay untouched. Book a demo to see your top loss categories ranked automatically.
Running a Pareto Analysis on Downtime Data: Step by Step
The mechanics are straightforward once reason code data is reasonably clean, but each step matters for the ranking to reflect reality accurately.
1
Aggregate total downtime by reason code over a representative periodA period long enough to smooth out day-to-day noise, typically several weeks to a few months depending on production volume, gives a more reliable ranking than a single week that might be skewed by an unusual event.
2
Sort categories by total minutes lost, descendingRanking by cumulative time rather than by incident count is essential, since a category with fewer but longer stoppages can easily outweigh a category with many brief ones in actual production impact.
3
Calculate cumulative percentage of total downtimePlotting the running cumulative percentage against each successive category, from largest to smallest, shows visually how quickly the categories add up to the majority of total lost time.
4
Identify the top categories crossing the meaningful cumulative thresholdThe categories that together cross roughly seventy to eighty percent of cumulative downtime are the priority list for improvement effort, not the full list of every category ever logged.
5
Select improvement projects against that priority listImprovement project selection follows directly from the ranked list, ensuring engineering time and capital investment go toward the categories with the largest actual production impact first.
Stop Ranking Priorities by Memory Instead of Data
iFactory ranks your downtime categories by cumulative time lost automatically, showing exactly which causes deserve engineering attention first.
Illustrative Ranked Downtime Breakdown
| Rank | Cause Category | Cumulative Share of Total Downtime |
|---|
| 1 | Warp Break Stoppages | 32% |
| 2 | Unplanned Mechanical Failure | 51% |
| 3 | Material Shortage Delay | 64% |
| 4 | Changeover Time Overrun | 74% |
Why Count-Based Ranking Misleads
A category with the highest number of individual stoppages is not necessarily the category costing the most total production time, and treating incident count as the priority signal often points effort in the wrong direction.
Ranked by Count
Frequent brief adjustments or minor stops can dominate a count-based ranking simply because they happen often, even though each individual stop costs only a minute or two of lost time.
Ranked by Cumulative Time
A category with far fewer incidents but a much longer average duration per stop, such as a major mechanical failure, frequently outranks the frequent minor stops once total minutes lost are compared directly.
Rank by Actual Time Lost, Not by How Often Something Happens
iFactory calculates cumulative downtime by cause category automatically, giving your improvement team a Pareto ranking grounded in real production impact.
What a Focused Pareto Program Delivers
70–80%
Typical Cumulative Share From Top Categories
3–5
Categories Usually Driving Most Loss
Ranked
By Time, Not Incident Count
We had a list of fourteen downtime categories and were trying to run small improvement projects against nearly all of them at once, spreading our maintenance team thin with little to show for it. When we actually ranked them by cumulative minutes lost, four categories accounted for almost three quarters of our total downtime. Redirecting effort to just those four produced more visible improvement in one quarter than our previous scattershot approach had in a year.
Plant Reliability Manager
Discrete Manufacturing Facility — Pune
Frequently Asked Questions
QHow long a time period should a Pareto analysis cover to be reliable?
A period long enough to average out unusual one-off events, commonly a few weeks to a few months depending on production volume and how frequently stoppages occur, gives a more representative ranking than a single day or week that could be skewed by an atypical incident. Very high-volume operations may reach a reliable ranking faster than lower-volume operations simply because more downtime events accumulate in less calendar time.
QShould Pareto rankings be run separately for each machine or line, or combined across the whole plant?
Both views serve different purposes: a plant-wide ranking helps prioritize where to focus capital and engineering resources at a strategic level, while a machine-specific or line-specific ranking is more useful for a maintenance team trying to prioritize day-to-day work on a particular asset. Relying on only one view can hide a serious problem concentrated on a single machine that gets averaged out in a plant-wide aggregate.
Talk to an expert about setting up both views for your floor.QWhat happens after the top categories are fixed — does the ranking need to be redone?
Yes, re-running the Pareto analysis after addressing the previous top categories is an important part of the ongoing process, since fixing the largest loss category typically promotes a previously smaller category into the new top position, and continuing to work down the ranked list is how sustained improvement compounds over time rather than stopping after the first round of fixes.
QCan Pareto analysis be misleading if the underlying reason codes are too broad?
Yes, a broad, vague reason code can artificially dominate a Pareto ranking simply by absorbing multiple distinct underlying causes into one bucket, which is why a well-structured, sufficiently specific reason code taxonomy is a prerequisite for a Pareto analysis to point improvement effort at the right underlying problem rather than a catch-all category that masks several separate issues.
QHow quickly should a plant expect to see the Pareto ranking shift after starting a focused improvement program?
Once the top-ranked category's root cause is corrected and the fix is stable, the ranking typically shifts within the next reporting period as that category's contribution drops, though the exact timeline depends on how quickly the underlying root cause can be diagnosed and corrected. Continuous data tracking makes this shift visible in near real time rather than only at the next scheduled review.
Book a demo to see ranking shifts tracked over time.
Focus Improvement Effort Where the Data Says It Matters Most
iFactory ranks downtime causes by cumulative time lost automatically, so your team's next improvement project targets the biggest opportunity, not the loudest complaint.