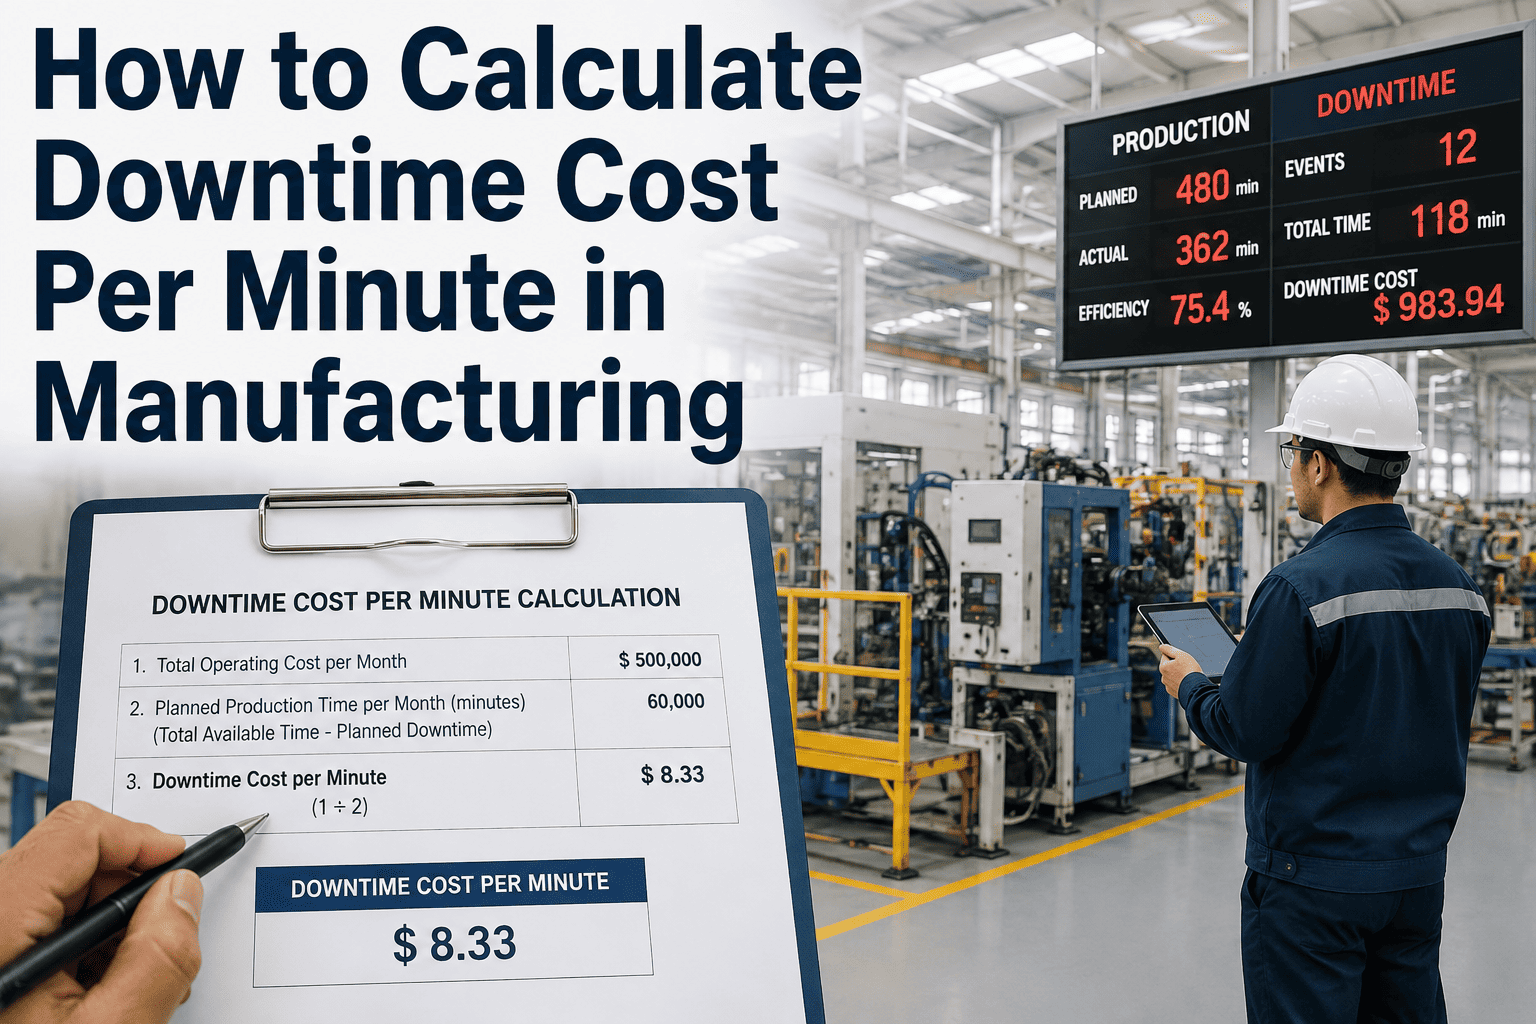
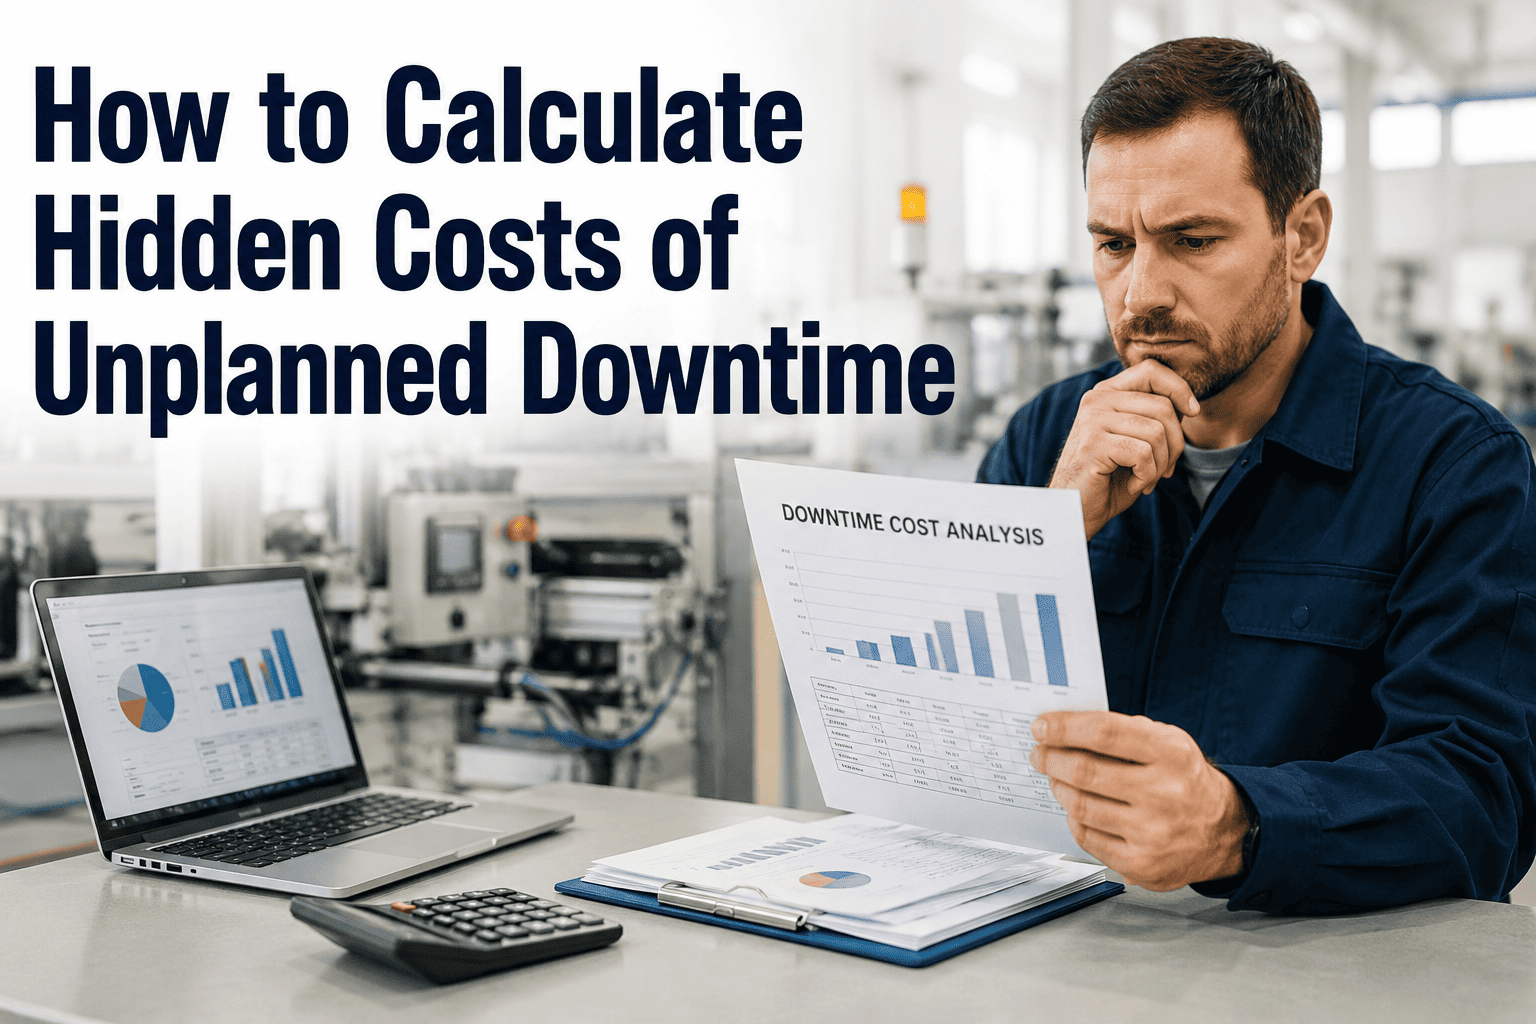
Asking for budget to fix a chronic stoppage is a very different conversation when you can say it costs the plant a specific rupee figure per minute rather than simply describing it as "frequent" or "annoying." Calculating downtime cost per minute pulls together production loss, idle labor cost, wasted energy, and the opportunity cost of unmet demand into a single number that makes a maintenance investment case concrete instead of anecdotal. Plants that skip this calculation often end up prioritizing capital spending based on which manager complains loudest rather than which stoppage is actually costing the most. Book a demo to see downtime cost per minute calculated for your lines.
Four Components of Downtime Cost
A complete downtime cost figure accounts for more than just the value of lost production, since idle resources and missed opportunity both carry real cost too.
Production Loss
The value of the output that would have been produced during the stopped minutes, calculated from standard throughput rate multiplied by contribution margin per unit, is usually the largest single component of total downtime cost.
Labor Idle Cost
Wages paid to operators and support staff who remain idle or under-utilized during a stoppage still accrue as a real cost even though no output is being produced during that time.
Energy Waste
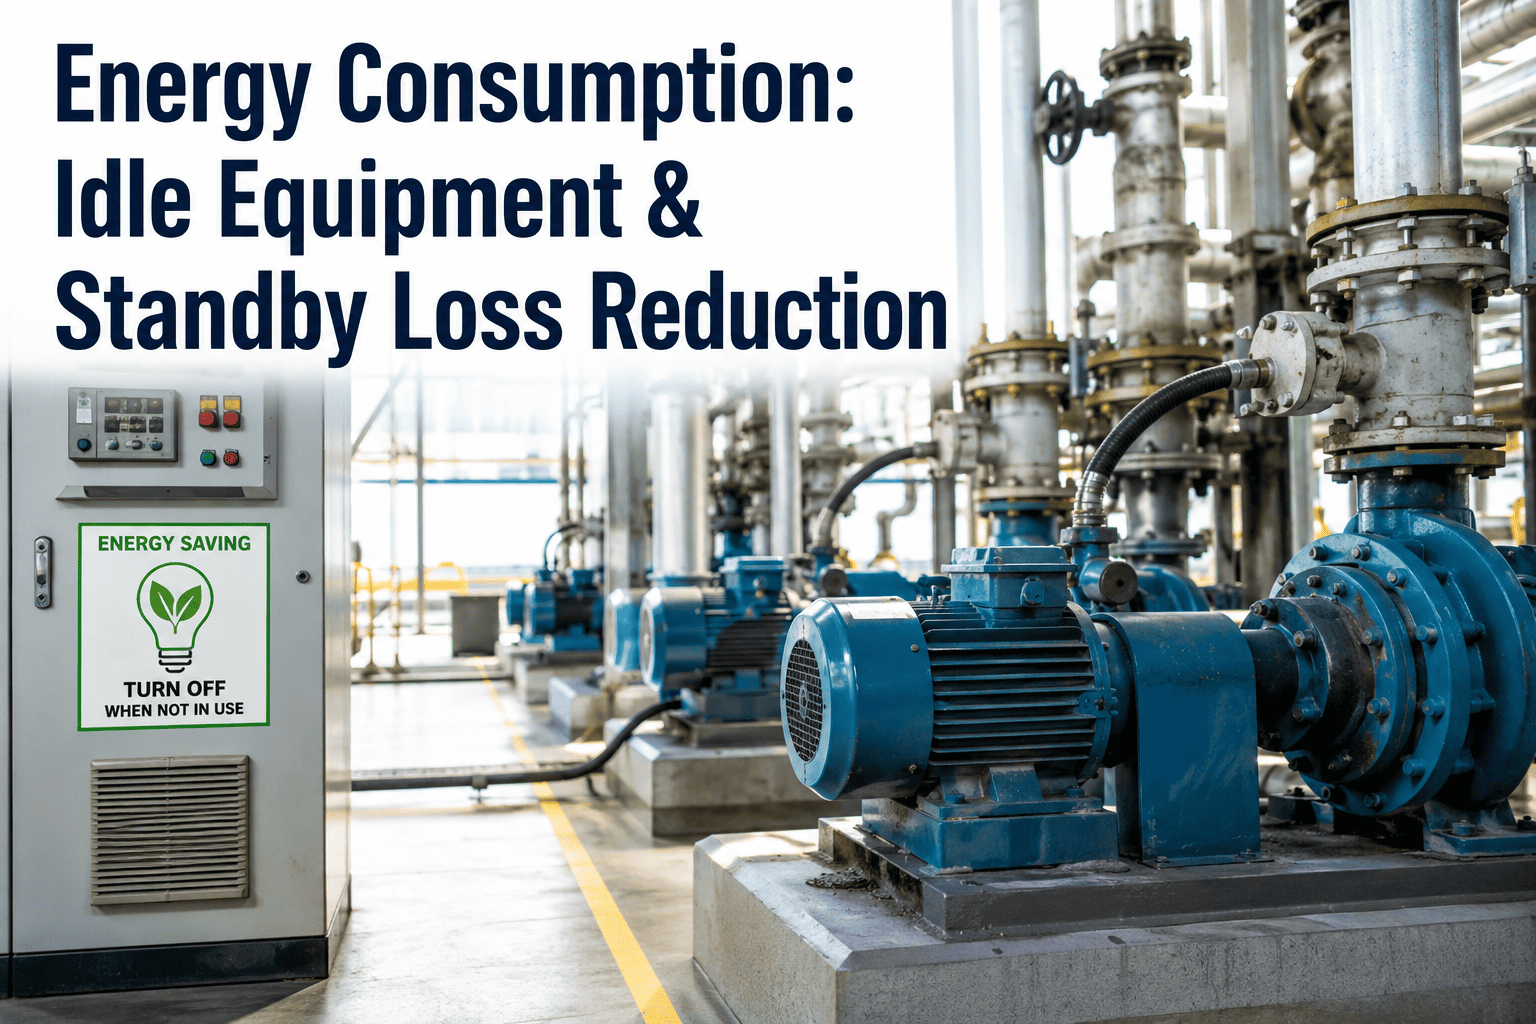
Equipment that continues drawing power, maintaining heat, or running auxiliary systems during a stoppage consumes energy without producing offsetting output, a cost that is easy to overlook but straightforward to calculate from utility rates.
Opportunity Cost
When a stoppage causes a plant to miss a delivery commitment or fall short of demand it could otherwise have met, the resulting cost, whether a penalty, an expedited shipment, or lost future business, belongs in a full accounting of downtime cost even though it is harder to quantify precisely than the other three components.
Turn Downtime Minutes Into a Number Finance Understands
iFactory calculates downtime cost per minute across production loss, labor, and energy automatically, giving you a defensible figure for every maintenance investment case.
A Simplified Calculation Framework
| Component | Calculation Basis | Data Source |
|---|
| Production Loss | Standard rate × contribution margin per unit | Production standards, cost accounting |
| Labor Idle Cost | Idle headcount × wage rate per minute | Payroll, shift staffing records |
| Energy Waste | Idle power draw × utility rate per unit | Utility billing, equipment power rating |
| Opportunity Cost | Estimated per incident, varies by context | Sales, customer commitments |
Applying the Calculation to a Priority List
Once cost per minute is known for a line or machine, multiplying it against actual downtime minutes for each cause category converts a Pareto ranking based on time into one based on financial impact.
1
Calculate cost per minute for the specific line or assetCost per minute varies meaningfully by line depending on product mix, staffing level, and equipment power draw, so a single plant-wide average often understates or overstates the true cost of a specific stoppage.
2
Multiply against downtime minutes by cause categoryApplying the per-minute cost figure to each reason code's total logged minutes converts a purely time-based Pareto ranking into a financial ranking, which sometimes reorders priorities compared to time alone.
3
Compare against the cost of the proposed fixWith both the cost of the problem and the cost of the proposed corrective action known, a straightforward payback calculation gives leadership a clear basis for approving or deprioritizing the investment.
Reorder Your Priority List by Financial Impact, Not Just Time
iFactory applies cost-per-minute figures against your downtime categories automatically, showing which fixes deliver the fastest payback.
What a Cost-Based View Delivers
4
Cost Components Calculated
Per Line
Not a Single Plant-Wide Average
Payback-Ready
Investment Cases Built From Real Numbers
We knew a particular line stopped often, but every time we tried to get budget approved for a fix, finance asked what it was actually costing us and we had no real answer beyond "it happens a lot." Once we calculated an actual cost per minute for that line and applied it to our logged downtime, the number was large enough that the investment approval took a single meeting instead of months of back and forth.
Operations Director
Packaging Manufacturing Plant — Ahmedabad
Frequently Asked Questions
QDoes downtime cost per minute change based on what product is running at the time?
Yes, since contribution margin per unit differs by product, a stoppage during a high-margin product run costs meaningfully more per minute than the same stoppage during a lower-margin run, which is why a single fixed cost-per-minute figure applied uniformly across all products can misrepresent the true financial impact of a specific downtime incident.
QHow is opportunity cost estimated when it's hard to quantify precisely?
Opportunity cost is usually the most approximate of the four components, often estimated from historical instances where a stoppage directly caused a missed delivery commitment, an expedited shipment cost, or a documented instance of lost order volume, and even a conservative estimate is generally more useful for prioritization purposes than omitting the component entirely.
Talk to an expert about estimating opportunity cost for your operation.QShould energy waste really be included, given it's usually a small fraction of total downtime cost?
Energy waste is typically the smallest of the four components in absolute terms, but including it still improves the accuracy of the total figure, and for equipment with high idle power draw, such as continuously heated processes, it can be a more meaningful contributor than it initially appears, making it worth calculating rather than assuming it is negligible without checking.
QHow often should the cost-per-minute figure be recalculated?
Recalculation is worthwhile whenever a meaningful input changes, such as a shift in product mix, a labor rate adjustment, or a change in energy tariffs, since any of these directly affects the underlying calculation. Absent such a change, revisiting the figure on a periodic basis, such as annually or with each budget cycle, keeps it aligned with current operating conditions.
QCan this calculation be used to compare investment priorities across different lines or plants?
Yes, and this is one of its more valuable applications, since a line-specific cost per minute allows leadership to compare the financial impact of downtime across different lines or even different plants on a consistent basis, which is far more useful for capital allocation decisions than comparing raw downtime minutes or efficiency percentages alone.
Book a demo to see cross-line cost comparison in practice.
Build Your Next Maintenance Investment Case on a Real Number
iFactory calculates downtime cost per minute across production, labor, and energy automatically, so every investment decision is grounded in actual financial impact.