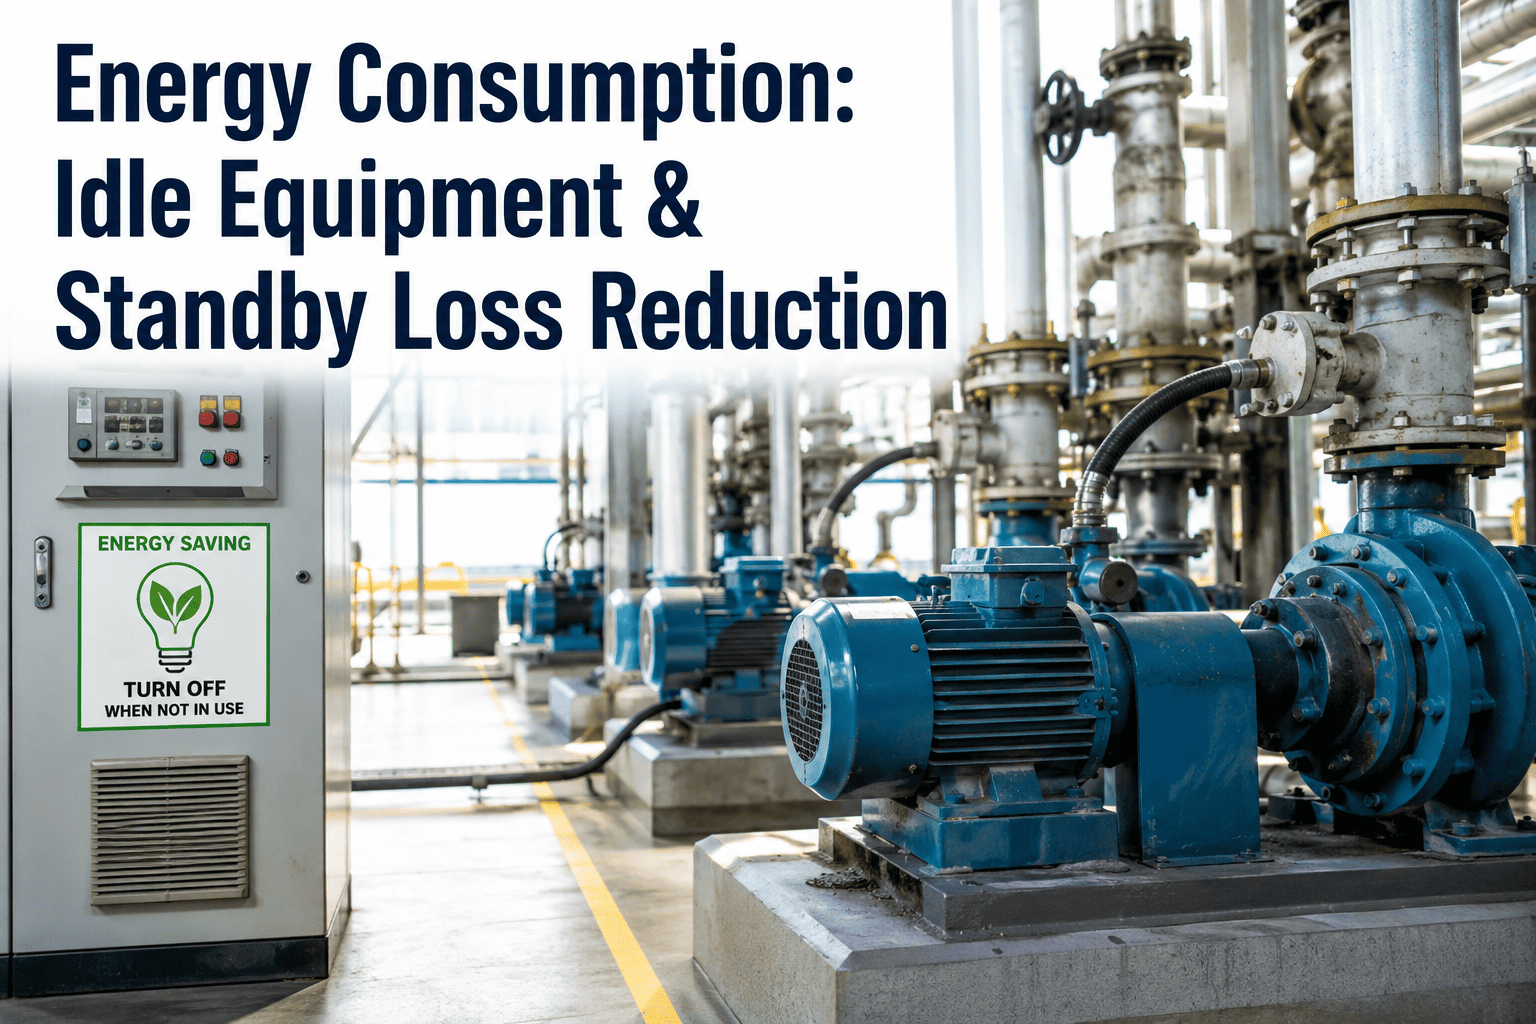
An injection molder sitting idle between cycles can still draw 40 to 60 percent of its full-load power, and it is far from alone on the floor. Control cabinets stay energized around the clock, thermal elements hold their set-point through the night, and coolant pumps keep circulating through loops with nothing moving through them, and none of it shows up as a line item anyone reviews. The U.S. EPA's ENERGY STAR Industrial Program has found that off-shift energy consumption in discrete manufacturing plants averages 15 to 25 percent of total facility consumption, with phantom loads like these making up most of that draw, and the only way most plants find out how much that actually costs is by finally measuring it machine by machine.
Your Machines Are Drawing Power Right Now, And Most Of Them Aren't Making Anything
Idle and standby draw quietly consumes 15 to 25 percent of total facility energy in a typical discrete manufacturing plant. Auto-shutdown policies and real-time standby monitoring turn that invisible drain into a tracked, recoverable cost.
Idle Draw Doesn't Show Up On The Utility Bill As Its Own Category — That's The Problem
A utility bill reports one number for the whole facility, blending productive energy use with every idle, standby, and phantom load running underneath it. That blending is exactly why idle loss survives budget review after budget review: nobody sees a line labeled machines doing nothing, so nobody investigates it, even though the underlying draw is completely measurable once someone puts a meter on the right circuit. A ten-machine molding floor where each unit idles three hours a day from material delays alone can consume roughly 360 kWh daily on idle power for zero output, which compounds into thousands of dollars a year that never appears anywhere as a distinct expense to cut. Multiply that same pattern across a facility with dozens of machine types, each with its own idle profile, and the aggregate loss frequently rivals the cost of a major planned efficiency project, except this one requires no capital investment to start recovering, only visibility into where it's happening.
Control Cabinets
Stay energized continuously to maintain PLC memory, network connectivity, and diagnostic readiness, regardless of whether the machine is producing.
Thermal Elements
Heaters, barrels, and dies often hold their process set-point through breaks and shift changes to avoid a slow re-heat, drawing power the entire time.
Coolant And Hydraulic Pumps
Frequently keep circulating through loops with no active load, since stopping and restarting them is treated as riskier than simply letting them run.
Compressors On Standby
Many systems stay loaded or lightly loaded well past the point where actual air demand justifies it, burning energy against a nearly empty system.
Three Habits That Quietly Let Idle Energy Waste Compound For Years
Idle loss rarely gets discovered through a dramatic failure. It persists because of a handful of ordinary operating habits that feel harmless individually but compound into a significant recurring cost when repeated across every machine, every shift, every day of the year.
Managing Energy From The Monthly Bill
A single lagging number covering the whole facility cannot reveal which line, machine, or shift is driving idle consumption, so the waste persists unseen for years, since no one is ever forced to look closer than the total.
Treating Energy And Production As Separate Problems
Idle draw, minor stops, and material-delay downtime are simultaneously a throughput issue and an energy issue, yet plants typically assign them to different teams, meaning fixing one rarely fixes the other even though a single root cause often drives both.
Leaving Shutdown Decisions To Individual Operators
Without a documented, enforced shutdown policy, operators default to leaving equipment running out of habit or convenience, especially near shift end, because the small inconvenience of restarting is more visible to them than the invisible cost of standby draw.
You Can't Fix What Isn't Being Measured At The Machine Level
A facility-wide kWh number tells you almost nothing about which machines are idling longest or which shifts leave the most equipment running unnecessarily. iFactory meters consumption down to the individual machine and correlates it against actual production state, so idle draw stops being an invisible line inside your utility bill and becomes a specific, addressable number for every asset on the floor.
What Actually Belongs In A Standby And Shutdown Policy That Holds Up In Production
A shutdown policy that exists only as a memo rarely survives contact with a busy shift. The policies that actually reduce idle draw are built around clear timing thresholds and machine-specific constraints, not a blanket rule applied the same way to every asset regardless of what it takes to restart safely.
Set A Machine-Specific Idle Threshold
Define how long a machine can sit without active production before triggering a lower-power or off state, since a five-minute pause and a three-hour material delay warrant very different responses.
Respect Motor Restart Limits
Most industrial motors, particularly on compressors, tolerate no more than roughly two starts per hour due to the heat generated by current inrush at startup, so shutdown timers need a built-in anti-cycling delay to avoid damaging the equipment they're meant to protect.
Use Intermediate Standby States, Not Just On/Off
Machines like CNC centers benefit from multiple sleep states rather than one binary standby mode, since a partial power-down for a short pause and a full shutdown for an overnight gap require different components to stay live.
Automate The End-Of-Shift Sequence
Relying on operators to manually shut down every machine at shift end introduces the same inconsistency that created the problem, so an automated sequence tied to schedule and idle status closes that gap without adding a task to anyone's list.
Why Idle Loss Is Getting More Expensive Every Year, Not Less
Idle draw has always been a cost, but the rate at which that cost is growing has changed the urgency around fixing it. U.S. industrial electricity prices have climbed roughly 17 percent over four years, moving from around 15 cents per kilowatt-hour in 2022 to nearly 17.65 cents in 2026, with industrial rates specifically up close to 4 percent year over year heading into this year. Total manufacturing energy consumption has also risen over the same broader period as production volumes recovered and expanded, meaning the base against which that rising per-unit rate applies keeps growing too.
The practical effect is that a facility carrying the same idle-hour habits it had several years ago is now paying meaningfully more for that exact same waste without producing a single additional unit from it. This is part of why idle and standby reduction increasingly gets framed as a margin protection issue rather than a purely environmental one, since the savings recovered do not depend on winning new business or raising prices, they simply stop paying for output that was never happening in the first place.
What Idle And Standby Loss Actually Costs, In Numbers Plants Can Verify
The figures below reflect ranges reported across manufacturing energy audits, industry toolkits, and case-level data on idle and standby power in discrete manufacturing environments, giving a realistic picture of what unmanaged idle draw costs and what disciplined management recovers.
Not Every Machine Deserves The Same Attention — Prioritize By Idle Hours And Draw
Chasing every possible phantom load at once spreads effort thin without meaningfully moving the total. A faster path is ranking equipment by the combination of how many hours it typically sits idle and how much power it draws while doing so, since that combination is what actually determines annual cost, not either factor alone.
| Equipment Type | Typical Idle Draw | Priority Action |
|---|---|---|
| Injection Molders | 40-60% of full load | Auto-standby on material delay timeout |
| Air Compressors | High even when unloaded | Auto/dual shutdown mode with anti-cycling timer |
| CNC Machining Centers | Moderate, component-dependent | Multi-state sleep policy by component |
| Coolant & Hydraulic Pumps | Continuous if not interlocked | Interlock pump run state to active load demand |
| Control Cabinets & HMIs | Low per unit, high in aggregate | Low-power standby mode outside shift hours |
Why A Timer Alone Doesn't Solve The Problem A Monitoring System Does
Shutdown timers help, but a timer set once and left alone eventually stops matching how the floor actually operates, since production schedules, material flow, and shift patterns all shift over time in ways a fixed timer cannot follow. iFactory's platform connects to the power monitoring, PLC, and machine controller data already present on most modern equipment to track real idle state continuously, distinguishing a genuine production pause from a scheduled maintenance window or a legitimate warm-up period that a blunt timer would otherwise interrupt at the wrong moment.
Machine-Level Idle Tracking
Every asset's idle hours and standby power draw are logged individually, replacing a single facility total with a ranked list of where energy is actually being lost.
Production-State Correlation
Idle detection is checked against actual production schedule and order data, so a legitimate changeover is never flagged the same way as unplanned idle time.
Shift And Operator Comparison
Aggregated idle data by shift surfaces which teams consistently leave more equipment running, turning a vague impression into a specific, coachable pattern.
Automated Shutdown Triggers
Where safe and appropriate, the platform can trigger low-power or off states automatically once a machine crosses its idle threshold, removing the dependency on manual operator action entirely.
A Rollout Sequence That Builds Confidence Before It Automates Anything
The fastest way to lose floor buy-in on an idle reduction initiative is to start by automatically shutting machines down before anyone trusts the data behind that decision. A more durable rollout begins with visibility, moves to policy, and only automates once both have proven reliable.
Start by metering the highest-consumption equipment and establishing a real idle-hours baseline for at least a few weeks of normal production, since a baseline built on a single unusual week will misrepresent the true pattern. Once the baseline is credible, layer in a documented shutdown policy with machine-specific thresholds and communicate it clearly to every shift, giving operators time to adjust before any automatic enforcement begins. Only after the policy has run manually for a stable period should auto-shutdown triggers be enabled, and even then a phased rollout, starting with the equipment carrying the least restart risk, keeps the transition from becoming a production disruption in its own right.
Common Questions From Plant Managers On Idle And Standby Loss Reduction
Stop Paying Full Utility Rates For Machines That Aren't Making Anything
iFactory meters idle and standby draw down to the individual machine, correlates it against real production state, and helps you enforce a shutdown policy that actually holds up on the floor. Book a demo and see exactly how many idle-hours your own equipment is running right now.